MetroHartford, Connecticut Have Strong Linguistic Diversity; Plus for Global Marketplace

The number of languages spoken in Connecticut is considerably larger than most people expect.  That fact was highlighted in the recent MetroHartford Progress Points Report, prepared for the MetroHartford Alliance.  The linguistic diversity and global connections of the region are reflected in schools and employers, with more than 100 different languages spoken in homes of students attending schools throughout the region, according to the report.progress points report The “number of students with non-English home language” according to data on the website of the State Department of Education include Avon, 185; Bloomfield, 59; East Hartford, 1,124; Farmington, 474; Hartford, 8,371; Manchester, 335; Newington, 653; Simsbury, 228; South Windsor, 328; Tolland, 14; West Hartford, 1,876; and Windsor, 280.  The report indicated that 75 percent of English language learner (ELL) students are Spanish-speaking, 25 percent speak other languages at home.

Some of the languages spoken in the homes of students attending schools in the region may be unexpected.  In Manchester, for example, the lead languages are Spanish, Bengali, and Urdu, and the list also includes Twi/Fante, Telugu, and Gujarati.

The Hartford region consists of 750,000 people living in the city of Hartford, its surrounding inner-ring suburbs, and outer-ring and rural towns that have historical, economic or social ties with the city.

In 2013, the Hartford Foundation for Public Giving gathered a group of regional stakeholders to develop a unique community partnership that came together to collect, analyze and disseminate a broad range of data, to place a spotlight on some of the central challenges and opportunities for the region. The goal was to share critical information “with residents and policymakers that will result in meaningful dialogue and propel action in our communities.”  Among the report’s areas of research is “increasing globalization through immigration,” using data from the state Department of Education (SDE).progresspointslogo

Sponsoring organizations of Metro Hartford Progress Points include Capital Workforce Partners, Trinity College’s Center for Urban and Cultural Studies, the Capitol Region Council of Governments, the Hartford Foundation for Public Giving, Hispanic Health Council, MetroHartford Alliance, United Way of Central and Northeastern Connecticut, Urban League of Greater Hartford and the City of Hartford.

Data on English-language learners and languages spoken in schools is based on reports retrieved from the SDE CEDAR Data Tables on English Language Learners, for both Number of English Language Learners (ELL) and Languages Spoken by Connecticut Students for the 2010-11 school year, the most recent data available.

Statewide, the variety of languages spoken by Connecticut students is considerable.  Nearly 73,000 students live in homes with a “non-English home language,” according to the State Department of Education. The leaders include:

  • Spanish                        47,190
  • Portuguese                  2,846
  • Polish                          2,279
  • Albanian                      1,263
  • Chinese                       2,215
  • Creole-Haitian             1,714
  • Arabic                         1,159
  • Vietnamese                 1,157
  • Urdu                            1,131
  • Russian                        811
  • French                         762
  • Gujarati                       738
  • Serbo-Croatian            705

For the uninitiated, Gujarātī is an Indo-Aryan language spoken by about 46 million people in the Indian states of Gujarat, Maharashtra, Rajasthan, Karnataka and Madhya Pradesh, and also in Bangladesh, Fiji, Kenya, Malawi, Mauritius, Oman, Pakistan, Réunion, Singapore, South Africa, Tanzania, Uganda, United Kingdom, USA, Zambia and Zimbabwe.  And, apparently, Connecticut - in the homes of 738 s
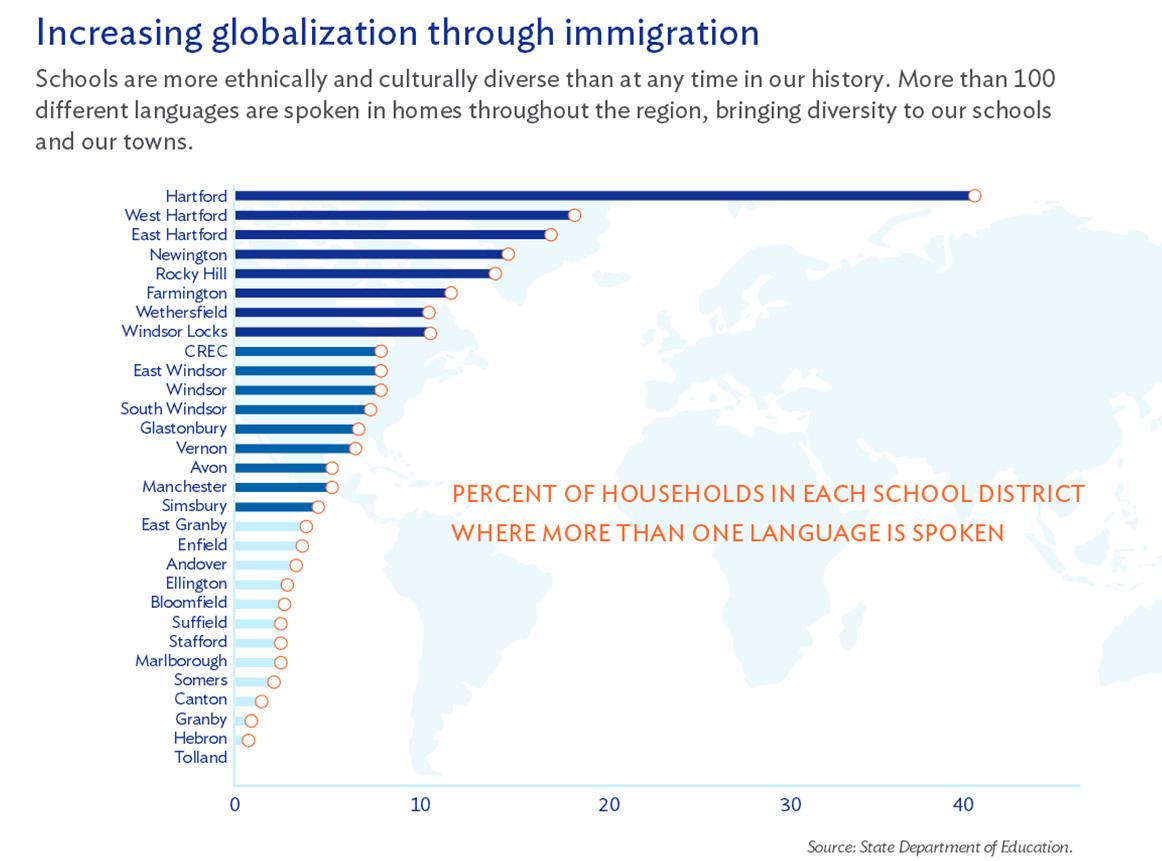
languages spokentudents.

Close to 100 million people around the world speak Urdu. It is the official language of Pakistan, a status and is also spoken and understood in parts of India, Bangladesh, Nepal, the Middle East.

The Progress Points partners include: Capital Workforce Partners, Capitol Region Council of Governments, City of Hartford, Hartford Foundation for Public Giving, Hispanic Health Council, MetroHartford Alliance, Trinity College Center for Urban and Global Studies, United Way of Central and Northeastern Connecticut , and the Urban League of Greater Hartford.

https://www.youtube.com/watch?feature=player_embedded&v=0zTQjsbNlw0

Immigration Reform: Economic Impact in Connecticut

As the fate of immigration reform remains unresolved in Congress, plays out on the nation’s borders, and is debated  in states around the country - including Connecticut -  the potential economic benefits remain an element in the debate.  Connecticut-centric data seeks to provide local context as a new national immigration policy is considered and stalled and considered again in Washington, D.C. Some highlights, as released by the White House, point out that immigration reform will “strengthen Connecticut’s economy and creates jobs.”  Some of the data points that have been part of the past year's debate:

• Immigrants alreaImmigration-reformdy make important contributions to Connecticut’s economy. For example, Connecticut’s labor force is 16.7% foreign-born.

• 18.5% of Connecticut business owners are immigrants. These businessmen and women generate $2.05 billion in income for Connecticut each year.

• In Connecticut, 38.2% of science, technology, engineering, and math (STEM) graduates at the state’s most research-intensive schools are foreign-born. Also, 68.2% of the state’s engineering PhDs are foreign-born.

• According to Regional Economic Models, Inc., a set of reforms that provides a pathway to earned citizenship and expands a high-skilled and other temporary worker programs would together boost Connecticut’s economic output by $568 million and create approximately 6,904 new jobs in 2014.  By 2045, the boost to Connecticut’s economic output would be around $3 billion, in 2012 dollars.

The White House has also indicated that “common sense immigration reform increases workers’ income, resulting in new state and local tax revenue, contribute to the recovery of Connecticut’s housing market and strengthen Connecticut’s technology, agriculture, and tourism industries:

• Providing a pathway to earned citizenship and expanding high- and low-skilled visa programs will increase total personal income for Connecticut families by $1.6 billion in 2020, according to Regional Economic Models, Inc.

•  Immigration reform would have increased the state and local taxes paid by immigrants in Connecticut by approximately $29 million in 2010, according to one study.

• Immigrants significantly increased home values in Connecticut between 2000 and 2010 - in New Haven County, the increase was $2,680 for the median home.

• There are 4,916 farms in Connecticut that sell approximately $552 million in agricultural products. Noncitizen farm workers accounted for 24% of all farm workers in Connecticut between 2007 and 2011. According to one study, in 2020 an expanded temporary worker program would mean 264 new jobs for U.S. citizens and immigrants (including jobs not only in agriculture, but also retail trade, construction, and other sectors) in Connecticut, and increase Connecticut’s real personal income by $15 million in 2012 dollars.

• These provisions will increase tourism to the U.S., including to Connecticut - which saw approximately 307,000 overseas visitors in 2011.

An August 2014 poll by FOX News found that by a more than three-to-one margin, voters nationwide would pick immigration reform that only includes a pathway to citizenship over no Congressional action at all.  The  poll finds 65 percent of voters prefer legislation that only focuses on creating a pathway for certain illegal immigrants if that’s the only action Congress takes on immigration this year.   The survey also found substantial bipartisan agreement on the issue: 76 percent of Democrats and 56 percent of Republicans say something is better than nothing on immigration reform, and 60 percent of independents agree, FOX News reported.

Pay Equity Gap Between Men and Women Begins As Children, Studies Show

The stubborn pay equity gap between men and women – larger in Connecticut than some neighboring states – apparently has its roots in childhood. National surveys indicate that parents are more likely to give their sons an allowance than their daughters. Among all young people surveyed, 67 percent of boys compared with 59 percent of girls say they get an allowance from their parents, according to Junior Achievement USA® (JA) and The Allstate Foundation’s 2014 Teens & Personal Finance Survey.allowance hand

A study by the University of Michigan Institute for Social Research found that girls do two more hours of housework a week than boys, while boys spend twice as much time playing. The same study confirmed that boys are still more likely to get paid for what they do: they are 15 percent more likely to get an allowance for doing chores than girls.  Study Director Frank Stafford indicated that the trend continues into adulthood. allowance graphic

Writing this month in the National Journal, Connecticut Congresswoman Rosa DeLauro pointed out that “right now, women make less than men in nearly every occupation for which wage data are tracked. One year out of college, women are paid 18 percent less than their male counterparts. Ten years out of college, the wage gap leaves women earning 31 percent less.  Over a 35-year career, these earnings discrepancies swell to exceedingly large sums. Across the entire workforce, the average career-long pay gap is $434,000. For college-educated women, the pay deficit averages $654,000.”

Earlier this year, CT Mirror reported that “women in Connecticut earn about 78 percent of what men make.  Numbers from the 2012 Census show that Connecticut's gender wage gap is wider than in many other states in the Northeast; and that, within the state, the gender difference varies as well. The most pronounced gap…is in Fairfield County.”

In a November 2013 report, the Governor’s Gender Wage Gap Task Force indicated that “Connecticut still has a long way to go before the gender wage gap is eliminated.”  The 14-member task force found that that “more mothers than ever before are the sole or primary breadwinners of their families. Yet, women in Connecticut are more likely than men to live in poverty and below the self-sufficiency standard. 24% of households in Connecticut headed by women with children fall below the federal poverty level. Eliminating the wage gap would provide critical income to these families.”

The report also indicated that “among all full-time, year-round workers, Connecticut women earn, on average, 22%-24.2%less than men. This gap is even more pronounced among minority women. Understanding this inequity is not a simple matter. Many factors contribute to the overall wage gap including education and skills, experience, union membership, training, performance, hours worked and the careers women and men choose. However, even after these factors are controlled for, an estimated wage gap of 5-10% remains.”

In 2012, the National Partnership for Women and Families reported that “If the wage gap were eliminated, a working woman in Connecticut would have enough money for approximately:

  • 109 more weeks of food
  • 7 more months of mortgage and utilities payments
  • 14 more months of rent
  • 44 more months of family health insurance premiums
  • 3,410 additional gallons of gas

The Connecticut Task Force issued a series of recommendations to address the pay equity gap, focused on current workplaces, businesses, training and education.  Apparently, efforts need to begin sooner, when youngsters begin household chores and ask for an allowance.

gender gap map

Fairfield County May Hold Key to Trans-Atlantic Flights at Bradley; Passenger Numbers Increasing

Bradley International Airport has seen passenger traffic increase for two consecutive months, and is stepping up efforts to re-establish service to trans-Atlantic destinations. The Connecticut Airport Authority (CAA) is working with the state’s business community and potential airline carriers to demonstrate the need for the overseas service. In May, passenger traffic at Bradley increased 9 percent, compared with a 7.8 percent decrease at T.F. Green Airport in Providence and a 9.5 percent decrease at Manchester Regional Airport in New Hampshire. Logan International Airport in Boston increased 7.5 percent that month.

During June, Bradley saw a 9.3 percent increase in passengers, while Providence saw a 7.3 percent decrease and Manchester saw passenger numbers drop by 14.6 percent. Logan experienced a 4.1 percent increase in June.  July data was not yet available.

Kevin A. Dillon, ExecuBradley_INTL_Logo.svgtive Director of the Connecticut Airport Authority, told members of the CAA at their August meeting that the state’s improved economy and ongoing efforts to add capacity at the airport are lead factors in the upbeat numbers. United Airlines recently announced plans to begin service to Houston in October. In June, JetBlue initiated service from Bradley to Reagan National Airport in Washington, D.C.

Year to date, Dillon reported, passenger numbers at Bradley are up 10.6 percent, while Providence is down 6.8 percent, Manchester is down 13.0 percent, and Logan is up slightly, 4.4 percent.

The return of trans-Atlantic service to Bradley is one of the CAA’s top priorities, Dillon said. Much of the business case for trans-Atlantic routes depends on corporate clients outside the immediate Hartford-Springfield market, Dillon explained. He indicated that the CAA would be “orienting our advertising program for the next year” toward Fairfield County and Southeastern Connecticut, to include targeted outreach urging potential business customers to “give Bradley a try,” underscoring that “Bradley is a great option” compared with the New York airports.

The CAA is also poised to move forward with the demolition of the old Terminal B at Bradley, with the contract awarded to S&R Corporation of Lowell MA, with a price tag of $12, 572,622.75. The CAA anticipates that the demolition will begin before the end of this month, consistent with the airport’s strategic plan. The goal of the CAA is to make Connecticut’s airports more attractive to new airlines, bring in new routes, and support Connecticut’s overall economic development and growth strategy.CAA logo

Members of the CAA also discussed a potential new retail business for the airport – Dairy Queen – and approved plans for a 20-year agreement with WFSB-TV for the lease of land at Bradley for a Doppler radar installation at Bradley, which would be relocated from Terminal B where it has been since 1999.

Bradley will also be enhancing band-with capacity of wi-fi at the airport, which has seen increased usage as passenger levels have increased.

Bradley International Airport is the second largest airport in New England. According to the most recent economic impact analysis, Bradley contributes $4 billion in economic activity to the state of Connecticut and the surrounding region, representing $1.2 billion in wages and 18,000 full-time jobs. The CAA was established in 2011 to develop, improve, and operate Bradley International Airport and the state’s five general aviation airports.

CT Women Underrepresented Among Top Earners; 4th Widest Gap in US

In only three states in the nation are women more underrepresented among the top 1 percent of wage owners, when compared with the state’s overall female population. Connecticut ranks 4th – after South Dakota, New Hampshire and Wyoming – in underrepresentation of women among the top earners in the state. Connecticut has a ratio of 6 men for every woman in the state’s top 1 percent of wage earners. South Dakota has the widest gap and largest ratio, at 8.2.

In Connecticut, 51.3 percent of the state’s population is female, yet only 14.4 percent of the top 1 percent of wage earners in the state are women. That is a gap of 36.9 percent, ranking the state fouTheOnePercentrth.  In Wyoming the gap is 37.1 percent, in New Hampshire 38.6 percent, and in South Dakota, 39 percent. In South Dakota, with the widest gap, only 10.9 percent of the wage earners in the top one percent are women.

On the other end of the spectrum, the gap in Delaware is 10.6 percent, in Hawaii 16.8 percent, Rhode Island 17.8 percent and Vermont 21.7 percent. The ratio of males to females among the top one percent earners is 1.4 in Delaware, 2.0 in Hawaii, 1.9 in Rhode Island and 2.5 in Vermont, compared with Connecticut’s 6.0.

Bloomberg ranked the U.S. states and the District of Columbia on the extent to which females are underrepresented in the 1% income bracket, utilizing U.S. Census data.

Connecticut also had the nation’s second highest threshold income to gain entry into the one percent club, at $429,793. Only Alaska, at $500,052 was higher. Just slightly lower than Connecticut was the District of Columbia, New York, New Jersey, North Dakota and Minnesota ($387, 414). At the opposite end of the states tally was Wyoming, with an income of $244,207 placing individuals in the state’s top one percent of earners.

In the percentage of women in the overall population, Connecticut ranked 10th, at 51.3 percent. Only 10 states have more men than women in their population. Alaska has the highest percentage of men, at 52.1, and the District of Columbia the highest percentage of women, at 52.7. Following closely behind are Rhode Island and Mississippi, both with 51.7 percent of their population being female.

Using data from the U.S. Census, Bloomberg calculated the approximate 99th percentile, or top 1%, of inflation-adjusted wage or salary income figures for those ages 16 and older and employed. Gender information was extracted and the gap between the percentage of females in the 1% bracket and the percentage of females in the state's population was calculated.

Hartford Region Improves Among Nation's Best Performing Cities in 2013

The Hartford region was the state’s only metropolitan area to improve its ranking relative to other metropolitan areas around the country in an analysis of job growth and regional economic factors in 2013 that ranked the nation’s top 200 Best Performing Cities. The top ranked Connecticut metropolitan area was Hartford-West Hartford-East Hartford, which ranked #85 among the nation’s top 200, an improvement in ranking from #93 the previous year.state map

Connecticut’s other major metro areas dropped in the rankings: Bridgeport-Stamford-Norwalk dropped to #106 from #94 in 2012, New Haven-Milford fell to #142 from #109 , and Norwich-New London ranked #187, falling from #152 the previous year.

Best Performing Cities Index Report (PDF)The 2013 Milken Institute Best-Performing Cities Index ranks U.S. metropolitan areas by how well they are creating and sustaining jobs and economic growth. The components include job, wage and salary, and technology growth.

Topping the list of Large Cities were Austin-Round Rock–San Marcos, Texas and Provo-Orem, Utah followed by San Francisco-San Mateo-Redwood City, CA, San Jose-Sunnyvale-Santa Clara, CA and Salt Lake City, UT. Rounding out the top 10 were the metropolitan areas of Seattle, Dallas, Houston, Boulder, and Greeley, CO.

Biggest gainers on the list include Hagerstown-Martinsburg, Md.-W.V. (70th, up 100 slots); Tulsa, Okla., (42nd, up from 118th), and Phoenix, (66th, up from 122nd). Within the top 25 metro areas, Texas claimed seven spots; Colorado and California each had four.

The website interactive features offer a means of comparing cities in the various economic factors.  In most years, according to the study authors, the factors evaluated in the index give a good indication of the underlying structural performance of regional economics.

A nonprofit, nonpartisan economic think tank, the Milken Institute works to improve lives around the world by advancing innovative economic and policy solutions that create jobs, widen access to capital, and enhance health.

Best Places for Home Ownership? Glastonbury, Enfield, Terryville Top List

The best places for home ownership in Connecticut are in Glastonbury, Enfield and Plymouth, according to an analysis that included home ownership rates, monthly homeowner costs, median household income, home value and population growth. Glastonbury Center, the Southwood Acres section of Enfield and the Terryville section of Plymouth were ranked as the top three slices of Connecticut for home ownership in the analysis by the website nerdwallet.com, which provides analysis on financial and consumer issues. Rounding out the top 10 were the Kensington section of Berlin, Simsbury Center, Cos Cob, Trumbull, Windsor Locks, Orange and North Haven.home map

NerdWallet looked at 60 communities in Connecticut with populations of at least 5,000 to determine what places were the best for homeownership. Overall, the pointed out that “although its median home value is substantially higher than the national average, Connecticut’s proximity to New York and Massachusetts, and its many commuting options, make the state a top destination for homeownership.”

Of the top three, the website pointed out:

  • With a two-year population growth of 6.95% and an unemployment rate of just 1.4%, Glastonbury Center has all the signs of a top home destination.
  • Up north, near the border with Massachusetts, Southwood Acres is within driving distance of Hartford and Springfield, Mass., and boasts the highest homeowner rate among our top 10.
  • Terryville is the largest village within the town of Plymouth. It has shown relatively strong population growth (2.57%), and is the most affordable median home value among our top 10.

The next ten on the list of best places for home owneership in Connecticut include: 11. Shelton (city), 12. Newington, 13. Stratford, 14. Wethersfield, 15. West Hartford, 16. Bethel, 17. Riverside section of Greenwich, 18. East Haven, 19. Milford (city), and 20. Winsted.

The analysis focused on three main questions:

Are homes available? They looked at the area’s homeownership rate to determine the availability of homes. Areas with a high homeownership rate led to a higher overall score. (A low homeownership rate was seen as indicating competitive inventory, more options for renters rather than buyers and expensive housing.)

Can you afford to live there? They looked at median household income, monthly homeowner costs and median home value to assess affordability and determine whether residents could live comfortably in the area. Monthly homeowner costs were used to measure cost of living. Areas with high median incomes and low cost of living scored higher.

Is the area growing? The website’s analysis measured population growth to determine if the area is attracting new residents and showing signs of solid growth. This was seen as a signal of a robust local economy - another attractive characteristic for homebuyers.

Homeownership rate and population change from 2010 to 2012 each made up 33.3% of the total score, using data from the U.S. Census American Community Survey 5-year estimates. Selected monthly owner costs as a percentage of median household income made up 16.7% of the total score, and median home value made up 16.7% of the total score.


top 20

CT Ranks in Top 10 for Lowest Total Carbon Emissions, Lowest Per Capita Emissions

Connecticut ranks in the top 10 among the states in both the lowest total state energy related carbon dioxide emissions and emissions per capita.  The state ranked second, tied with California and just behind New York, in the lowest emissions levels per capita.  In total state energy related emissions, Connecticut placed in a tie for tenth place. Greenhouse gas emissions for all sources were considered in compiling the data, according to Bloomberg.com, which published the rankings last month, based on 2011 U.S. Census population estimates and statistics from the U.S. Energy Information Administration.  Sources of emission include electric power production, industries, residential heating and transportation.

The lowest state emission levels per capita, in metric tons of carbon dioxide, are New York (8.1), Connecticut (9.2), California (9.2), Oregon (9.3), Vermont (9.6), Massachusetts (10.0), Washington (10.1), Idaho (10.1), Rhode Island (10.5) and Maryland (11.0).  The highest levels per capita were in Wyoming (112.6), North Dakota (79), Alaska (52.7) and West Virginia (51.7).

In total state energy related carbon dioxide emissions, by million metric tons, the states with the lowest emission levels are Vermont (6), Rhode Island (11), Delaware (12), South Dakota (14), New Hampshire (16), Idaho (16), Maine (17), Hawaii (19), Montana (32), Connecticut (33) and Nevada (33).

The states with the highest emission levels were Texas (656 metric tons), California (346), and Pennsylvania (245).


carbon emissions

Connecticut Energy Costs are Third Highest in the US, Analysis Finds

The only states in the nation with higher monthly energy bills for consumers are Mississippi and Hawaii. Connecticut is ranked as the 3rd most energy expensive state in the country, according to a new analysis by WalletHub, which used six key metrics to rank the swh-best-badges-150x150-2tates according to their tendency to produce the highest or lowest monthly energy bills. The analysis points out that “lower prices don’t always equate with lower costs, as consumption is a key determinant in the total amount of an energy bill.” Connecticut’s monthly energy cost for consumers, according to the analysis, is $404, ranking the state 49th out of 51 (the 50 states plus the District of Columbia). Mississippi’s total monthly cost paid by consumers averages $414, while Hawaii’s is $451.

In terms of specific energy sources, the state ranked 50th in monthly electric cost ($143) and 48th in the cost of natural gas ($94). Perhaps due to the size of Connecticut, the state ranked 14th in fuel cost, at $167 per month, despite the state’s gas tax being among electricity pricethe highest in the nation. (see breakdown below)

In the United States, 7.1 percent of the average consumer’s total income is spent on energy costs, including fuel, natural gas and electricity.

The states with the least expensive energy costs for consumers, taking consumption into account, are Colorado ($301), Washington State ($302), Montana ($305), Rhode Island ($307), Nebraska ($312), the District of Columbia ($314), Pennsylvania ($317), Arkansas ($319), Delaware ($319) and Iowa ($319).

The other New England States, in addition to Rhode Island landing towards the top and Connecticut near the bottom, were bunched in the middle: Massachusetts ranked #35, New Hampshire #26, Vermont #28, and Maine #32. natural gas

Breaking out prices from consumption, Connecticut’s energy picture for consumers as compared with other states, is:

  • 49th – Price of Electricity
  • 16th – Electricity Consumption per Consumer
  • 44th – Price of Natural Gas
  • 48th – Natural Gas Consumption per Consumer
  • 46th – Price of Fuel
  • 10th – Fuel Consumption per Driver

The analysis was released in July because it tends to be the hottest month of the year in the contiguous U.S., and as a result it has the highest energy consumption.wallethub map

If you’re wondering how all this was calculated, WalletHub provides the answer: (Average Monthly Consumption of Electricity x Average Retail Price of Electricity) + (Average Monthly Consumption of Natural Gas x Average Natural Gas Residential Prices) + [Average Fuel Price * (Average Monthly Vehicle Miles Traveled / Average Car Consumption / Number of Drivers)] = Average Monthly Energy Bill Consumers Pay in Each State

WalletHub, described as “the social network for your wallet,” provides data to help readers “make smart financial decisions.” The site points out that “during the summer, when many Americans undergo major life transitions such as relocating to start a new job or start a family, the difference in energy costs among states becomes an important financial consideration.”  Connecticut ranks #49.


CT’s 4th Congressional District Ranks #5 in US for Income Inequality

Connecticut’s 4th Congressional district, centered in Fairfield Country, has been ranked as the district with the 5th highest level income inequity in the nation. A ranking of congressional districts of by their level of income inequality, conducted by Bloomberg, uses the Gini coefficient, a formula that measures the distribution of income across a population. The closer a Gini number is to 1, the greater the level of inequality; the closer to zero, the closer to perfect equality.

Generally, the Bloomberg Businessweek website points out, the U.S. congressional districts with the most inequality share certain traits: “they contain a small, enormously wealthy elite surrounded by impoverished neighbors.” Most of the districts with the greatest disparity are located in or near major urban metropolitan aRich-vs-poor-directionsreas such as New York, Philadelphia, Chicago, Boston, Atlanta, and Washington.

The congressional district where inequality is highest turns out to be New York’s 10th, with a Gini coefficient of .587; followed by Pennsylvania’s 2nd District, at .583; Illinois’ 7th District, at .574, and Florida’s 27th District at .562. Connecticut’s 4th District is next, at .561, followed by New York’s 12th District, Ohio’s 11th District, Georgia’s 8th District and New York’s 16th District. The most equal district is Virginia’s 11th, at .385.

"The big take-away," according to Bloomberg Businessweek: “A strikingly high level of inequality exists throughout the United States.” Also of note, 9 of the top 10 districts with the greatest income inequality are currently represented in Congress by Democrats, including Connecticut’s Jim Himes, Georgia’s John Lewis, Washington D.C.’s Eleanor Holmes Norton, and New York’s Jerrold Nadler, Carolyn Maloney and Eliot Engel.

Breaking down the state’s population into five segments, by income, Connecticut ranked 10th in the share of household income among the lowest income quintile, 5th in the second quintile, 4th in the third quintile, 5th in the fourth quintile at and 4th in the highest-income quintile.

The website takes the state-by-state comparison one step further, providing context by comparing the state data with data compiled by the Central Intelligence Agency, which tracks the Gini coefficient of 139 countries.

“What jumps out,” according to the website report on the data analysis, “is how lousy the United States looks. Our best district in terms of equality (VA-11) is only as good as Portugal, which sits at a pedestrian 71st on the CIA’s list, right in the middle of the pack. That means that the level of equality in every congressional district in America falls below the midpoint of the CIA’s 139-country ranking.”

“Even the best U.S. district has higher inequality than any number of countries you probably don’t associate with economic egalitarianism: Greece, Niger, Ethiopia, Egypt, Pakistan, Kosovo, Mongolia, Ukraine, Bangladesh. The most equal U.S. congressional district can’t compare with the national averages of New Zealand, France, Canada, Netherlands, Australia, Switzerland, Belgium, Germany, and Austria. Most districts in the U.S. (those ranked 39th through 429th) fall in a narrow Gini band between .4 and .499, putting them between Zimbabwe (20th on the CIA list) and the United Kingdom (60th).”

In 2013, a person living alone making less than $11,490 was classified as in poverty. The threshold increased by $4,020 for each additional household member.