
Rich Towns in CT Have 8 Times the Resources of Poor Towns to Pay for Municipal Services, Study Finds
/The most resource-rich towns in Connecticut had, on average, a per capita revenue capacity that was more than eight times the average of the most resource-poor communities’ capacity. That conclusion, highlighted in a study by the Federal Reserve Bank of Boston, which pointed to “large non-school fiscal disparities across cities and towns in Connecticut.”
“These disparities are driven primarily by differences in revenue-raising capacity,” the report, “Measuring Municipal Fiscal Disparities in Connecticut,” concluded. “Because municipalities in Connecticut rely almost exclusively on property taxes for own-source revenue, this is directly tied to the uneven distribution of the property tax base.”
The study, issued in May, “found that municipal costs are driven by five key factors outside the control of local officials: the unemployment rate, population density, private-sector wages, miles of locally maintained roads, and the number of jobs located within a community relative to its resident population.” Fiscal disparities exist when some municipalities face higher costs for providing a given level of public services or fewer taxable resources to finance those services than others, according the report synopsis.
The study explains that “in Connecticut, municipalities provide a range of services including education, public safety, public works, human services, and general government. While educational fiscal disparities—and the effectiveness of the state’s Education Cost Sharing (ECS) grant in addressing them—have received considerable attention in Connecticut, less is known about how municipalities’ underlying characteristics affect their ability to provide other vital public services and the degree to which state policies ameliorate differences.”
The highest-cost group of communities had average per capita municipal costs that were 1.3 times the average per capita costs of the lowest-cost group of cities and towns, the study found, noting that “variation in measured capacity stems from differences in resources, not choices about tax rates. In Connecticut, real and personal property taxes are virtually the only source of revenue that cities and towns are authorized to levy.”
Breaking down the state’s geography, the report indicated that “the highest capacity areas (darkest shades on the map) are located in the southwestern and northwestern corners of the state, and along the shoreline. Connecticut’s lowest-capacity municipalities (the lightest shades on the map) are mostly scattered through the central and eastern portions of the state. In general, communities in northeastern Connecticut also tend to have fairly low per capita revenue capacity.”
The municipal gap data highlighted in the report is described as “the difference between the uncontrollable costs associated with providing public services and the economic resources available to a municipality to pay for those services.” To calculate the per capita “gap” for each community, the study subtracted per capita revenue capacity from per capita cost for each municipality:
- Thus, a “positive gap” indicates a municipality that lacks sufficient revenue-raising capacity to provide a given common level of municipal services, with larger gaps indicating a worse fiscal condition.
- By contrast, a negative gap represents a municipality that has more than enough revenue-raising capacity to provide this common level of municipal services.
The study found “a wide range of municipal gaps among Connecticut’s 169 communities, indicating significant fiscal disparities across the state.” Although cost differences play a role, “these gaps are largely driven by the uneven distribution of revenue capacity across the state. This, in turn, is the direct result of the uneven distribution of the property tax base.”
- The report indicated that “a total of 78 Connecticut municipalities had a positive fiscal gap, meaning there was insufficient revenue raising capacity, representing 46 percent of the state’s communities (and close to 60 percent of the state’s population).
- The state’s remaining 91 communities had a negative fiscal gap (more than sufficient revenue-raising capacity) in the year studied, FY2011.
The state’s cities, with the notable exception of Stamford, tend to have the largest positive gaps, or insufficient capacity to raise funds to provide adequate municipal services. Most communities in northeastern Connecticut also have positive gaps. The largest negative gaps, the report found, —representing communities with high revenue-raising capacity—are generally located in lower Fairfield County, the northwestern corner of the state, and certain communities along the shore in eastern Connecticut.
The report was coordinated for the New England Public Policy Center of the Federal Reserve Bank of Boston by Bo Zhao and Jennifer Weiner and a team of researchers. Bo Zhao is a Senior Economist in the New England Public Policy Center, specializing in public finance and urban and regional economics. Jennifer Weiner is a Senior Policy Analyst with the New England Public Policy Center. Her work focuses on state and local public finance and has included research on state business tax credits, unemployment insurance financing, state debt affordability, transportation funding, and the fiscal systems of the New England states.
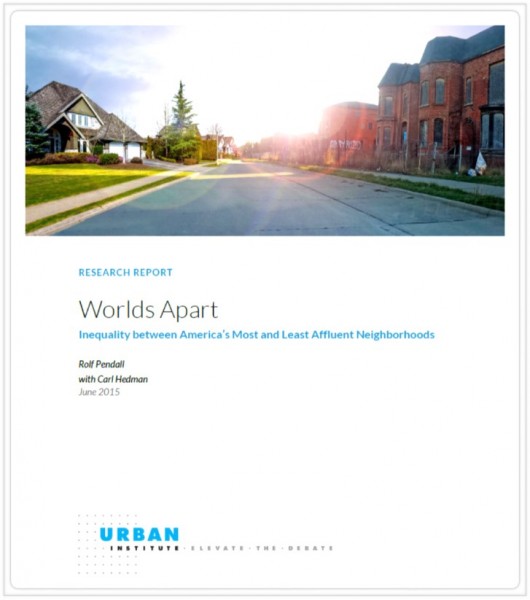 As a result, the study found that inequality between “top and bottom income” neighborhoods intensified in the great majority of commuting zones. Even where inequality dropped, the story was not always positive: it often occurred because top-neighborhood incomes fell in the wake of economic stagnation.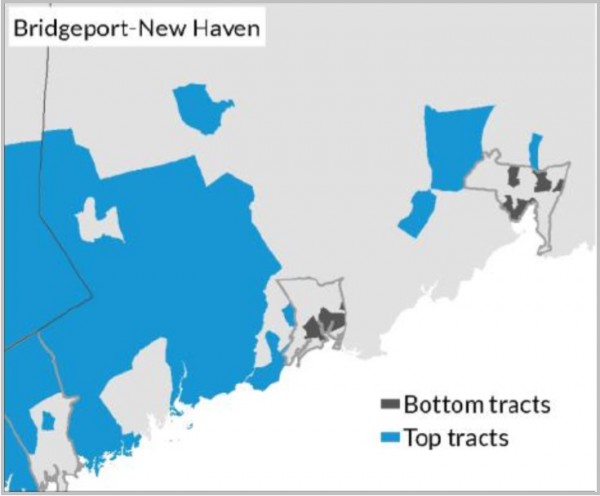

 Overall, the top 5 up-and-coming regions for tech jobs in the U.S. were 1) Austin-Round Rock, TX, 2) Raleigh-Cary, NC, 3) Provo-Orem, UT, and 4) Fort Collins-Loveland, CO. Also reaching the top 10 were 6) Indianapolis-Carmel, IN, 7) Boise City-Nampa, ID, 8) Manchester-Nashua, NH, 9) Nashville-Davidson-Murfreesboro-Franklin, TN and 10) Eugene-Springfield, OR.
 nd online interview tools, all while eliminating bulky and expensive software. Founded in 2010,
  Abstract processing has several effects on consumers, such as increasing their willingness to pay. The presumed source of the effect is that people are accustomed to looking downward to process nearby, concrete information and upward to absorb distant, more-abstract information, the researchers say.
 , “The Floor Is Nearer than the Sky: How Looking Up or Down Affects Construal Level,” is published in the April 2015 edition of the Journal of Consumer Research.
 A year ago, the website

 The
The 


 Fixed route transportation operates along a prescribed route and on a fixed schedule, and includes buses and light rail. In 2014 in Connecticut, buses provided over 43 million passenger trips and rail provided over 39 million passenger trips. Demand-responsive transportation provides routes and scheduling more individually tailored to the needs of the user. The Americans with Disabilities Act (ADA) requires transit agencies to provide paratransit service, subject to certain parameters, to people with disabilities who cannot use the fixed route services. Paratransit ridership in Connecticut in fiscal year 2014 under the ADA totaled over one million rides, and dial-a-ride ridership neared 100,000 rides.
 ommunities are located within a reasonable distance of quality, dependable public transportation.” In addition, policy makers were urged to “identify funding streams to sustain, coordinate, grow and make more convenient both fixed route and demand-responsive transportation options (including providing door-to-door service), and provide technical assistance to support regionalization efforts.”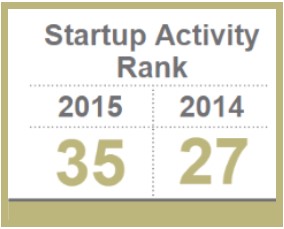
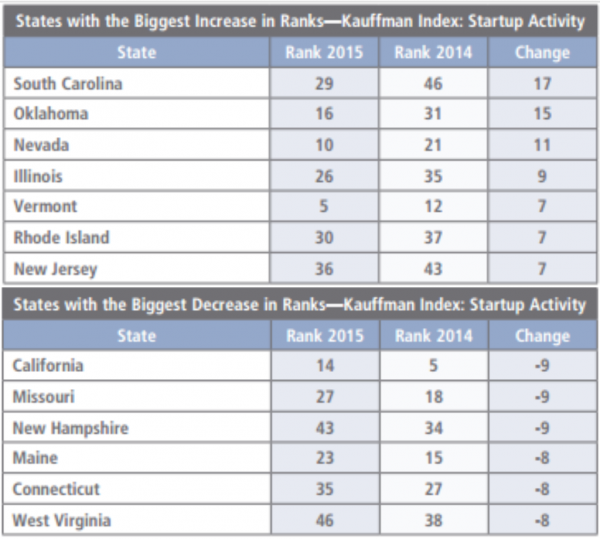 The top ranked states were Montana, Wyoming, North Dakota, Colorado, Vermont, South Dakota, Alaska, Idaho, Florida, Nevada and New York.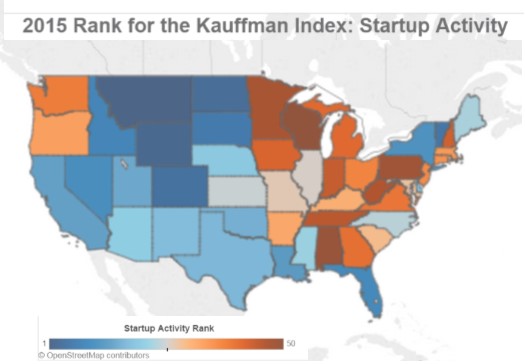
 6.8 million employees in all, more than ever, according to Fortune, whose issue with the 61st annual ranking is out this week.
 One of the two new entries on this year’s list that are headquartered in Connecticut is
 Amphenol World Headquarters
 Idaho recorded the largest percentage increase over the four-month period (+2.2 percent), followed by Utah (+1.8 percent). The other leading job growth states, by percentage, were Washington, Oregon, Michigan, South Carolina, Florida, Nevada, California, North Carolina, Arizona and Vermont. In West Virginia, Louisiana and Maine, average monthly employment declined slightly.
 Much of how state economies are performing is due to the individual sectors making up their employment base, Governing reported, as several industries experienced weak growth to start the year. Nationally, construction and manufacturing employment expanded little over the first four months, and government employment (local, state and federal), similarly remained essentially unchanged since January, the analysis pointed out.
 Iowa Governor Terry Branstad provided opening remarks at Wednesday’s session, followed by Malloy’s keynote address. Branstad, a Republican, and Malloy, a Democrat, were re-elected by voters in their respective states last fall.