English Language Learners May Hold Key to Economic Vibrancy of Region, State

One-third of Hartford’s population is Puerto Rican, making it the 4th highest percentage of Puerto Rican people in the continental United States.  But the rapidly increasing diversity of the state’s Capitol City, and the region that surrounds it, only begins there – as do the linguistic and workforce challenges. A new report produced by The Hartford Foundation for Public Giving Latino Endowment Fund focuses on the issues faced by English Language Learners and highlights the opportunities and the challenges of increased cultural and linguistic diversity.report

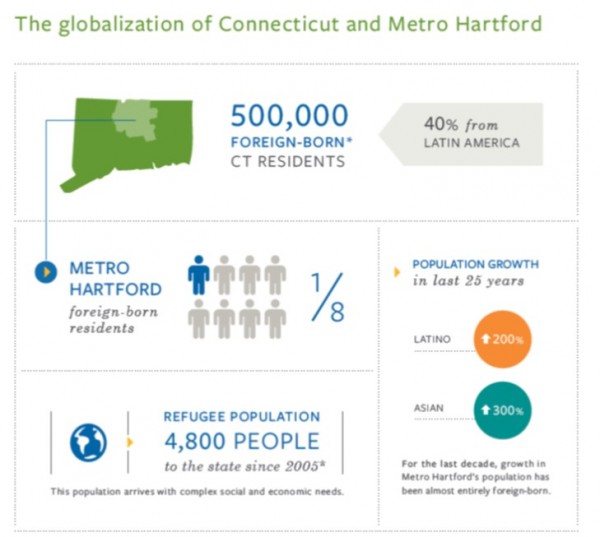
Approximately one-eighth of the Greater Hartford region’s population consists of foreign-born residents, including 4,800 people who have arrived in the state since 2005.  A total of 500,000 foreign-born residents are now living in Connecticut, including 40 percent who hail from Latin American countries.

During the past 25 years, population growth in the Hartford region has been “almost entirely” driven by foreign-born people taking up residence locally, according to the report. In the Hartford region, more than 1 in 5 people speak a language other than English at home.  About three-quarters of Connecticut English Language Learner (ELL) students speak Spanish.

The report found that the region’s “schools and communities are more diverse than ever, with more than 100 different languages spoken in homes throughout Greater Hartford.”  The report raises the question, “How can we harness the assets of a multilingual population to enhance our community and create stronger links to the global marketplace?”HFPG_VertLogo_rgb

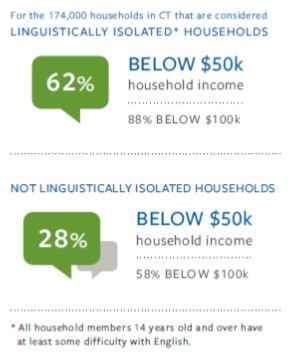
The report notes that “researchers believe that, on average, it takes 2 years to master conversational English, yet 5-7 years to master academic English.”  The report indicated that when analyzing education and workforce data, English Language Learners are far behind their English speaking peers in terms of educational attainment and income.Highlighting one of the challenges for ELL students, the reported found that over the last 4 years, two of the top three teacher shortages in Connecticut have been bilingual and world languages educators.  About 20% of all adult ELLs experienced poverty in the last year, about twice the rate in the state as a whole. In Connecticut, the earned income of ELL adults is $25,000 per year—less than half of English-speakers’ earnings.
population“The Latino Endowment Fund has offered this report as a means to expand the important discussion on efforts to support English Language Learners in our communities,” said Luis Cabán, chair emeritus of the Latino Endowment Fund Steering Committee. “This document provides us with an opportunity to reframe how we think about our increasingly global community and recognize the advantages of people speaking more than one language to enhance the richness of our community and create stronger links to the global marketplace.”

The number of Hispanic entrepreneurs in the United States has more than tripled since 1990 from 577,000 in 1990 to 2,000,000 in 2012, according to the report. Immigrant-owned businesses employ 10% of all American workers and generate 16% of the overall US business income.  Connecticut is home to 14,000 Latino-owned small businesses, which represents a 50 percent growth rate since 2007.

In Connecticut as of 2013, there were over 191,000 working-age adults with limited English proficiency.  This population has grown 32 percent since 20000 and now represents 10 percent of the total working-age population.  Over 58 percent of these are Spanish-speaking, the report indicated. teacher shortage

Some of the potential solutions highlighted in the report are:

  • Eliminating the state requirement that a district must have a minimum of 20 students requiring ELL support before receiving state funding. All districts that teach students who need ELL support should be eligible for state assistance.
  • Expanding dual-language immersion programs to build a more supportive multilingual environment that can cater to both urban and suburban families.
  • Developing an ESL/adult education curriculum for parents that focus on interactions with their children’s schools and teachers.
  • Providing additional support to create a smooth transition from adult education ESL classes to college-level ESL classes through the development of a coordinated curriculum.household income

“While we appreciate the recent actions by the legislature to support ELL students and their families, this report shows that much work needs to be done to assist the thousands of Connecticut children and adults who are not proficient in English,” said Nelly Rojas Schwan, chair of the Latino Endowment Fund and an assistant professor of social work and Latino community practice at the University of Saint Joseph. “The future of our state’s economy will largely be determined by how well we educate and train our English Language Learners and we hope this report will serve as a tool to aid in this discussion.”

Download a copy of the report.

Rich Towns in CT Have 8 Times the Resources of Poor Towns to Pay for Municipal Services, Study Finds

The most resource-rich towns in Connecticut had, on average, a per capita revenue capacity that was more than eight times the average of the most resource-poor communities’ capacity.  That conclusion, highlighted in a study by the Federal Reserve Bank of Boston, which pointed to “large non-school fiscal disparities across cities and towns in Connecticut.” “These disparities are driven primarily by differences in revenue-raising capacity,” the report, “Measuring Municipal Fiscal Disparities in Connecticut,” concluded. “Because municipalities in Connecticut rely almost exclusively on property taxes for own-source revenue, this is directly tied to the uneven distribution of the property tax base.”fed report

The study, issued in May, “found that municipal costs are driven by five key factors outside the control of local officials: the unemployment rate, population density, private-sector wages, miles of locally maintained roads, and the number of jobs located within a community relative to its resident population.”  Fiscal disparities exist when some municipalities face higher costs for providing a given level of public services or fewer taxable resources to finance those services than others, according the report synopsis.

The study explains that “in Connecticut, municipalities provide a range of services including education, public safety, public works, human services, and general government.  While educational fiscal disparities—and the effectiveness of the state’s Education Cost  Sharing (ECS) grant in addressing them—have received considerable attention in Connecticut, less is known about how municipalities’ underlying characteristics affect their ability to provide other vital public services and the degree to which state policies ameliorate differences.”

The highest-cost group of communities had average per capita municipal costs that were 1.3 times the average per capita costs of the lowest-cost group of cities and towns, the study found, noting that “variation in measured capacity stems from differences in resources, not choices about tax rates. In Connecticut, real and personal property taxes are virtually the only source of revenue that cities and towns are authorized to levy.”

Breaking down the state’s geography, the report indicated that “the highest capacity areas (darkest shades on the map) are located in the southwestern and northwestern corners of the state, and along the shoreline. Connecticut’s lowest-capacity municipalities (the lightest shades on the map) are mostly scattered through the central and eastern portions of the state. In general, communities in northeastern Connecticut also tend to have fairly low per capita revenue capacity.”map

The municipal gap data highlighted in the report is described as “the difference between the uncontrollable costs associated with providing public services and the economic resources available to a municipality to pay for those services.”  To calculate the per capita “gap” for each community, the study subtracted per capita revenue capacity from per capita cost for each municipality:

  • Thus, a “positive gap” indicates a municipality that lacks sufficient revenue-raising capacity to provide a given common level of municipal services, with larger gaps indicating a worse fiscal condition.
  • By contrast, a negative gap represents a municipality that has more than enough revenue-raising capacity to provide this common level of municipal services.

The study found “a wide range of municipal gaps among Connecticut’s 169 communities, indicating significant fiscal disparities across the state.” Although cost differences play a role, “these gaps are largely driven by the uneven distribution of revenue capacity across the state. This, in turn, is the direct result of the uneven distribution of the property tax base.”

  • The report indicated that “a total of 78 Connecticut municipalities had a positive fiscal gap, meaning there was insufficient revenue raising capacity, representing 46 percent of the state’s communities (and close to 60 percent of the state’s population).
  • The state’s remaining 91 communities had a negative fiscal gap (more than sufficient revenue-raising capacity) in the year studied, FY2011.

The state’s cities, with the notable exception of Stamford, tend to have the largest positive gaps, or insufficient capacity to raise funds to provide adequate municipal services. Most communities in northeastern Connecticut also have positive gaps. The largest negative gaps, the report found, —representing communities with high revenue-raising capacity—are generally located in lower Fairfield County, the northwestern corner of the state, and certain communities along the shore in eastern Connecticut.

The report was coordinated for the New England Public Policy Center of the Federal Reserve Bank of Boston by Bo Zhao and Jennifer Weiner and a team of researchers.  Bo Zhao is a Senior Economist in the New England Public Policy Center, specializing in public finance and urban and regional economics.   Jennifer Weiner is a Senior Policy Analyst with the New England Public Policy Center. Her work focuses on state and local public finance and has included research on state business tax credits, unemployment insurance financing, state debt affordability, transportation funding, and the fiscal systems of the New England states.


Income Inequality Around Bridgeport Has Grown, Among Nation’s Largest Gaps, Research Shows

Commuting zones surrounding Bridgeport are among the commuting regions in the United States where neighborhood income inequality has grown notably most severe over the past 20 years, according to a new analysis developed by the Urban Institute and published in Governing magazine. From 1990 to 2010, inequality in the United States increased in many ways, the report explains, highlighting that the income, wealth, and educational attainment of residents in the most privileged neighborhoods in the U.S. escalated rapidly over these two decades. Meanwhile, “residents of the most disadvantaged neighborhoods gained little; many of these neighborhoods grew poorer,” the report indicated.

WOrlds ApartAs a result, the study found that inequality between “top and bottom income” neighborhoods intensified in the great majority of commuting zones. Even where inequality dropped, the story was not always positive: it often occurred because top-neighborhood incomes fell in the wake of economic stagnation.
The research report, “World Apart:  Inequality between America’s Most and Least Affluent Neighborhoods,” found that “the national trend toward rising incomes among top-earning households” was reflected in the nation’s top tracts show growth from $123,000 to $138,300, over 12 percent” during the period 1990-2010.  Some top neighborhoods, including those surrounding Bridgeport, “had increases of over $30,000 at the top.”

Annual income in bottom tracts, meanwhile, grew from $36,800 to $37,150 – less than 1 percent over the twenty year period.  The average income of bottom tracts declined in 209 of the 570 commuting zones studied, the report indicated.  The most severe losses at the bottom among large commuting zones, the report found, occurred in Bridgeport, Newark and Dallas. Bridgeport is one of the ten cities with the largest “neighborhood inequality index.”

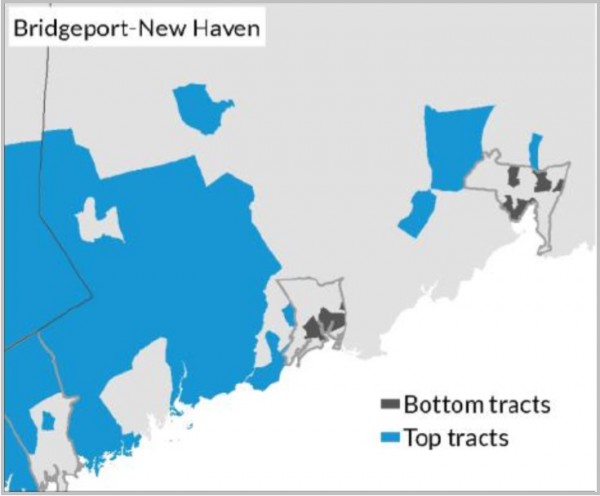
The report flatly stated that “Bridgeport, which includes the entirety of Connecticut, already was one of the most unequal commuting zones in 1990.  Its top and bottom neighborhoods pulled further apart in income between 1990 and 2010; practically all its top neighborhoods are still in the suburbs and practically all its bottom neighborhoods are in central cities.”bgpt NH

The only cities with commuting zones of over 250,000 people with a higher “neighborhood inequality index” than Bridgeport, as of 2010, are Austin, Baltimore, Birmingham, Columbus, Houston, Nashville, Richmond, and St. Louis.

As a result of changes at the top and bottom, the report noted, income inequality between top and bottom tracts grew from 1990 to 2010 in 433 of the 570 commuting zones. In 237 CZs, income inequality grew because of rapid increases at the top coupled with modest increases at the bottom.

To understand the differences between neighborhoods that share the same housing and labor markets, the Urban Institute analysis used commuting zones (CZs), county-based regions defined in the 1990s. Unlike metropolitan areas, commuting zones cover the entirety of the United States, and their definitions are constant over time.

The study ranked every CZ’s tracts from lowest to highest neighborhood advantage score. Then they identified the top 10 percent and the bottom 10 percent of tracts—the most advantaged and least advantaged neighborhoods in each CZ—for further exploration. There are described as top and bottom tracts. The study analyzed the 570 CZs that had at least 10 census tracts in 2010.

The nonprofit Urban Institute is dedicated to elevating the debate on social and economic policy. The organization’s website explains that “For nearly five decades, urban scholars have conducted research and offered evidence-based solutions that improve lives and strengthen communities across a rapidly urbanizing world. Their objective research helps expand opportunities for all, reduce hardship among the most vulnerable, and strengthen the effectiveness of the public sector.”

Hartford Area Ranked #5 Up-and-Coming City for Tech Jobs

As tech grows to increasingly  impact almost every aspect of our lives, it’s not surprising that the industry is moving beyond its traditional home of Silicon Valley and taking root in regions across the nation.  Where that growth is happening is the subject of continual scrutiny and intense interest.  Now, a new analysis indicates that among the leading up-and-coming regions for tech jobs is Connecticut's Capitol Region of Hartford-East Hartford-West Hartford, which placed fifth in a review of tech jobs by ZipRecruiter. By analyzing the hiring trends nationwide, the company has compiled a list of the Top 10 Up-and-Coming Cities for Tech Jobs.  Greater Hartford was one of two regions in New England to make the top 10 list; the other is Manchester, New Hampshire, three slots behind Hartford.  They were the only Northeast cities to earn a position on the list.region

According to the company’s website, “although it once suffered the same decline characterizing many Rust Belt cities, Hartford has diversified into the insurance, healthcare, and tech industries and exhibited positive growth as of our latest jobs report.” While noting that “the city is home to headquarters for United Technologies,” ZipRecuiter also indicated that the region “continues to attract new companies with its population of entry level job seekers from local universities and excellent quality of life.”  UTC recently announced it would be moving its headquarters from Hartford to Farmington, CT, just one town west of West Hartford.

Top 5 technology jobs, according to the analysis, in the Hartford-West Hartford-East Hartford region are:

  • Applications Engineer
  • Systems Analyst
  • Infrastructure Engineer
  • Java Developer
  • Data Architect

Top-Tech-Jobs-Overall, the top 5 up-and-coming regions for tech jobs in the U.S. were 1) Austin-Round Rock, TX, 2) Raleigh-Cary, NC, 3) Provo-Orem, UT, and 4) Fort Collins-Loveland, CO.  Also reaching the top 10 were 6) Indianapolis-Carmel, IN, 7) Boise City-Nampa, ID, 8) Manchester-Nashua, NH, 9) Nashville-Davidson-Murfreesboro-Franklin, TN and 10) Eugene-Springfield, OR.

ZipRecruiter allows small businesses, individual employers and recruiters to easily reach the right candidates and make the best hiring decisions with single-click postings to 100+ leading job networks azipnd online interview tools, all while eliminating bulky and expensive software. Founded in 2010, ZipRecruiter is a privately held company based in Santa Monica, California.
 

Different Shelf Positions Prompt Different Types of Thinking, Buying by Consumers

If you ever wondered why store shelves are stocked as they are, or whether the location of various items impacts which ones make it into your shopping cart, new academic research is providing some answers. It turns out that looking up and looking down to survey store shelves can influence your purchasing decisions. When people have to look downward to see a product, their thinking becomes more concrete; when they have to look upward, it becomes more abstract, according to a research team led by Anneleen van Kerckhove, a researcher at Ghent University in Belgium.

JCR new coverAbstract processing has several effects on consumers, such as increasing their willingness to pay. The presumed source of the effect is that people are accustomed to looking downward to process nearby, concrete information and upward to absorb distant, more-abstract information, the researchers say.

Knowing how looking up or down impacts consumers can help businesses manage product displays. A product placed on a low shelf in a store may be evaluated in terms of specific features, cost, or the likelihood that the product will deliver on its promises. On the other hand, a product placed on a high shelf is more likely to be evaluated in terms of the general purpose it serves.

The research020, “The Floor Is Nearer than the Sky: How Looking Up or Down Affects Construal Level,” is published in the April 2015 edition of the Journal of Consumer Research.

“Consumers pay attention to different aspects of products depending on whether they are looking down or up when choosing between available products. People are used to paying detailed attention when looking down because everything that happens close to them could be important or dangerous. However, people are more likely to think about the big picture when looking up because they are used to looking at things from more of a distance (to get the full picture),” the researchers, Anneleen Van Kerckhove, Maggie Geuens, and Iris Vermeir, conclude.

Ghent University is one of the major Belgian universities with over 41,000 students and 9,000 employees.  It was founded in1817, current faculty conduct in-depth research in both exact and social sciences.

stocked shelvesA year ago, the website BizShifts-Trends pointed out that “Some of the hottest real estate in the country these days is on retail store shelves. Shelf space allocation is a serious issue in retail business. It’s an important tool for attracting customers’ attention, but getting a product on the shelf is no guarantee that it will sell.”   The website also noted that “most vendors are willing to pay significant premiums to obtain preferred retail locations on both a promotional and everyday basis.”

In addition, the website Real Results magazine reports that “Paired with growing private-label popularity, manufacturers are realizing that they must quickly differentiate themselves from their closest competitors by becoming more consumer centric at the shelf level.”

Now research suggests that the difference between looking up and looking down can also impact the chance of products moving off the shelf and into the grocery cart.

Pratt & Whitney’s Caitlin Oswald Among Most Creative in U.S. Business for Propelling Jet Innovation

Pratt & Whitney additive manufacturing project manager Caitlin Oswald is one of the “100 Most Creative People in Business for 2015,” in a list compiled by Fast Company magazine featuring business and industry leaders well known – and some relatively obscure - from across the globe. The elite international list of scientists, fashion designers, app developers, architects and others from Nike, Evernote, IBM and Pepsico  and other well-known organizations are among those that Fast Company, the oft-cited media voice for innovation in business, keeps an eye on for the latest in technology and business models that have the potential to change the world.caitlin oswald photo

Oswald was recognized for her work in additive manufacturing, or "3D printing," especially as it has been applied to Pratt & Whitney's PurePower® Geared Turbofan™ (GTF) engine platform. She is credited with leading a team that incorporated additive manufacturing, specifically electron beam melting, through the development process and helping engineers approach challenges in a new way, according to the publication.sidebar-mcp-2015

As Fast Company explained Oswald’s business leadership:  “When a new fleet of Airbus regional jets take off later this year, they will feature something new under their wings: geared turbofan engines. Possibly the most sustainable jet engine ever built, the GTF will use 16 percent less fuel and significantly reduce CO2 emissions—a breakthrough that was only possible via advances in 3-D–printing technology.”

The publication indicated that “Caitlin Oswald led the team that incorporated 3-D printing into the design process, looking at each part of a jet engine to determine if it could be better developed with the new technique. As a result, engineers were able to approach challenges in a completely different way.”

"They’re able to print a part to scale and hold it in their hand," Oswald told Fast Company. "They can really understand what it looks like and what the capabilities and limitations are."

Added Oswald, a Design and Applied Technology Manager at Pratt & Whitney:  “This concept of additive manufacturing is this big, scary concept out there. Some people can take it and they look at it like it's the best thing since sliced bread and they're going to use it everywhere and let's forge ahead. Then there's the other side who thinks it's too risky; it's just a fad that's never going to gain any ground. My job is in this sweet spot where I'm able to take this big, scary concept and break it out into many bite-sized chunks.”

Pratt_&_WhitneyThe Fast Company top 10 include:  Charles Arntzen of Arizona State University’s Center for Infectious Diseases and Vaccinology; Rajan Anandan, Google’s Vice President and Managing Director for India and Southest Asia; Dao Nguyen, publisher of Buzzfeed; Maria Claudia Lacouture, president of ProColombia; Jens Bergensten, lead creative designer for Minecraft; and Leslie Dewan, CEO of Transatomic Power.

Oswald ranked #30 on the list, between Barbara Bush and Tracy Young.  Bush, the daughter of former President George W. Bush, is co-founder and CEO of Global Health Corps.  Young is co-founder of PlanGrid, which developed a software product allows a large team to share a master set of blueprints, so that each team member can add their own markings and see their changes reflected in real time.FCLA

The magazine’s awards were presented to the Most Creative People in Business recipients at a Fast Company conference in Los Angeles recently. Said Oswald of the experience: “What I really enjoyed was learning about how people use their passion for creativity to drive their goals."

Read the Fast Company profile of Caitlin Oswald


Transportation Seen As Key for Growing Senior Population in CT

Connecticut is the 7th oldest state in the nation with the 3rd longest-lived average life expectancy, at 80.8 years.  Transportation is “the vital link,” according to a new report, “that connects residents across the lifespan with their communities and the elements of a vibrant and engaged life.”  By 2025, at least 20 percent of the population in every Connecticut town (except Mansfield and New Haven) will be age 65 or older, according to projections. As the state considers a range of transportation options – all carrying considerable price-tags – the impact of various alternatives on the state’s fast-growing senior population was the focus of a statewide survey and report led by the Connecticut’s Legislative Commission on Aging.47 8

The Commission’s Transportation Policy Brief, issued last month, was prepared in partnership with the Connecticut Chapter of the American Planning Association and the Capitol Region Council of Governments. Among the key findings:

  • Connecticut’s older adults are currently more likely than any other age group to rely on their cars as their primary form of transportation. Currently, 82% of all Connecticut adults use their cars as their primary form of transportation, versus 92% of adults age 50 and older.
  • However, Connecticut residents want to become less car-dependent. Compared to today (82%), 10% fewer Connecticut adults (72%) plan to use their cars as their primary form of transportation in the future. Moreover, 47% of Connecticut adults reported currently living in a suburb where most people drive to most places, but only 8% of Connecticut adults want to live there in the future.bike

The report calls for the state and municipalities to create environments that promote equity, environmental sustainability and support healthier lifestyles for everyone; retrofitting car-dominated infrastructure for the safety of all users; rebuilding the street as a public space for social experience; supporting economic activity, and sustaining, coordinating and growing both fixed route and demand-responsive transportation options.

Connecticut residents, especially older residents, are looking for transportation alternatives, according to the online survey conducted for the Commission this year by the Harris Poll:

  • Connecticut residents intend to use public transit more in the future, especially older adults. Among adults 66 years of age and older, more (12 percentage point increase) plan to use the bus as their primary form of transportation in the future (14%), compared to today (2%).
  • More Connecticut residents plan to bike in the future, with the highest increases for the 50-65-year-old age group (13 percentage point increase) and 66 years and older age group (9 percentage point increase).
  • Creating a more walkable infrastructure is a top priority for Connecticut residents, second only to maintaining existing transportation systems (41%). Among new public investments, the strongest demand by Connecticut residents is for new sidewalks and pedestrians crossings (38%).

The survey also found that as economic uncertainty continues, 43% of Connecticut adults identified keeping transportation costs low to be a high priority.  The survey found that 28% of Connecticut adults said the quality of life, including community transportation features, was the single most important factor in choosing where to live, ranking higher than friends and family living there (17%) or job prospects (11%).

“The Commission recognizes that continued strategic investments, as well as critical policy expansions and transformations, are necessary to shape a transportation system that values community and much as it values mobility” said Julia Evans Starr, Executive Director of the Commission.

coupleFixed route transportation operates along a prescribed route and on a fixed schedule, and includes buses and light rail. In 2014 in Connecticut, buses provided over 43 million passenger trips and rail provided over 39 million passenger trips.  Demand-responsive transportation provides routes and scheduling more individually tailored to the needs of the user. The Americans with Disabilities Act (ADA) requires transit agencies to provide paratransit service, subject to certain parameters, to people with disabilities who cannot use the fixed route services. Paratransit ridership in Connecticut in fiscal year 2014 under the ADA totaled over one million rides, and dial-a-ride ridership neared 100,000 rides.

Among the report’s 12 recommendations were a call to “incentivize and enhance funding for municipalities to engage in transit-oriented development in conducive locations to ensure that compact, walkable, mixed-used, mixed-income cCommission on Agingommunities are located within a reasonable distance of quality, dependable public transportation.” In addition, policy makers were urged to “identify funding streams to sustain, coordinate, grow and make more convenient both fixed route and demand-responsive transportation options (including providing door-to-door service), and provide technical assistance to support regionalization efforts.”
The report also advocated efforts that would “enhance collaboration with non-transportation partners, including those in housing, health care, public health, planning and zoning, social services, law enforcement, and the business community, among others.”  Improved data collection regarding key risk factors in road traffic injuries, and research into self-driving vehicles were also recommended.

Between 2010 and 2040, Connecticut’s population of people age 65 and older is projected to grow by 57 percent, but its population of people age 20 to 64 is projected to grow by less than 2 percent.

For more information and to read the full report visit the Legislative Commission on Aging website at www.cga.ct.gov.coa


CT Drops in State Rankings of Startup Business Activity, Now 35th in US

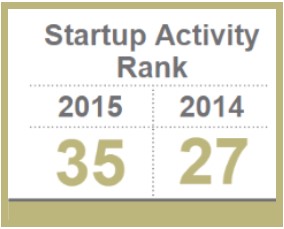
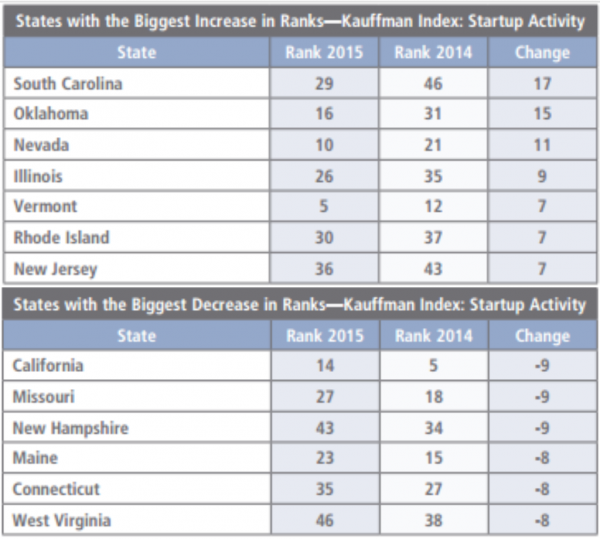
Connecticut dropped from number 27 a year ago to number 35 in the nation in business start-up activity, according to annual rankings developed by the Kauffman Foundation.  The drop of 8 positions was among the six worst among the 50 states, the analysis indicated.  Only New Hampshire, Missouri and California plummeted further, each dropping nine positions in the annual rankings. Nationally, the U.S. economy reversed a five-year downward trend in startup activity last year with a big jump in the number of new entrepreneurs - the largest year-over-year growth in two decades, according to the analysis.  New business creation increased in 32 states.  Connecticut was not among them.rank

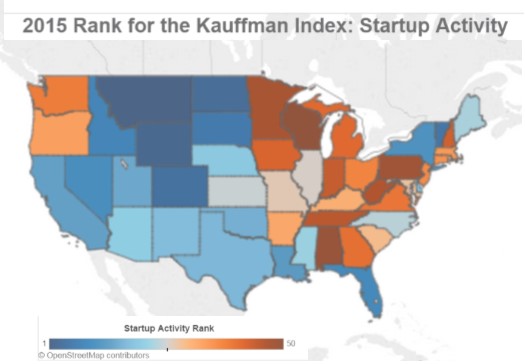
The largest leaps forward came in South Carolina, jumping from 46th to 29th, Oklahoma, from 31st to 16th and Nevada, from 21st to 10th in the 2015 rankings, based on 2014 data.  Three components were used to make up the rankings:  the rate of new entrepreneurs, the opportunity share of new entrepreneurs and startup density.

states_insertThe top ranked states were Montana, Wyoming, North Dakota, Colorado, Vermont, South Dakota, Alaska, Idaho, Florida, Nevada and New York.
Connecticut dropped in two of the three key measures of startup activity used by Kaufman in the analysis.  The “Opportunity Share of New Entrepreneurs” fell from 76.9% to 74.9%.  The stat is described as “the percent of new entrepreneurs starting businesses because they saw market opportunities.”  The “Rate of New Entrepreneurs” fell from .31% to .29%.  That measure is the percent of the adult population that became entrepreneurs in a given month.

The final measure in the Kauffman formula, Startup Density, saw a slight uptick for Connecticut.  The stat consists of the number of startup firms per 100,000 residents, defined as firms less than one year old employing at least one person besides the owner.  Connecticut moved from 105.3 in the previous year to 110.4.USA map

For the past 10 years, the Kauffman Index has been "a trusted, early indicator for entrepreneurship in the United States," used by entrepreneurs and policy makers, from the federal to state and local levels.

17 CT Companies Reach Fortune 500, From #8 GE (Fairfield) to #487 Amphenol (Wallingford)

Connecticut has a total of 17 companies headquartered in the state that are now ranked on the Fortune 500, as the latest annual business list is published by Fortune magazine this week.  That includes one company, General Electric, in the top 10, a total of seven companies in the top 250, and two that reached the Fortune 500 list this year. The nation's largest companies ranked in the newly updated Fortune 500 list earned combined total annual revenue of $12.5 trillion last year — an all-time high that's up 2.6 percent from the year before.  Total market value of firms that made the 2015 list reached $17.4 trillion as of March 31, also an all-time high that's up 7.7 percent from the previous year, the publication announced.  This year's list of U.S. companies ranked by their 2014 revenue also employ 2fortune500logo6.8 million employees in all, more than ever, according to Fortune, whose issue with the 61st annual ranking is out this week.

The top 10:  Walmart, ExxonMobil; Chevron; Berkshire Hathaway; Apple; General Motors; Phillips 66; General Electric; Ford Motor and CVS Health.  CVS Health made the top 10 for the first time.  There were 19 companies that made their debut on the 2015 list of the nation’s top 500 companies, including Netflix, Salesforce.com, Expedia and News Corp., as 26 firms dropped out of the updated ranking.  Facebook, in its third year on the list, jumped into the top 250, at number 242, up from number 341 a year ago.

The 7 companies headquartered in Connecticut that rank among the 250 top businesses on the list:

  • 8. General Electric of Fairfield (up from 9 last year)
  • 45. United Technologies of Hartford (same as last year)
  • 49. Aetna of Hartford (up from 57)
  • 90. Cigna of Bloomfield (up from 97)
  • 143. Xerox of Norwalk, down from 137.
  • 160. The Hartford Financial Services Group of Hartford (down from 113)
  • 249. Praxair of Danbury (down from 233)

The 8 Connecticut-headquartered companies that remained in the Fortune 500, and 2 companies that earned a slot for the first time:

  • 261. Stanley Black & Decker of New Britain (down from 255)
  • 317. Charter Communications of Stamford (up from 331)
  • 339. Priceline Group of Norwalk (up from 383)
  • 377. Terex of Westport (down from 358)
  • 385. W.R. Berkley of Greenwich (up from 409)
  • 421. EMCOR Group of Norwalk (down from 407)
  • 442. Starwood Hotels & Resorts of Stamford (down from 424)
  • 461. United Rentals of Stamford (up from 500)
  • 486. Harman International Industries of Stamford (up from 576)
  • 487. Amphenol of Wallingford (up from 533)

harmanLogoOne of the two new entries on this year’s list that are headquartered in Connecticut is Harman International Industries, based in Stamford, the parent company behind an array of world-renowned audio brands including AKG®, Harman Kardon®, JBL®, Mark Levinson®, Lexicon®, and Infinity®.  Well established for six decades, since it was launched by audio pioneer Sid Harmon, the company’s founder, the current Chairman, President and CEO is Dinesh Paliwal. states

Amphenol-Corporation-logoAmphenol World Headquarters is in Wallingford, and a number of the international company’s divisions are also based in Connecticut: Amphenol Nexus Technologies Division is in Stamford, Amphenol Times Microwave and Times Fiber Communications in Wallingford, Spectra Strip in Hamden and Amphenol RF in Danbury.  Amphenol, founded in 1932, is one of the largest manufacturers of interconnect products in the world. The Company designs, manufactures and markets electrical, electronic and fiber optic connectors, coaxial and flat-ribbon cable, and interconnect systems.  The primary end markets for the company's products are communications and information processing markets, including cable television, cellular telephone and data communication and information processing systems; aerospace and military electronics; and automotive, rail and other transportation and industrial applications. (see company video)

Fortune 500 companies had revenues last year that equaled 71.9 percent of U.S. GDP—up from 58.4 percent two decades ago, and 35 percent in 1955, according to Fortune. “To be sure, much of that revenue comes from overseas operations. But these companies are still the guts of the U.S., and the global, economy,” the publication points out.greatest challenge

As part of the magazine’s research for the list, they sent a survey to all the Fortune 500 CEOs. One question asked: What is your company’s greatest challenge? “The rapid pace of technological change” topped the list, besting “cybersecurity” (a close second), as well as other traditionally popular responses, such as “increased regulation,” “shareholder activism,” and a “shortage of skilled labor.” Interestingly, 94 percent of those who responded said their companies would change more in the next five years than in the past five, Fortune reported.

New York is the state with the most companies on the list with 55, followed by Texas with 54 and California with 53.  There are 33 companies headquartered in Illinois, 23 in Ohio, 20 in Georgia, 19 in New Jersey and Virginia, 18 in Pennsylvania, 16 in Florida, and 10 in Wisconsin.

Walmart takes the top spot for the third year in a row and the eleventh time ever.Only three companies have held the number 1 spot on the Fortune 500 since its creation in 1955: General Motors, Exxon Mobil and Walmart, according to published reports.


CT Ranks #15 in USA in Job Growth This Year

Connecticut’s job growth during the first four months of the year ranked fifteenth among the states, according to data compiled by Governing magazine.  Connecticut average employment between January 1 and April 30, 2015 increased by eight-tenths of one percent from the previous four-month period.  Average employment was 1,685,375, an increase of 13,500 from the four months ending 2014.jobs Idaho recorded the largest percentage increase over the four-month period (+2.2 percent), followed by Utah (+1.8 percent). The other leading job growth states, by percentage, were Washington, Oregon, Michigan, South Carolina, Florida, Nevada, California, North Carolina, Arizona and Vermont.  In West Virginia, Louisiana and Maine, average monthly employment declined slightly.

job growthMuch of how state economies are performing is due to the individual sectors making up their employment base, Governing reported, as several industries experienced weak growth to start the year. Nationally, construction and manufacturing employment expanded little over the first four months, and government employment (local, state and federal), similarly remained essentially unchanged since January, the analysis pointed out.

Nationally, total state and local government employment peaked during the early stages of the recession in the summer of 2008, reaching about 19.8 million jobs. The U.S. Labor Department's most recent estimates indicate the sector remains about 630,000 jobs below this level.  By sector nationally, construction jobs led the way, with government jobs the slowest growing sector.

In April in Connecticut, according to the state Department of Labor (DOL), the private sector lost 300 (-0.02%) positions, although Connecticut private sector firms have increased employment by 21,300 (1.49%) jobs from a year ago, according to state data.  Four of the ten major industry supersectors added jobs in April and just three declined, according to DOL. Financial Activities, Other Services, and Information came in unchanged. Government(1,500, 0.6%) led all industry supersectors in April, with local government (1,400, 0.9%) entities providing the majority of the increase. Manufacturing (1,400, 0.9%) also posted a good-sized monthly increase in April with the durable goods components (1,200, 1.0%) being the strongest performer. The combined Construction and Mining (1,300, 2.4%) supersector experienced healthy April gains as well in a potentially good sign for the home building sector, the DOL analysis pointed out. Education and Health Services (200, 0.1%) showed a small gain, primarily driven by private educational services (400, 0.6%).dol_v4_header_01

In a year-by-year comparison for the month of April, Connecticut (nonfarm) jobs have grown by a seasonally adjusted 9,100 in 2015, which compares to 11,000 in the first four months of 2014, 7,000 for the same timeframe in 2013, 5,000 for 2012, and 10,500 for 2011, according to DOL data.