Increased Municipal Burden, Disproportionate Impact on Low-Income Drivers Among Possible Effects of Highway Tolls, Report Finds

If Connecticut opts to introduce a system of tolls on the state’s roads to help fund a significant expansion of transportation infrastructure projects in the years ahead, the toll system instituted could run the risk of causing an increased use of local roadways that “could shift the burden of maintenance and congestion to municipalities,” and lower income residents in the state could be faced with “a higher burden relative to their incomes than wealthier Connecticut residents.” Those warnings to policy makers are included in an Issue Brief  by Inform CT that reviews the various tolling options and respective challenges posed.  Connecticut eliminated tolls more than 30 years ago in the aftermath of a horrific accident at the Stratford toll plaza, and state leaders have been in a “perpetual debate about whether to reinstate them ever since,” the paper points out.issue brief
With overhauling the state’s transportation system is a leading element in Governor Malloy’s agenda to boost the state’s economy, renewed attention is being paid to methods of generating sufficient revenue to support those initiatives, and to issues raised in the 2015 policy brief.  Spurred by advances in technology, the possibility of imposing a system of electronic tolls, such as those in use in other states, are among the considerations, with border tolling, distance tolling and congestion pricing among the options.

920x920The issue brief indicated that a disadvantage of a distance toll system on all limited access highways in Connecticut would be that it “could create an incentive for people to use alternative roadways. The increased use of these roadways could shift the burden of maintenance and congestion to municipalities.” The advantage would be that distance tolls “could help to more efficiently allocate the cost of these roadways to drivers who use them the most.”

In analyzing the potential impact of tolls placed at Connecticut’s borders, the policy paper notes that while such an approach would “help to ensure that out-of-state residents driving through Connecticut pay for their use of Connecticut’s roadways,” border tolls “place a disproportionate burden on residents of Connecticut who commute out-of-state to work. This burden is further amplified if we believe that, on average, these out-of-state commuters use a smaller share of the roadways than their in-state commuting counterparts.”
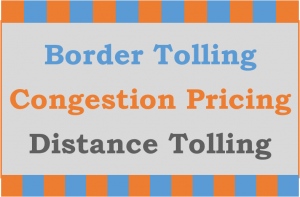
toll optionsCongestion pricing, which provides for higher toll charges at peak traffic times, “helps to limit traffic on major roadways and create an incentive for people to use more environmentally friendly forms of public transportation,” the policy paper indicates.  However, a congestion pricing system “could polarize roadway use by displacing low income commuters during peak driving hours. Congestion pricing could also create displacement effects whereby the increased use of local roadways could shift the burden of maintenance and congestion to municipalities.”Print

The report suggests that “congestion pricing and distance tolls could become more affordable for low income residents if electronic payment systems were implemented that allow for income-based rate reductions.”

Earlier this year, a study panel recommended installing tolls and raising taxes in order to pay for Malloy's 30-year, $100 billion transportation program.  Legislators have said that any decision on the imposition of tolls is at least a year away, as attention focuses during the current session on establishing a method to assure that money allocated to transportation is not redirected to other areas of government.

The issue brief also stress that “a key consideration when trying to outweigh the benefits and costs of implementing tolling in Connecticut is how the revenue from the tax will be redistributed to the residents of the state.” It goes on to highlight that “as the bill stands, the monies raised would go into the Special Transportation Fund but allocation of the monies from there is not specified. The allocation of these funds is an important discussion that needs to take place before the impact of the legislation can be considered in earnest.”

InformCT is a public-private partnership that currently includes staff from the Connecticut Economic Resource Center and the Connecticut Data Collaborative. The mission of InformCT is to provide independent, non-partisan research, analysis, and public outreach focused on issues in Connecticut, and to act as the convener for fact-based dialogue and action.

Unemployment Drops in Waterbury, Norwich/New London Lead CT; Unemployment Lowest in Danbury

The unemployment rate in greater Waterbury and the Norwich-New London saw a larger decrease during the past year than Connecticut’s other large metropolitan areas, and the state’s lowest unemployment rate can be found in Danbury, according to new data released by the U.S. Bureau of Labor Statistics. Danbury was the only one of the state’s six largest metro region to crack the top 200 for lowest unemployment rate, earning a spot at number 168. The year-over-year unemployment data shows that unemployment rates were lower in January 2016 than a year earlier in 333 of 387 metropolitan areas in the U.S., higher in 43 areas, and unchanged in 11 areas. In Connecticut, the six major metropolitan areas all saw a decline in the unemployment rate.chart

Nationwide, the unemployment rate dropped eight-tenths of a point, from 6.1 percent in January 2015 to 5.3 percent in January 2016.  Only one Connecticut region – Danbury – had a lower unemployment rate, at 5.1 percent.  Generally in Connecticcut, the larger the unemployment rate in January 2015, the larger the drop over the following year.

The one percent drop in unemployment in Waterbury and Norwich-New London-Westerly ranked each region tied for 124th for the largest drop in the nation.  Also reaching the top 200 for the largest reduction in unemployment was the Hartford-West Hartford-East Hartford area, ranking 197th with a drop of 0.7 percent, from 6.7 percent to 6.0 percent.

Even with the drop in unemployment, Waterbury’s jobless rate is the highest among the state’s major urban areas, at 7.4 percent. Bureau-of-Labor-Statistics

In this year’s rankings, Waterbury was number 342 with an unemployment rate of 7.4 percent. Norwich-New London-Westerly was at number 295 with an unemployment rate of 6.4 percent.  New Haven and Hartford-West Hartford-West Hartford were tied at number 263 with an unemployment rate of 6.0 percent, and Bridgeport-Stamford-Norwalk at number 235 with an unemployment rate of 5.8 percent, down from 6.3 percent a year ago.

Ames, Iowa, and Boulder, Colo., had the lowest unemployment rates in January, 2.5 percent each. El Centro, Calif., had the highest unemployment rate, 19.2 percent. A total of 187 areas had January jobless rates below the U.S. rate of 5.3 percent, 184 areas had rates above it, and 16 areas had rates equal to that of the nation.

Raising Revenue Getting Tougher for Towns, Cities in Connecticut; Property Tax Drives Disparities

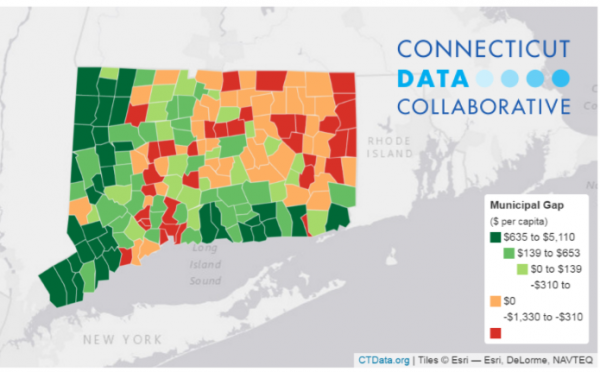
The Connecticut Data Collaborative has launched a series of reports that will examine the fiscal situation of Connecticut’s 169 municipalities making the data compiled in several recent statewide initiatives that examined fiscal challenges facing the state and its towns more readily accessible to the public. The goal is to “highlight the major findings from these initiatives and reports; expand on the research that was done; present it through a new medium; and inform a broader audience on the work being done in the state.”

The first data story, published this month, highlights the findings from a report to the General Assembly’s Program Review and Investigations Committee prepared by the Federal Reserve Bank of Boston’s New England Public Policy Center (NEPPC), “Measuring Municipal Fiscal Disparities in Connecticut.”map

The conclusion: the capacity to raise revenue from property taxes is the main driver of fiscal disparities in Connecticut.

  • 78 of 169 towns have a deficit, with revenue capacity below the cost of providing services. These 78 towns represent almost 60 percent of state’s population.
  • 91 of 169 towns have sufficient capacity to raise revenue capacity to cover the cost of services.
  • Municipal cost differences exist but are not as dramatic as the differences in the ability to raise revenue
  • Current state non-school grants made to towns have a limited effect in reducing non-school fiscal disparities in Connecticut.
  • Five cost factors were identified as driving non-school municipal costs: unemployment, population density, private sector wages, town road maintenance, and jobs per capita.
  • Statistical analysis shows that the following factors do not impact costs: poverty, population, the share of foreign-born population, and the share of older rental housing units

The website points out that “a municipal gap exists when the costs are higher than the revenue raising capacity,” and provides an interactive town-by-town listing of the “gaps.”  The highlighted findings:

  • The largest gaps are in Hartford (-$1,330), Bridgeport (-$1,168), New Haven (-$1,101), New Britain (-$1,056) and New London (-$896). The largest surpluses are in Westport, New Canaan, Darien, and Greenwich.  The data is FY 2007-2011, averaged.
  • 78 towns in the state have a deficit - the capacity is below the cost of providing services. These towns cover almost 60 percent of state’s population.
  • 91 towns have sufficient capacity to raise revenue greater than the cost of services. These towns cover 40 percent of the state’s population, primarily in Fairfield County, Litchfield and the shoreline.

Since property taxes are the primary way that municipalities raise revenue, the website examined the trends in the Equalized Net Grand List (ENGL) since 2011.  Overall, property tax revenue has been on the decline, the data indicated. An interactive table on the site shows - by town- the average annual growth rate (or decline) in the grand list from 2011 to 2014, and also shows the Municipal Gap calculated by the report. In total, ENGL has declined for 145 of the 169 towns since 2011 – “thus the revenue raising capacity for towns has only become more difficult.”

CT Residents Believe Economy, Business Conditions Have Improved, But Uncertain About Future

Connecticut residents are somewhat more upbeat about the state of the state’s economy, but less than convinced that good economic news will keep coming, according to the results of the Connecticut Consumer Confidence Survey for the fourth quarter of 2015, released this week.  The quarterly survey,  by InformCT, a public-private partnership that provides independent, non-partisan research, analysis, and public outreach to help create fact-based dialogue and action in Connecticut, is designed to generate an ongoing measure of consumer confidence in the Connecticut economy.CTConsumConfSurveyLOGO When asked to think about overall business conditions in Connecticut versus 6 months ago, respondents – for the first time in three quarters – said conditions are better now than 6 months ago.  The margin was narrow - with 27 percent saying “better” and 25 percent saying “worse”, but that’s a reversal from the past two quarters, when more people were of the view that business conditions has worsened (22%-24% and 24%-28% in the two previous quarters).

The percentage of respondents who feel that the Connecticut economy is improving increased from 23 percent in the 3rd quarter to 27 percent in the most recent survey, and the percentage expressing concern that their job, or their spouses’ job, is in jeopardy, has declined in each of the four quarterly surveys, from 38 percent in the first quarter of 2015, to 36 percent, 35 percent and now 33 percent.SURVEY-RESULTS-v2

Administered for InformCT by the Connecticut Economic Resource Center, Inc. and Smith & Company, the analysis is based on the responses of residents across Connecticut and addresses key economic issues.  The most recent consumer confidence survey also saw an uptick in key indicators, as the percentage who believe:

  • there are “plenty of jobs for anyone who wants to work (as compared with 6 months ago)” increased from 10 percent to 13 percent
  • the employment situation will be better still in 6 months increased from 15 percent in the 3rd quarter to 17 percent in the 4th quarter
  • their personal financial situation is better now than 6 months ago increased from 63 percent in the third quarter to 65 percent in the 4th quarter survey.

Even though Connecticut residents feel conditions are improved, they are increasingly divided when asked if they expect that will continue.

When asked to look ahead six months, respondents have consistently believed business conditions will improve, but by a narrowing margin in each of the past four quarters.  In the beginning of the year, 30 percent thought business conditions would improve, as compared with 19 percent who thought conditions would worsen – an 11 point differential.  In the following three quarters, that differential narrowed to 9 points, then 5, and now 4.

There were other positive outcomes in the final quarterly survey of 2015, as the percentage who anticipate:

  • making a major consumer expenditure for furniture or some other product in the next 6 months jumped from 26 percent to 34 percent, reversing a slide from 36 percent in the year’s first quarterly survey.
  • buying a new car also increased, from 22 percent in Q3 to 25 percent in Q4, the highest percentage of any of the quarterly surveys on that question.
  • taking a vacation outside Connecticut in the next 6 months also rebounded, from 51 percent to 56 percent, reversing a diminishing percentage in each of the past two quarters.

There remain some troubling signs amidst the generally upbeat news.

The percentage who agree that Connecticut is a good place to live and raise a family and dropped slightly, and is under 50 percent for the first time in the quarterly surveys, at 47 percent.   The percentage of respondents who say they are likely to move out of the state in the next five years has increased in three consecutive quarters, from 32 percent to 34 percent to 37 percent, but remains lower than in the first quarterly survey, when it stood at 39 percent.

InformCT is a public-private partnership that currently includes staff from the Connecticut Economic Resource Center and the Connecticut Data Collaborative.  More information about subscribing can be found at informct.org.  Based in Rocky Hill, the Connecticut Economic Resource Center, Inc. is a nonprofit corporation and public-private partnership that provides economic development services consistent with state strategies, leveraging Connecticut’s unique advantages as a premier business location.  Smith & Company LLC, is a Shelton, Connecticut-based market research firm.


CT is Nation’s 5th Most Innovative State, Ranks 4th in Productivity

Massachusetts is the nation’s most innovative state, with California scoring a close second and Washington, New Jersey and Connecticut rounding out the top five states, according to The Bloomberg U.S. Innovation Index, in findings that highlighted the connections between education, research and innovation.index "There are some things that state governments can do to make their states more attractive to research and development," including R&D tax credits, Nariman Behravesh, chief economist at IHS Inc. in Lexington, Massachusetts told Governing magazine. "State governments — if they carefully target areas where they think they have a bit of a competitive advantage — they could develop a cluster around their universities, as well."

Bloomberg scored each of the 50 states on a 0-100 scale across six equally weighted metrics: R&D intensity; productivity; high-tech density; concentration of science, technology, engineering and mathematics (STEM) employment; science and engineering degree holders; and patent activity.

Mississippi, West Virginia and South Dakota are the three least innovative states.

Reviewing Connecticut rankings by category, the state ranked 4th in productivity, 8th in R&D intensity, 10th in science & engineering degree holders, 11th in patent activity, 13th in STEM concentration and 22nd in high-tech intensity. innovation

Rounding out the top 10 most innovative states were Oregon, Maryland, Colorado, Delaware and Minnesota.  Among the other New England states, New Hampshire ranked 12th, Rhode Island was 14th, Vermont ranked 25th, Maine finished near the bottom at number 43.

The data analyzed by Bloomberg came from the Bureau of Economic Analysis, Bureau of Labor Statistics, National Science Foundation, StatsAmerica.org and the U.S. Patent and Trademark Office.

mpa

Four Connecticut Companies Among Most Innovative in National Rankings

Four Connecticut companies are among the most innovative, according to rankings published by Fast Company magazine.  Harman Industries, Oxford Performance Materials, Priceline Group and GE were named among dozens of the companies, in a range of industries, for noteworthy innovative business practices and systems. Overall, the top 10 most innovative companies of 2016, according to Fast Company, are Buzzfeed, Facebook, CVS Health, Uber, Netflix, Amazon, Apple, Alphabet, Black Lives Matter and Taco Bell.  The next 10 include, Robinhood, Universal Studios, Huawei, Cyanogen, InMobi, Novocure, Bristol-Myers Squibb, Amgen, Spotify and GE.fast company

Fast Company also announced Top 50 lists selecting the most innovative companies in more than two dozen sectors, including architecture, design, automotive, biotech, education, energy, fitness, enterprise software, gaming, healthcare, marketing & advertising, media, retail and robotics.

Stamford-based Harman International Industries reached the list of the most innovative companies in the world for vehicle technology, led by an auto sound system that creates individual “sound zones” within vehicles. Harman ranked seventh on the Fast Company ranking of the 10 most innovative companies in the automotive sector.HarmanLogo

According to published reports, Harman’s individual sound zone concept allows drivers and passengers to personalize their own audio experiences with limited disruption or interference from other vehicle occupants, with digital signal processing tuned to the vehicle cabin and speakers to reduce the signals from other zones, regardless of whether they are music, vocal or other sounds. The Harman system utilizes a vehicle’s existing speakersOPMlogo_no text with the addition of headrest and ceiling speakers.

A Connecticut-based biotechnology company, South Windsor-based Oxford Performance Materials (OPM), reached the biotechnology list, ranking seventh.  The company, founded in 2000, was recognized for developing spinal implants. OPM’s founder and CEO is Scott DeFelice.

A pioneer in personalized medicine, OPM Biomedical became the only company to receive FDA clearance to manufacture 3D printed patient‐specific polymeric implants when it received clearance for its cranial prostheses line for surgeons in 2013, the company website points out. The company reports it now has two additional FDA clearances, and is an original equipment manufacturer for maxillofacial implants as well as its first spinal implant line.The-Priceline-Group

In addition, Norwalk-based Priceline Group was recognized by Fast Company among hospitality companies for its Booking.com hotel reservation system. The Priceline Group is the world’s leading provider of online travel & related services, provided to consumers and local partners in over 200 countries through six primary brands:  Booking.com, priceline.com, KAYAK, agoda.com, rentalcars.com, and OpenTable.


https://youtu.be/rTrKd3vPyWk

Federal Transportation Funds to Increase As Connecticut Considers Long-Term Plan

As Connecticut policy makers consider a long-term infrastructure investment in Connecticut’s transportation system, they do so just months after the federal government, after years of inaction, adopted the FAST (Fixing America’s Surface Transportation) Act at year’s end.  It is the first comprehensive transportation law since 2005, according to Connecticut’s Office of Legislative Research (OLR). The act includes $225.2 billion for highway investment, $61 billion for federal transit programs, and $10 billion for the Federal Railroad Administration and Amtrak.  States will get about a 5.1 percent increase in funding in FFY 16 and annual increases ranging from 2.1 percent to 2.4 percent in subsequent years, according to OLR.fast-act

State lawmakers are considering Governor Malloy’s proposed $100 billion, 30-year Let's Go CT! program, unveiled earlier this month, which included a call to enact a constitutional amendment creating a financial lockbox to protect transportation funds. Officials have said that 47 percent of state-maintained roadways are in “less-than-good condition”, and 35 percent of Connecticut's bridges are functionally obsolete or structurally deficient.  The Connecticut Business and Industry Association has said that 42 percent of businesses think the state's road congestion hinders their opportunities and growth.

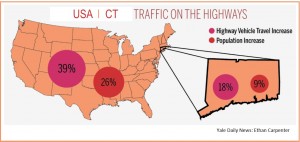
As a result of the FAST Act, Connecticut will receive about $3.5 billion over five years, or about $700 million annually, for highway and transit programs, which is about $62 million more per year than Connecticut received in 2015.  The state Department of Transportation says the act’s importance isn’t in the amount of money it provides, which does not change dramatically from previous levels, but in the predictability and assurance of funding it provides, OLR Principal Analyst Paul Frisman points out in a report to state legislators. ct usa

The FAST Act’s transfer of the $70 billion into the federal Highway Trust Fund (HTF) was essential to keep the fund solvent. The federal government has not increased the federal 18.4 cent gas tax in more than 20 years, and this has reduced the HTF’s purchasing power and reduced its ability to keep pace with rising infrastructure costs and inflation. Decreased revenues because of more fuel efficient vehicles and the popularity of alternative fuel vehicles also cloud the HTF’s future, the report indicates.  There continue to be concerns that if revenues going into the fund are not increased, insolvency may await, as soon as 2020.

The FAST Act also includes two new freight initiatives, including a National Freight Program which authorizes $6.2 billion over five years for national and state projects to improve highway freight transportation. The OLR report indicates that to participate, a state must complete a State Freight Plan, which it must update every five years. The American Road and Transportation Builders Association (ARTBA) has said that participating states will be able to obligate up to 10 percent of this funding to improve freight rail services or ports, which may be of particular interest to Connecticut.  The other new program is aimed at highway, bridge, rail-grade crossing, intermodal, and freight rail projects that cost at least $100 million, improve movement of both freight and people, reduce bottlenecks, and improve connectivity.

The FAST Act also makes changes to several highway funding programs, with a focus on surface transportation, local roads and bridges, transportation alternatives such as bicycling.  To increase efficiency and speed up the project review process, ARTBA reports that the FAST Act encourages the use of a single environmental review document throughout the entire review process, instead of the current practice of having each agency involved in a project conduct a separate review.

cars connecticutThe OLR report also indicates that a Federal Highway Administration pilot program permits up to three states to toll existing Interstate highways that they could not otherwise adequately maintain or improve, and increase funding available for public transportation initiatives.  In addition, $2.6 billion is provided to Amtrak’s Northeast Corridor (and $5.4 billion to other Amtrak lines) over five years. It separates the Northeast Corridor, from Boston to Washington, D.C, from other Amtrak accounts to ensure that the amounts assigned to that Corridor are used there, OLR reports.

Even with the additional funding nationwide, transportation officials in Connecticut and around the country continue to warn that “long-term, sustainable funding for transportation is yet to be achieved,” as described by the American Association of State Highway and Transportation Officials.

Corporate Headquarters Headed Back to Cities, But Shrinking, Report Says

The departure of GE’s corporate headquarters for Boston reflects a growing trend for headquarters of major corporations to relocate back to cities, but a recent study indicates they not only move, but shrink, becoming a “reconstituted, smaller version”of their former corporate selves. Analyst Saskia Sassen, author of The Global City, describes such moves, which often consist of “only the most senior people” in the firm as “executive headquarters.”  A feature this month by Crain’s Business Chicago investigates the trend, as it has been evolving in Chicago.  Their report points out that “these headquarters make for great headlines, but they don’t nroundecessarily result in that many jobs,” according to the website newgeography.

“The notion of the corporate headquarters in the ‘Mad Men’ world when there were hundreds or thousands of people in a building with the company logo . . . those days are gone,” says David Collis, a professor at Harvard Business School who studies corporate headquarters.

The Crain’s article points out that “when Chicago landed ADM in 2013, it got 70 executives and white-collar employees, plus a promise of 100 technology jobs that never arrived. Two years later, Decatur still has 4,200 ADM workers.”

The story points to good news and bad news for Chicago.  The bad news, is that a “headquarters ain’t what it used to be. On the other hand, Chicago is winning the battle for them,” and the ripple effect they provide.  These smaller executive headquarters, particularly for major global businesses, benefit from being in a global city, the article explains. Chicago has lured a number of these from out of town, noting that agro-industrial firms are increasingly choosing Chicago: ADM, Con Agra, Mead Johnson Nutrionals, and Oscar Mayer in recent years.

The same may be said for GE and Boston, and the city’s technology-intensive environment. Some fear that Chicago's technology startups, the article reports, are particularly vulnerable to leaving for Silicon Valley, attracted by venture capital and a deep talent poolHQ_chicago.  Boston may be in the running for similar relocations.

A similar phenomenon is occurring in Pittsburgh.  After 70 years in a suburban location, Kennametal announced plans last fall to relocate its world headquarters to an urban location. “We’re a global business that’s making changes to stay competitive in a new industrial era,” said the company.  “We have more than 13,000 employees in 40 countries serving customers in more than 60 countries every day. An urban location puts us in closer proximity to major universities and the airport and will enable us to recruit more talent.”

The Wall Street Journal reported last year that online travel agency Expedia Inc. announced plans to relocate its headquarters from a Seattle suburb that it called home for nearly 20 years to the city’s downtown.

“In the late 60s and early 70s, CEOs in places like New York City fled the city and moved to the suburbs, leading to the growth of Westchester County, Stamford and Greenwich, Connecticut,” Ed McMahon, a senior resident fellow for the Urban Land Institute, told the newspaper. “In those days, the determining factor was where the CEO of the company wanted to live.”

Now, the Journal reported, “large companies are moving back into the city in an attempt to attract and retain workers—particularly younger workers who are postponing homeownership and favor renting in walkable neighborhoods with easy access to restaurants, shopping and cultural opportunities.”

“Connecticut has really been hammered by the trend away from suburban campuses,” writes Michael Brendan Dougherty in The Week. “Aetna demolished a 1.3 million-square-foot campus in Middletown in 2011. That site is vacant. Pfizer dumped a research campus in Groton after that. The suburbs around Chicago, which once gladly received Sears' corporate headquarters, may be hit next.”  It seems that they are.

Picture6The Crain’s article reports that headquarters began shrinking a decade ago, but the trend has accelerated in the past three years, according to Vinay Couto, a consultant in the Chicago office of Strategy&. In recent years, 16 companies have relocated their main headquarters to the city from the suburbs. Seventeen came from outside the metro area. The phenomenon, he points out, is driven by the outsourcing of shared services such as IT, accounting and human resources, as well as by a mindset borrowed from private equity to cut overhead and make every part of a business count toward profitability.
The website Investopedia defines “corporate headquarters” as “a business' most prestigious location,” adding that it may “bring prestige to the city it is located in and help attract other businesses to the area.”

Moving headquarters can also be a way for companies to break from the past and shed employees and positions, Couto says.  And the loss of a major headquarters doesn't necessarily stifle job gains. When Boeing moved to Chicago, Seattle's economy kept growing, Kevin Hively, founder of Ninigret Partners, a business and economic development strategy consulting firm in Providence, R.I., told Crain’s. In that case, however, the presence of Microsoft and Amazon helped.

Patent Trolls Target Nearly 50 Connecticut Businesses, Filing Suits in Friendly Texas Court

“I know firsthand how detrimental patent trolls can be to small businesses, as my Connecticut small business was recently the victim of abusive patent litigation in which bad patents were used as weapons of financial intimidation against my small business. $100,000 in legal fees and ten months of litigation later, we successfully defended against these frivolous lawsuits, explained Michael Skelps, General Manager of Middlefield-based Capstone Photography recently in a published report. The New York Times has described patent trolls as “people who sue companies for infringement, often using patents of dubious value or questionable relevance, and then hold on like a terrier until they get license fees. In recent years, patent trolls — they prefer “patent assertion entities,” or P.A.E.’s — have gone from low-profile corporate migraine to mainstream scourge.”

Skelps said that “a year later, my small company is still recovering from exorbitant legal fees, none of which we were able to recoup from the legal system.  As a result of the lawsuit, my mom-and-pop photography shop had to downsize from five full-time employees to three part-time. We spent the equivalent of a year’s worth of profit to defend ourselves, with no budget allocated before to legal defense.”

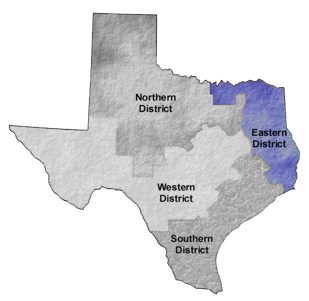
texasdistrictmapWhile action to combat the rapidly escalating challenge to businesses of every size has been unable to navigate through a divided Congress, the problem is growing.  One jurisdiction in particular is a hospitable home for the legal attacks.  Federal court in the Eastern District of Texas is the epicenter of patent troll litigation, and nearly 50 Connecticut companies are among those hauled into court there under dubious circumstances.
The Dallas Business Journal printed what read very much like a warning to American businesses, when a commentary noted that “the Eastern District of Texas’ misguided judicial system makes the towns of Tyler, Marshall, Beaumont and Texarkana the biggest patent-troll nest in the United States, filling the coffers of these tiny towns with money legally extorted from innovators that could otherwise be used to support business growth and create new jobs.”

The Connecticut businesses range from well-known names such as Xerox, UTC, Pitney Bowes, Aetna, Starwood, Priceline, WWE, Frontier Communications and Stanley Black & Decker to dozens of lesser known names lacking the deep pockets to fight what are usually unfounded allegations.  Small and medium-sized businesses – many in the tech fields - are frequently sued in East Texas even if they operate outside the state.  The goal appears to be either to force them to travel to the Lone Star State to defend their business practices, or to extract exorbitant settlements as the only way to avoid the travel and legal costs.

It is those out-of-court settlements that the trolls depend on, and which are bleeding some unsuspecting businesses virtually dry. The median compensatory-damage award by East Texas judges and juries in patent cases was $8.25 million, according to the article, written by the president and CEO of the Consumer Electronics Association, a U.S. trade association representing more than 2,000 consumer electronics companies.

Six months ago, in an effort to put an end to such activities, the Judiciary Committee in Congress approved legislation that would overhaul the nation’s patent laws.  That effort, however, has slowed, and ultimate passage in Congress is in doubt, according to published reports.patentsuit

In Connecticut, associations and organizations including The Credit Union League of Connecticut, Connecticut Food Association and the Connecticut Retail Merchant Association have called for federal action to end patent trolling.  The National Retail Federation has said that the cost of defending companies against the claims is so high — the average case costs $2 million and can take 18 months — that many victims settle out of court. The cases cost legitimate businesses close to $30 billion a year in direct costs and $80 billion indirectly, amounting to $943 a year for the average household when passed on to consumers.”

Small businesses bear the brunt of the litigation, but larger businesses are not immune.  About a year ago, it was reported that “Apple must pay a shell company $532.9 million because iTunes infringes upon three patents related to online patents, a jury in East Texas ruled.  The company in question … is also based in Texas and doesn’t make or do anything besides file patent lawsuits, as an Apple spokesperson pointed out, noting that the company “makes no products, has no employees, creates no jobs, has no U.S. presence, and is exploiting our patent system to seek royalties for technology Apple invented.”

By mid-2015, the U.S. District Court for the Eastern District of Texas was headed to a record year. An astonishing 1,387 patent cases were filed there in the first half of the year, according to published reports. This was 44.4 percent of all patent cases nationwide, and almost all of the growth is being “fueled by patent trolls.”  Reports indicate that in 1999, only fourteen patent cases were filed there. By 2003, the number of filings had grown to fifty-five. Ten years later, in 2013, it was 1,495.

Overall, patent disputes hit an all-time high of about 7,500 cases in 2015, largely driven by patent trolls who filed two-thirds of the lawsuits, according to a report from Unified Patents. The number of lawsuits filed by non-practicing entities (NPEs), known as “patent trolls,” increased by 25 percent.  Last year, patent troll filings made up 95 percent of the cases in the Eastern District of Texas.

While Congress is mired in inaction, at least one state is stepping into the fray.  Virginia Attorney General Mark Herring, a Democrat who took office in 2014, announced last week a new initiative to support Virginia businesses by combating patent trolling through a newly formed Attorney General’s Patent Troll Unit.

Herring’s announcement explained that “in recent years high-tech businesses, Main Street businesses, and everything in between have become frequent targets of “patent trolls” who send bad faith demand letters, request unjustified licensing fees, and threaten baseless lawsuits. Unchecked, patent trolls and their bad faith practices stifle innovation in the Commonwealth, have a negative impact on our innovation-driven economy, and tie up the courts.” Businesses are forced to “choose between paying unjustified licensing fees and engaging in costly litigation,” the  announcement stressed.

The federal Government Accountability Office (GAO), according to a Washington Post report, found that a disproportionate share of patent litigation concerns software patents. The non-partisan government agency found that the number of defendants in patent lawsuits more than doubling from 2007 through 2011. Notably, this increase is specifically related to software patents — software patents account for 89% of the increase, according to the GAO's calculations.

Said Skelps: “our current patent system is ripe for exploitation. Like the abusive patent litigation we endured, malicious actors are abusing the system and using it as a weapon against legitimate businesses, harming innovation, driving small companies out of business, and overtaxing our already overburdened litigation system.”

CT Ranks 20th in Dependence on Gun Industry, But 3rd in Firearms Output, 2nd in Industry Wages

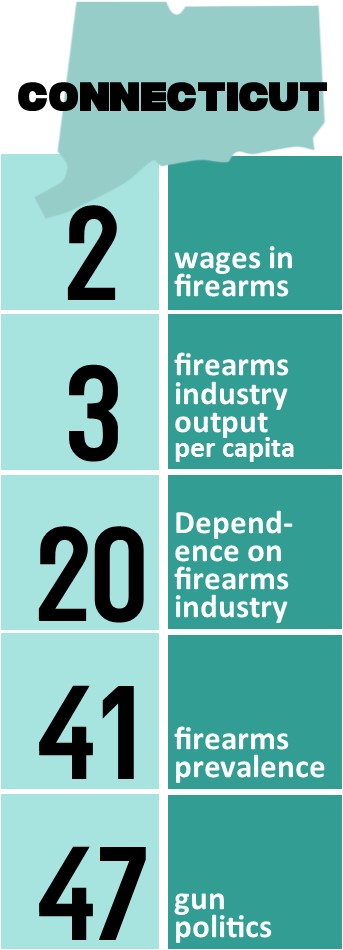
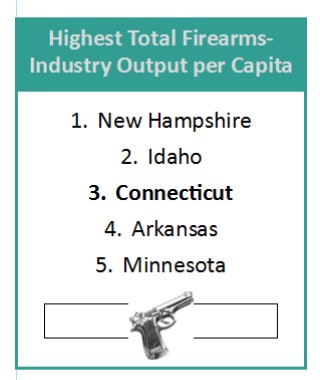
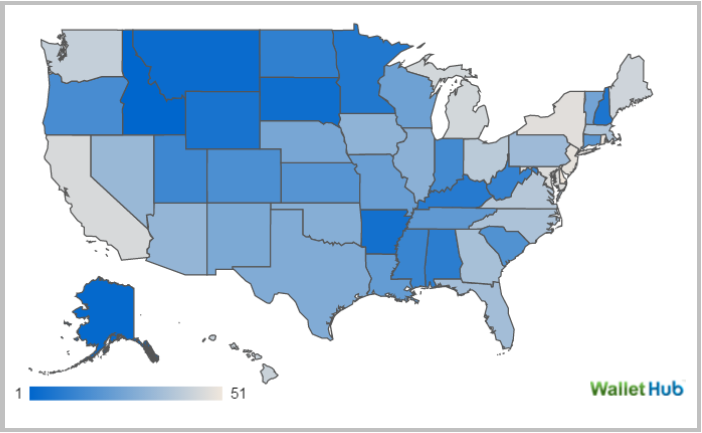
Connecticut’s place in the ongoing national debate about guns is reflected in a new analysis which ranks the state 20th in the nation in overall dependence on the gun industry, but also ranks the state 3rd in total firearms industry output per capita and 2nd in highest average wages & benefits in the firearms industry. Picture8With the gun debate center-stage in the presidential primaries and in Washington, D.C., the website WalletHub analyzed which states depend most on the arms and ammunitions industry both directly for jobs and political contributions and indirectly through firearm ownership. WalletHub’s analysts compared the 50 states and the District of Columbia across three key dimensions: 1) Firearms Industry, 2) Gun Prevalence and 3) Gun Politics and eight metrics.
Connecticut also came in 41st in its "firearms prevalence rank" and 47th in "gun politics rank."

The states Most Dependent on the Gun Industry were Idaho, Alaska, Montana, South Dakota, Arkansas, Wyoming, New Hampshire, Minnesota, Kentucky and Alabama.gun stat chart

Officials point out that the gun industry plays an important role in the U.S. economy, and Connecticut is no exception. By one estimate, firearms and ammunitions contributed a total of nearly $43 billion to the national economy in 2014. That figure accounts for more than 263,000 jobs that paid $13.7 billion in total wages, according to the report from the Connecticut-based National Shooting Sports Foundation. In the same year, federal and state governments collected from the industry more than $5.79 billion in business taxes, plus an additional $863.7 million in federal excise duties, the WalletHub report indicated.

In the overall rankings, the states determined to be least dependent on the gun industry are Maryland, New York, New Jersey, Rhode Island and Delaware.

The analysis also found:

  • The number of firearms-industry jobs per capita is highest in New Hampshire, which is seven times greater than in the District of Columbia, where it is lowest.
  • The average wages & benefits in the firearms industry is highest in the District of Columbia, which is three times greater than in New Mexico, where it is lowest.
  • The total firearms industry output per capita is highest in New Hampshire, which is 18 times greater than in Hawaii, where it is lowest.
  • The total taxes paid by the firearms industry per capita is highest in Montana, which is six times greater than in Delaware, where it is lowest.
  • Gun ownership is highest in Alaska, which is 12 times greater than in Delaware, where it is lowest.

The eight relevant metrics utilized in the analysis and their corresponding weights were as follows:map

Firearms Industry – Total Points: 35

  • Number of Firearms-Industry Jobs per 10,000 Residents: (~14 Points)
  • Average Wages & Benefits in the Firearms Industry: (~7 Points)
  • Total Firearms Industry Output per Capita: (~7 Points)
  • Total Taxes Paid by the Firearms Industry per Capita: (~7 Points)

Gun Prevalence – Total Points: 35

  • Gun Ownership: (~17.5 Points)
  • Gun Sales per 1,000 Residents (approximated by using National Instant Criminal Background Check System data): (~17.5 Points)

Gun Politics – Total Points: 30

  • Gun-Control Contributions to Congressional Members per 100,000 Residents: (~15 Points)
  • Gun-Rights Contributions to Congressional Members per 100,000 Residents: (~15 Points)

Data used to create these rankings were collected from the U.S. Census Bureau, the National Shooting Sports Foundation, the Federal Bureau of Investigation, the BMJ Publishing Group and the Center for Responsive Politics, according to WalletHub.