Percentage of Unbanked, Underbanked Households Continues to Climb in CT, Now Exceeds 1 in 5 Households

One in five Connecticut households is unbanked or underbanked, according to data compiled by the Federal Deposit Insurance Corporation, and the percentage of residents unbanked – those that do not have an account at an insured institution - has climbed in the state over the past six years. The percentage of Connecticut households considered unbanked has risen steadily, from 5.3 percent in 2009 to 6.2 percent in 2015, the most recent year for which data is available.  Connecticut ranked 21st in the nation in the percentage of unbanked households. 

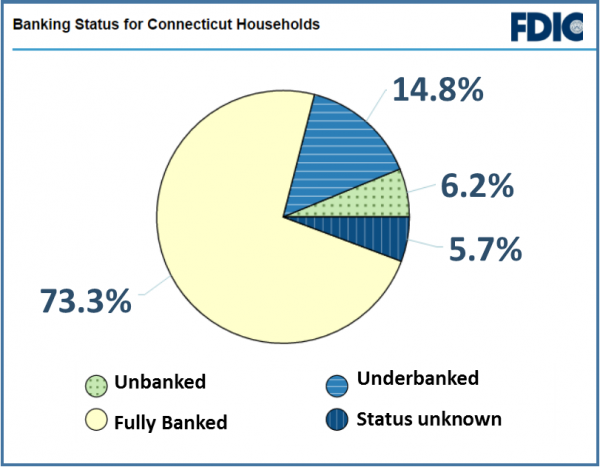
Overall, the percentage of state households thatare either unbanked or underbanked increased slightly, from 20 percent to 21 percent between 2013 and 2015.  Those considered unbanked had a checking or savings account but also obtained financial products and services outside of the banking system.

Connecticut’s percentage of unbanked and underbanked individuals is better than the national average, which is 26.9 percent.  Nationally, 68 percent are considered to be fully banked, with an account or accounts at an insured institution, compared with 73.3 percent in Connecticut.

To assess the inclusiveness of the nation’s banking system, and in partial fulfillment of a statutory responsibility, the FDIC conducts biennial surveys of households to estimate the proportion of households that do not fully participate in the banking system.  The survey provides estimates of the proportion of U.S. households that do not have an account at an insured institution, and the proportion that have an account but obtained (nonbank) alternative financial services in the past 12 months.

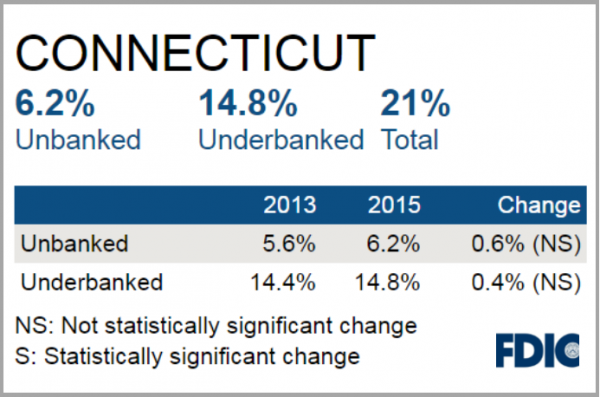
Estimates from the 2015 survey indicate that 7.0 percent of households in the United States were unbanked in 2015. This proportion represents approximately 9.0 million households. An additional 19.9 percent of U.S. households (24.5 million) were underbanked,

The 2015 FDIC National Survey of Unbanked and Underbanked Households presents new data and insights on the size of unbanked and underbanked markets at the national, regional, state, and large metropolitan statistical area (MSA) levels. This is the fourth installment of the report.

In the Hartford-East Hartford-West Hartford metropolitan statistical area, a slightly higher percentage of households are unbanked or underbanked – 25.6 percent.  In the New Haven-Milford MSA, that percentage is slightly lower than statewide, at 19.5 percent.  The Bridgeport-Stamford-Norwalk MSA is lower still, at 18 percent.

CT’s Local Government Workforce Shrinks 7.4% in Past Decade; 10th Largest Reduction in US from Employment Peak

Connecticut’s local municipal workforce has been shrinking for the past decade, and had been reduced 7.4 percent by 2015 when compared with the peak employment year of 2005, according to a new analysis by Governing magazine.  The drop in local government employment is the 10th largest in the country by percentage of workforce, when peak employment levels were compared with 2015 numbers. “Going on nearly a decade since the start of the recession, localities in many parts of the country have since restored public payrolls to prior levels. But some still employ far fewer workers than they did before the downturn,” Governing reported.

Governing compared each state's pre-2010 peak aggregate totals to the latest 2015 data, excluding the education sector.  In all, the magazine reported, local governments in 26 states had yet to see payroll expenditures return to prior levels when adjusted for inflation. Similarly, local public employment remains below previous highs in most states and is down 3.5 percent nationally from 2008.

The steepest declines in local government payrolls, when 2015 data was compared with the peak pre-recession year, came in Delaware (-20.5% from 2007), Michigan (-18.2% from 2003), Arizona (-17.1% from 2008), Rhode Island (-16.5% from 2003), Massachusetts (-14.4% from 2008), Nevada (-14.1% from 2009), Florida (-11.0% from 2008), Indiana (-8.8% from 2008), New Jersey (-8.3% from 2009) and Connecticut (-7.4% from 2005).

Where localities chose to make payroll cuts has varied, according to the analysis, but a number of patterns were pointed out, based on Census data.  When national employment estimates were compared with 2008 levels, non-sworn police employees sustained the single largest reduction of any major category of workers, the analysis indicated. Governing suggested the reductions were likely a result of police departments trimming civilian staff to maintain the size of police forces on the streets. Nationally, the number of police and firefighters were down 2.6 percent from 2008 while all other areas of local government, excluding education and hospitals, experienced a larger 4.5 percent decline.

At the opposite end of the spectrum, North Dakota, South Dakota, Wyoming, Montana and New Mexico recorded the biggest increases in noneducation payrolls since the recession began in 2008-2009.  Half the states showed an increase in local government payrolls, and despite the generally slow recovery across many regions of the country, U.S. local government payroll spending overall showed a slight three  percent nationwide uptick between 2014 and 2015, according to the analysis.

College Debt Continues to Climb; Connecticut Students Graduate with 3rd Highest Loan Debt in US

Nearly two-thirds of students who graduated from public and nonprofit colleges in Connecticut in 2015 had student loan debt averaging $34,773, the third highest level in the nation.  The state ranked 14th in the percentage of students graduating with debt, according to data compiled by The Institute for College Access & Success (TICAS). Student debt continues to rise for new graduates, across the country and in Connecticut.  Student debt at graduation ranged from $15,521 for Yale University graduates to $47, 715 at Sacred Heart University and $47,873 at Quinnipiac University.

At public and nonprofit colleges in 2015, seven in 10 graduating seniors (68%) had student loans. Their average debt was $30,100: up four percent compared to the Class of 2014. About one-fifth of 2015 graduates’ debt (19%) was in private (non-federal) loans, which are typically more costly and provide far fewer consumer protections and repayment options than federal student loans, the Institute pointed out.

At institutions across the country, state averages for debt at graduation in 2015 ranged from $18,850 to $36,100, and new graduates’ likelihood of having debt ranged from 41 percent to 76 percent.

In 12 states, including Connecticut, average debt was more than $30,000 – up from six states the year before. High-debt states remain concentrated in the Northeast and Midwest, with low-debt states mainly in the West. Average debt at the college level varies even more, from a low of $3,000 to a high of $53,000, and the share graduating with loans ranges from seven percent to 100 percent.

“Student debt is still rising, and the typical college graduate now leaves school with over $30,000 in loans,” said TICAS president Lauren Asher. “We need to make college more affordable and debt less burdensome for students and families.”

The states with the highest debt levels for graduating students, according to the TICAS study, are New Hampshire ($36,101); Pennsylvania ($34,798); Connecticut ($34,773); Delaware ($33,849) and Rhode Island ($32,920).  At the other end of the spectrum, students graduation from colleges in Oklahoma have the lowest average debt ($24,849), followed by Washington, Arizona, Nevada and Hawaii.


CT Seen As Hiding Bad Budget News

In an article headlined “Bad Budget News? Some States Just Bury It.” Connecticut is one of two states selected as a poster child for what a national publication describes as “hindering transparency.” The Connecticut policy that brought the unwelcome attention was put in place last year.  As Governing explains:

“Connecticut ended its practice of current services projections. That’s a boring-sounding way of talking about how much programs will cost over time, assuming there are no policy changes. It’s a baseline against which to compare any proposed cuts or increases in spending.”

Ben Barnes, Connecticut’s budget director (Secretary of the Office of Policy and Management), said last year that it didn’t make sense to project shortfalls or surpluses into the future, Governing explains. “There’s no such thing, in my view, as a deficit or a surplus in years in which there is no appropriation in place,” said Barnes, whose photo accompanies the article.

Some legislators complained that the new rules would be a blow against transparency in the budget. The change was adopted anyway, the publication noted, adding that a majority of states already choose not to publish current services projections.

“There is kind of a tendency for policymakers to focus on the immediate and not the future,” Liz McNichol of the Center on Budget and Policy Priorities, told Governing. “This reduces the outside pressure to look beyond one year.”

The publication’s report notes that Connecticut “will have to fill a shortfall of more than $1 billion in its budget this year.”

The other state highlighted in the article is Kansas, where a state task force recommended that the department stop releasing monthly budget reports after numerous reports indicated that the state had fallen short of anticipated revenues.   The Governor’s administration also “decided to kill a quarterly economic report that was also habitually filled with bad numbers.”

Governing is the nation's leading media platform covering politics, policy and management for state and local government leaders.


CT Employers Less Optimistic About Hiring in First Quarter

Employers nationwide are slightly more optimistic about hiring in the first quarter of 2017 than employers in Connecticut, according to the ManpowerGroup Employment Outlook Survey, although both expect to hire at a favorable pace during the first quarter of 2017. 
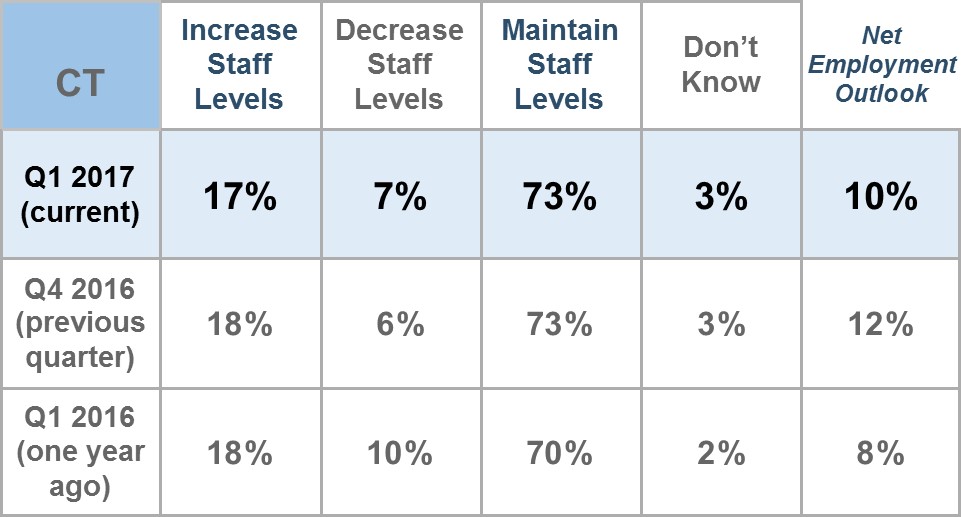
From January to March, 17 percent of Connecticut companies interviewed plan to hire more employees, while 7 percent expect to reduce their payrolls. Another 73 percent expect to maintain their current workforce levels and 3 percent are not certain of their hiring plans. This yields a Net Employment Outlook* of 10 percent.

For the coming quarter, job prospects appear best in Durable Goods Manufacturing, Nondurable Goods Manufacturing, Transportation & Utilities, Wholesale & Retail Trade, Financial Activities, Professional & Business Services, Education & Health Services, Leisure & Hospitality and Government. Employers in Construction, In
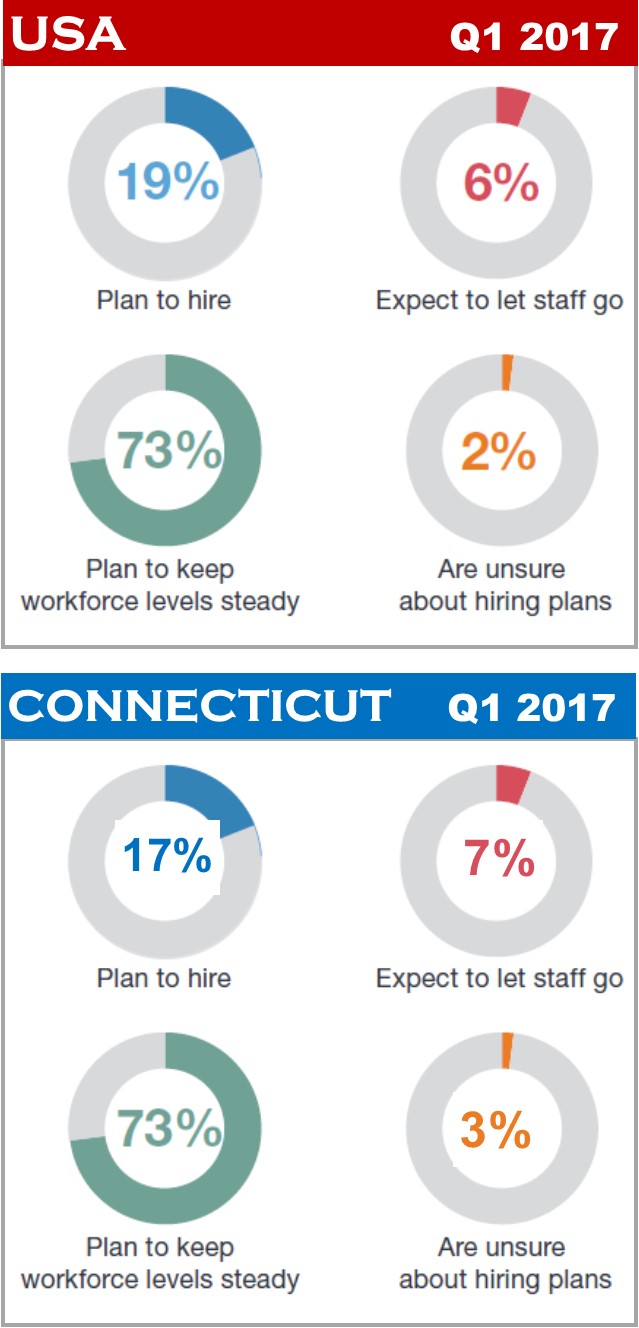
formation and Other Services plan to reduce staffing levels.

“Hiring intentions are weaker compared to Q4 2016 when the Net Employment Outlook was 12%,” said ManpowerGroup spokesperson Betty Gooding said about the Connecticut outlook. “The hiring pace is expected to pick up compared to one year ago when the Net Employment Outlook was 8%.” Of the more than 11,000 employers surveyed in the United States, 19 percent expect to add to their workforces, and 6 percent expect a decline in their payrolls during Quarter 1 2017. Seventy-three percent of employers anticipate making no change to staff levels, and the remaining 2 percent of employers are undecided about their hiring plans.

When seasonal variations are removed from the data, the Net Employment Outlook is +16 percent, a slight decrease compared to the Quarter 4 2016 Outlook, +18 percent.  That’s a somewhat more optimistic view than employers in Connecticut, the survey found.

Charitable Giving in CT Not Keeping Pace with U.S., Report Finds

The latest report from the Connecticut Council of Philanthropy (CCP), which highlights philanthropic giving in Connecticut shows that as giving across the U.S. has increased, the opposite is true of Connecticut, even as individual giving – which makes up the lion’s share of giving – has increased. The report, which highlights calendar year 2014 and the years leading up to it, reveals that while total giving in the U.S. increased from 2013 to 2014, total giving in Connecticut dropped from $4.66 billion to $4.51 billion. Over the five years through 2014, individual giving by Connecticut taxpayers who itemized rose 14 percent, less than the increase nationally of 25 percent.  More than three-quarters of giving in Connecticut is by individuals.

In 2014, Connecticut was ranked number one in per capita income by state and 45th in charitable giving.  All six New England states rank at the bottom in per capita giving, while Southern states rank near the top.  Yet the proportion of tax returns reporting contributions in 2014 at 34.5 percent was considerably higher than the national average of 24.5 percent, the report indicated.

The annual report, Giving in Connecticut, looks at charitable giving by Connecticut grant makers and residents, including: individual giving through reported contributions, bequests made through estate giving, and foundation giving. Giving in Connecticut uses data from the IRS Statistics of income Division, the Foundation Center, and self-reported data gathered by CCP.

The report, published this month, found that:

  • Giving in Connecticut from all sources at $4.51 billion was down 3.2 percent from 2013, due primarily to a drop in bequests.
  • The giving breakdown: $3.39 billion from individuals; $1.02 billion from foundations; $.09 billion from bequests
  • Giving by individuals was up 2.8 percent.
  • Giving by all foundations was up 2.1 percent.
  • Giving via bequests was down 74 percent after being up the previous year by 76 percent.
  • Giving by individuals and bequests combined at $3.48 billion amounted to 77 percent of all giving.

The report indicated that giving by foundations saw most grants going to Education and Health. Giving by foundations is greatest in Fairfield County where 56 percent of Connecticut foundations are based. They gave $747 million to charities, representing 73 percent of total foundation grant making.

Religion is the largest single category of recipient type of charity across the U.S., at 33 percent.  Education ranks second at 15 percent.

The 20-page report also found that in 2012, individual giving in Connecticut spiked, apparently in response to Superstorm Sandy and the tragedy at the Sandy Hook elementary school in Newtown.

Connecticut has 1,425 Private Foundations, 79 of which are Operating Foundations, 59 are Corporate Foundations and 20 are Community Foundations, according to the report. Community Foundations assets showed strong growth of 41 percent from 2010 to 2014, from $1.37 billion to $1.92 billion. Connecticut Corporate Foundation giving remained steady during the five year period while private foundation giving climbed.  

The top five foundations, by giving, were the Boehringer Ingelheim Cares Foundation, Dalio Foundation, GE Foundation, The Zoom Foundation, and the Steven & Alexandra M. Cohen Foundation.  Rounding out the top 12 in 2014 were Hartford Foundation for Public Giving, Seedlings Foundation, Newman’s Own Foundation, The Community Foundation for Greater New Haven, Smith Richardson Foundation, Connecticut Bar Foundation and Aetna Foundation.

The Connecticut Council for Philanthropy is an association of grantmakers committed to promoting philanthropy for the public good.


CT Residents See Regionalism as Viable Option for Local Services; Highway Improvement A Transportation Priority

Connecticut residents believe that some services traditionally handled by individual municipalities  can be effectively delivered regionally.  A new statewide survey found that public health earns the most support for a regional approach and public safety the least.  More than 3 in 4 people (76%) say that public health services can be provided on a regional basis, followed by animal control (68 percent) and education (66 percent).  The survey found that 65 percent of state residents believe that library services can be delivered regionally, and 61 percent share that view regarding public safety services. The survey for InformCT, a public-private partnership that provides independent, non-partisan research, analysis, and public outreach, was administered by researchers from the Connecticut Economic Resource Center, Inc. (CERC) and Smith & Company.  The analysis is based on the responses of survey of 510 state residents, with a margin of error of 5 percent. logl

Survey respondents were asked about regionalization of services in surveys conducted in the first three quarters this year, and support was generally consistent – respondent’s views of regionalizing the various services did not vary more than four percentage points for any of the policy areas during that time.  Favorability of regionalization of public health services has increased each quarter, while regionalizing education has increased from Quarter 1.  While support for regional public safety services has also increased from Quarter 1, it received the least support among the services queried in each survey.  Only regionalizing libraries has seen a decline from the first quarter, and preferences for regionalizing animal control has held steady.

stats
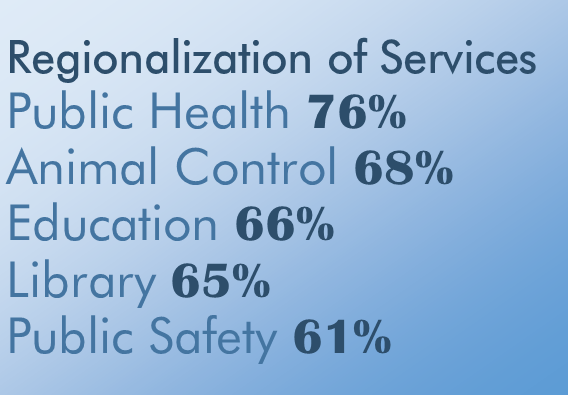
“Increasingly, towns will not be able to afford to sustain the level of services to which they have become accustomed, as budget pressures increase along with a reluctance to raise taxes. Residents showed concern, and a willingness to consider regionalism as a partial solution,” said Robert W. Santy, who serves as Board Chair of Inform CT and is President & CEO of the Connecticut Economic Resource Center (CERC) Inc.

The  also found that the most important factor when choosing a town in which to live, is property taxes, followed by the quality of the school system.  Those factors earned 53 percent and 51 percent of respondents, respectively, who describe the factor as “very important” - the only aspects  described as very important factor by a majority. Other factors deemed very important include recent appreciation of home values (30 percent), proximity to transportation and employment (29 percent) and proximity to entertainment ad amenities (24 percent).

The survey  also asked about transportation in Connecticut, finding that 74 percent said they use their car almost every day.  Other modes of transportation were not nearly as popular.   More than 80 percent indicated that they had used a local bus (86%), long distance bus (91%), commuter rail (87%), Amtrak (92%), an airplane (92%) or a bicycle (82%) only once, or not at all, in the past month.  Regarding state spending to improve transportation, respondents ranked highway improvements as the highest priority by a wide margin, with commuter rail, local bus, and bicycle lanes/pedestrian walkways, ranked next highest.  Highway improvements was described as the highest priority by more respondents than the other six options combined.


Rate of Success Obtaining Venture Capital is High in Hartford, Study Finds

A look at the nation’s 50 largest metropolitan areas to see how entrepreneurs have fared in their quests to secure money from venture capitalists, angel investors, and online crowds brought a somewhat surprising result – among the cities mentioned as ranking high in venture funding success rates was Hartford. Connecticut’s Capitol was listed among a handful of cities with success rates for businesses seeking venture capital that “are about twice as high as the national average.” According to a new report issued this month by the Kauffman Foundation, roughly $68 billion was invested in venture capital (VC) deals in the United States in 2014 and 7,878 employer businesses reported receiving venture capital funds. Thirty percent of those recipients were located in just four metro areas: New York, Los Angeles, San Francisco, and Boston. The national average was 0.2%.vc

Among the metro areas that rank highly in terms of those venture funding success rates, according to the report “Trends in Venture Capital, Angel Investing and Crowdfunding,” include: San Francisco, CA (0.8%), San Jose, CA (0.8%), Boston, MA (0.5%), Hartford, CT (0.5%), Memphis, TN (0.4%), Minneapolis, MN (0.4%), Philadelphia, PA, (0.4%), Richmond, VA (0.4%), Washington, D.C. (0.4%). Among the lowest ranked of the 50 largest metropolitan regions in the nation, at 0.1 percent, were Baltimore, Denver, Jacksonville, Las Vegas, Orlando, Riverside, and Tampa.

The report noted that “Some perhaps unlikely metro areas rank highly in terms of those venture funding success rates: Hartford, Memphis, Richmond, and Buffalo. This doesn’t necessarily mean that there are higher quality firms there, and, of course, the volume of firms seeking VC is smaller…And, these data don’t mean that all the funding came from local sources: venture capital firms in New York could be investing in Hartford businesses. But these numbers lend credence to arguments…that high-quality deals can be found everywhere, and that firms in these regions can succeed in raising equity capital.”

While 10.3 percent of entrepreneurs report using personal credit cards when starting their business, nationally, only 0.6 percent initially received venture capital, the analysis found.

The metros with the highest percentage of firms receiving venture capital funding when starting include: San Jose (2.4%), San Francisco (1.5%), Salt Lake City (1.3%), Austreportin (1.2%), Baltimore (1.1%), Birmingham (1.1%), and Nashville (1.1%).

According to the report, based on the 2014 Annual Survey of Entrepreneurs (ASE), “the primary sources of initial financing for new businesses in the United States are: personal and family savings, bank business loans, and personal credit cards.”  The report notes, however, that “entrepreneurs also tap other sources of funding, including venture capital, which “can be disproportionately important for business growth.”

The ASE, conducted by the U.S. Census Bureau, is the largest annual survey of American entrepreneurs ever done, and is done in a public-private partnership between the Census Bureau, the Kauffman Foundation, and the Minority Business Development Agency. The ASE samples approximately 290,000 employer businesses across all U.S. geographies and demographics, the report explained.

The top metropolitan statistical area for crowdfunding success in 2014 was Charlotte; for angel investing, San Jose led the way.  The report concludes that the concentration of venture capital firms in California, Massachusetts, and New York, “is well-correlated with the relative concentration of firms that receive VC investments.” Crowdfunding campaigns in Minneapolis and Oklahoma City, the report indicates, “may not be entirely due to local funders.”

“The ASE data add quantitative confirmation to what we know from other sources: high-quality entrepreneurs can be found—and can get funding—in nearly every corner of the United States.”

Including Hartford.

CT is Among 24 States Seeing Weak Revenues, Highest Number Since Recession

Connecticut is not alone. According to the National Association of State Budget Officers’ (NASBO) annual state spending survey, half of all states saw revenues come in lower than budgeted in fiscal 2016 and 24 states – including Connecticut - are seeing those weak revenue conditions carry into fiscal 2017. the-chartThat is the highest number of states falling short of revenue projections since 36 states budgets missed their mark in 2010, according to the NASBO report and Governing.  As a result, 19 states made mid-year budget cuts in 2016, totaling $2.8 billion, Connecticut among them. That number of states “is historically high outside of a recessionary period,” according to the report.  The revenue slowdown is caused mainly by slow income tax growth, even slower sales tax growth and an outright decline in corporate tax revenue, the report explains, stating that “progress since the Great Recession has been uneven, and many states are seeing softening state tax collections.”fall-2016-fiscal-survey-cover

Overall, state spending totaled $786 billion last fiscal year, a 3.7 percent annual increase. Although it marks the seventh straight year of spending growth, it represents a slowdown from fiscal 2015 when spending increased by 4.4 percent.

“Weaker-than-anticipated revenue collections and resulting budget gaps in fiscal 2016 led some states to cut spending during the year,” the report indicated, with overall spending increasing just 1.8 percent to $781 billion in fiscal 2016, compared with the previous year’s growth of 5 percent. When accounting for inflation, 32 states are still spending less than they did before the Great Recession and total state spending also has yet to surpass pre-recession levels.  Across the states, cuts enacted by legislatures come most often in K-12 education, an “all other” category, followed by Medicaid, higher education and corrections, according to data compiled for the NASBO report.

The state has an estimated $1.3 billion or $1.5 billion budget deficit, according to reports from the governor’s Office of Policy and Management and the legislature’s nonpartisan Office of Fiscal Analysis, CTNewsJunkie reported recently.

“Certainly a recession is coming sometime soon,” said NASBO President-elect Michael Cohen, who is also California’s finance director, told Governing. “But I think economists in all of the state offices would tell you that’s a really hard economic forecasting [task] of predicting when that’s going to happen.”  NASBO had previously predicted that fiscal 2016 would mark the full recovery of state budgets from the recession, but the cutbacks and increased inflation has delayed that at least another year.

The report indicates that eight (including energy-producing states like Alaska, North Dakota and Oklahoma) planned to spend less in 2017, and 11 states planned to up their spending by 6 percent or more next year. In those states, sales tax increases have improved their revenue with Louisiana, for example, anticipating a 17 percent increase in revenue, driven by an expected $800 million increase in sales tax collections.

Most states have focused on strengthening their rainy day funds, according to the report, though some states – particularly energy-producing ones – have had to tap their reserves to help address budget shortfalls. Twenty-nine states increased their rainy day fund balances in fiscal 2016, and 25 states project increases in fiscal 2017. Since aggregate rainy day fund levels hit a recent low in fiscal 2010, 40 states had increased their amounts as of the end of fiscal 2016, at least in nominal terms, the report said.

“States will also have to contend with rising spending demands in areas such as health care and education, long-term pressures such as pensions and infrastructure, and increasing federal uncertainty,” the report predicted, “particularly concerning the prospects of tax reform and health care policy. In this environment, states are likely to be cautious in their spending and revenue forecasts, as they continue to focus on ensuring structurally balanced budgets.”

https://youtu.be/uAvz-zo9NQw

MA Overtakes CT, Jobs on Horizon for EB - Bad News, Good News for State Economy

Connecticut is “in a rut”according to one regional newspaper, while another is reporting on plans by a local company to hire 14,000 workers during the next decade.  Bad news and good news, simultaneously. “Ten years ago, it was the undisputed economic king of New England, with average incomes 13 percent higher than Massachusetts and 40 percent above third-ranked New Hampshire,” the Boston Globe's data reporter says of Connecticut.  “Throughout the 1990s and 2000s, low- and middle-wage workers in Connecticut consistently took home bigger paychecks than their Massachusetts peers.  In the past few years all these economic advantages have disappeared. Unemployment is now far lower in Massachusetts. And Bay State employees get the best wages — whether you look at low-earners, top-earners, or those in the middle.”

The Globe cites recent housing data to underscore the point.

“Of all the cities tracked by the National Association of Realtors, 90 percent have seen their housing prices rise since 2010. That leaves just 17 metropolitan areas still trying to claw back from the recession. Four of those underwater markets are in Connecticut — and they extend to virtually every corner of the state, from Stamford in the southwest to New London in the east and as far north as Hartford.”economy

“Among the biggest changes in the Massachusetts economy,” the Globe column points out, “has been the explosion of professional, scientific, and technical services — think architects, engineers, software designers, consultants, and scientific researchers. Since 2000, this sector has grown by nearly 50 percent in Massachusetts, which is a key reason the state as a whole has performed so well. In Connecticut, these same fields have expanded by just 6 percent.”

Globe reporter Evan Horowitz, who writes the paper’s Quick Study column using data to discuss policy,  notes that “without a hub like Boston, Connecticut can’t simply pull pages from the Massachusetts playbook.”  He suggests that “a Trump-fueled surge in corporate profits and stock valuations could provide a much-needed boost to the state’s fortunes. But if there’s one lesson of recent years, it’s that counting on Wall Street excess to compensate for other economic ills is a dangerous strategy; bubbles burst, recessions happen, and in the absence of a long-term economic strategy, Connecticut could once again find itself floundering.”

A brighter ray of potential economic sunshine is reported by the Day of New London, outlining plans by General Dynamics Electric Boat in Groton for a massive decade-long hiring spree resulting from an increase in submarine orders by the U.S. Navy, spurred by “strong Congressional support.”

chart“The company will hire 14,000 new employees over the next 13 years,” the Day reports.  “Those employees will fill new positions and those being vacated by retirees and those who leave for other reasons. The burst in new hires will take EB from its workforce of 14,500 today to 18,000 in 2030.  This year alone, the company hired 1,600 new full-time employees. Another 800 received conditional job offers and are in the process of applying for a security clearance or awaiting that clearance.”

Reporter Julia Bergman indicates that “six different submarines are currently under construction there. Another is in for its ‘50,000 mile checkup.’ And an eighth is undergoing a major overhaul.”

The work – and the jobs – extend beyond EB.sub

“While the engineering workforce has neared its peak, EB will continue to hire a larger number of shipyard personnel such as welders, machinists, and electricians,” the Day reports. “About 40 percent of this year’s new hires were tradespeople.”  Training programs and local colleges are straining to meet the demand, the newspaper reports.

Underscoring the importance of healthcare to Connecticut’s economy, there is a new number one employer (by number of employees) in the state, according to published reports.  A year ago, United Technologies was the largest employer in Connecticut, according to 24/7 Wall Street.  After selling its helicopter division, Sikorsky, UTC’s employee headcount dropped from around 24,500 to an estimated 16,000. With 20,396 total employees, Yale New Haven Health is now the largest employer in Connecticut, the publication notes.  Yale New Haven Health includes Bridgeport HospitalGreenwich HospitalYale New Haven HospitalYale New Haven Children's HospitalSmilow Cancer Hospital at Yale New Haven and Yale New Haven Psychiatric Hospital.  The Hartford Business Journal last year ranked Hartford Healthcare, with 18,000 employees, just behind Yale New Haven Health.  Hartford Healthcare acute care facilities include Backus HospitalHartford HospitalThe Hospital of Central ConnecticutMidState Medical Center and Windham Hospital.