Governor Travels to Iowa for Insurance Industry Keynote

When “attendees from around the world” convened in the “insurance hub of Des Moines, Iowa,” for the second annual Global Insurance Symposium, the keynote speaker was an individual from a state long considered as the hub of the industry, Governor Dannel Malloy of Connecticut. The symposium, being held this week, was designed to “provide a forum for insurance professionals and regulatory authorities to share insights into challenges facing the insurance industry,” and includes “some of the most knowledgeable experts in the insurance field and discuss important issues facing the industry, such as cybersecurity and big data,” according to conference organizers.

Why Des Moines, Iowa?  The conference website points out that “for decades, Iowa has been committed to policy that creates favorable conditions for the insurance industry to thrive. As home to more than 200 insurance companies, Iowa is uniquely suited to host the Global Insurance Symposium and assemble global leaders to discuss these important issues.”

The symposium will  also serve as a coming out for six start-ups completing Iowa's Global Insurance Accelerator, a fast-track business development program focused on insurance innovation. The accelerator brought together startups from Iowa, Nebraska, California, Germany and Brazil, for 100 days of fast-paced business development, and mentoring.  The initiative was launched in February.

global insuranceIowa Governor Terry Branstad provided opening remarks at Wednesday’s session, followed by Malloy’s keynote address.  Branstad, a Republican, and Malloy, a Democrat, were re-elected by voters in their respective states last fall.

The 2014 Connecticut Insurance Market Brief reports that Connecticut ranks #1 in the U.S. for insurance carrier employment as a percentage of total employment, #1 in the U.S. for insurance payroll as a percentage of total payroll (5.6 percent) and that one new job in the insurance industry results in 1.73 additional jobs to the Connecticut economy.  The insurance sector accounts for 5.7 percent of Connecticut’s Gross State Product, ranking #2 in the U.S. as a percentage per capita. CT map insurance

A 2012 report by the Connecticut Insurance and Financial Services (IFS) Cluster and PwC US indicated that an increase of $1 in insurance labor income puts an additional $0.78 into state commerce; and every year the insurance industry purchases an average of $2 billion in goods and services from other industries in Connecticut.

The Iowa Economic Development Authority reports that “Iowa’s insurance industry grew by 11 percent during the past 15 years, while industry throughout the entire U.S. was flat.”  The agency indicates that while Iowa has 1.6 percent of the nation’s finance and insurance jobs, it generates 2.9 percent of the nation’s insurance GDP.

FIT01_InsuranceLocationMap

In a op-ed co-authored by the two Governors and published in 2012 by the Connecticut Post, Malloy and Branstad pointed out that “in Connecticut and Iowa, the multibillion-dollar insurance industry remains one of the essential anchors for sustained prosperity and quality of life. Both states are among the top four in the nation for the share of insurance and financial services jobs when compared to the entire workforce. In addition, the U.S. insurance industry is a titan in the world marketplace, accounting for nearly 34 percent of the worldwide market share.”

“Unique and fundamentally stable, insurance would top the list of industries for any governor to nurture and grow in his or her state,” the states’ chief elected officials noted. “The industry attracts a well-educated, well-paid work force of actuaries, financial analysts, attorneys, certified accountants and skilled support staff.”

The text of remarks by Branstad and Malloy at the Global Insurance Symposium were not immediately available, but The Hartford Courant reported that Malloy advocated continued state regulation of the industry, rather than an increased federal regulatory scheme.  "Our states, our commissioners and our governors need to be more actively involved if we are going to protect our industry as we know it, and not be dictated to, not simply by people in Washington but people abroad as well," the Courant quoted Malloy as stridently urging those gathered for the symposium.

https://youtu.be/R_aApLrqy5o

https://youtu.be/CmDCxvRIC3I

Connecticut Ranks #39 Among States for Retirement; Lowest In New England

Connecticut, ranking 39th overall and lowest among the six New England states, came away with a mixed bag of results on a list of the “Best and Worst Places to Retire,” compiled by the financial data website bankrate.com and published this week. The good news:  Connecticut ranked #6 in crime rate, the state’s highest ranking among the six categories included in the survey, and just outside the top ten at #12 for health care quality.  Undeterred by the challenging February weather this year, Connecticut ranked #14 for weather among the nation’s 50 states.  Not so good – Connecticut ranked near the bottom, at #48, in cost of living, and at the middle-of-the-pack, at #24, for community well-being.

The survey of around 1,000 adults in the U.S. questioned what Americans' priorities are when it comes to retirement. Nearly a quarter of those surveyed said being close to family was the deciding factor. But when it came to climate, while around a quarter prefer being close to a beach, nearly 40 percent of people want access to the great outdoors, rivers and mountains, according to published reports highlighting the survey results.retrirement

The top 10 states were Wyoming, Colorado, Utah, Idaho, Virginia, Iowa, Montana, South Dakota, Arizona and Nebraska.  The highest ranked New England states were Maine at #12, Vermont at #15 and New Hampshire at #16.  Massachusetts came in at #18 on the list, and Rhode Island was just ahead of Connecticut at #38.

By category, Minnesota topped the list in health care quality, Hawaii was #1 in community well-being, New Mexico was #1 in weather, and Mississippi (which ranked #36 overall) had the lowest cost of living.   Vermont had the lowest crime rate and Wyoming the lowest tax rate.

Bankrate provided the following breakdown of the origin of the data used in compiling the rankings:  The cost-of-living data was provided by the Council for Community and Economic Research, a Virginia-based group that tracks retail prices in more than 300 communities around the country. Crime statistics include property and violent crimes reported by police departments to the FBI.senior man

Health care quality scores come from the Agency for Healthcare Research and Quality, a federal office that measures each state's performance on about 160 different health-related issues. The National Oceanic and Atmospheric Administration provided weather data, including readings on temperature, humidity and sunshine. The "well-being" scores for seniors were from Healthways, a research group that works with the Gallup polling service to survey the public about their happiness and general satisfaction with their surroundings.

There are worse places than Connecticut to retire, according to the survey.  Among them:  Oklahoma, Oregon, Missouri, Kentucky, Louisiana, West Virginia, Alaska, and Arkansas, as well as New York and New Jersey.  Hawaii also ranked in the bottom 10, largely due to its highest-in-the-nation cost of living.

More US Cities Seek to Join Stamford in Commitment to Energy, Water Usage Reductions in Commercial Buildings

Efforts are underway this year for seven additional cities, from Albuquerque to Ann Arbor, to follow Stamford and seven others across the nation, in making a long-term commitment to reduce energy and water consumption in commercial buildings and reduce emissions from transportation, while increasing competitiveness in the business environment and owners' returns on investment. The “2030 District” initiative began with Seattle in 2011, grew by two cities in 2012, to four in 2013, and then to eight in 2014 when Stamford joined Seattle, Pittsburgh, Cleveland, Los Angeles, Denver, Dallas, and San Francisco as a 2030 District.  Now working towards the designation, in addition to Albuquerque and Ann Arbor, are Detroit, San Antonio, Ithaca, Toronto and Portland.Stamford---Website

Across the United States and Canada, 2030 Districts are forming with greater frequency to meet incremental energy, water and vehicle emissions reduction targets for existing buildings and new construction called for by Architecture 2030 in the 2030 Challenge for Planning.  Districts are generally private/public partnerships that commit to dramatic reductions in water consumption and energy and greenhouse gas (GHG) emissions, as well as adaptation and resiliency actions that address projected climatic impacts.

The Stamford 2030 District – launched this past  November - is an interdisciplinary public-private-nonprofit collaborative working to create a groundbreaking high performance building district in downtown Stamford.  Leading the way in the Stamford 2030 District are the Business Council of Fairfield County and Connecticut Fund for the Environment. As Stamford is a coastal city, its 2030 District will also implement a proactive vision to ensure resiliency against projected sea-level rise and storm surge.

The Stamford 2030 District – the first in New England - began with 23 founding members, including 11 property owners and 12 prominent professional and community stakeholders committed to meeting the 2030 Districts goals and targets. High performance buildings have proven track records of simultaneously increasing business and property profitability, reducing environmental impacts, and improving occupant health.Stamford

Now in the process of assessing the District’s current building performance levels, one-on-one assistance is provided to property owners and managers in benchmarking their buildings.  In addition, a first-time webinar will be held this week, on Wednesday, February 18, with several founding members highlighting best practices and procedures:

  • Jay Black of SL Green Realty/Reckson Properties will offer industry perspective through his experience with benchmarking buildings in both NY and CT.
  • WegoWise will present an overview of their web-based software that is able to benchmark a portfolio and provide deeper analytics into a buildings’ energy performance to find savings opportunities.
  • Steven Winter and Associates will demonstrate how to take benchmarking a step further with tools such as building energy audits to help identify opportunities within the building.
  • New Neighborhoods, Inc. will serve as a case study project in Stamford that has contracted with WegoWise for their benchmarking and will share their experience.

Officials indicate that District Members develop realistic, measurable, and innovative strategies to assist district property owners, managers, and tenants in meeting aggressive goals that keep properties and businesses competitive while operating buildings more efficiently, reducing costs, and reducing the environmental impacts of facility construction, operation, and maintenance.

Stamford2030boundary“These collective efforts will establish the Stamford 2030 District as an example of a financially viable, sustainability focused, multi-sector driven effort that maximizes profitability and prosperity for all involved. Through collaboration of diverse stakeholders, leveraging existing and developing new incentives and financing mechanisms, and creating and sharing joint resources, the Stamford 2030 District will prove the business case for healthy and high performing buildings.”

Property owners and managers are voluntarily committing their properties to Stamford 2030 District goals; they are not required to achieve the District goals through legislative mandates or as individuals.

“Stamford is already a business leader in Connecticut. The Stamford 2030 District will make the city a sustainability leader nationwide,” said Megan Saunders, Executive Director of the Stamford 2030 District. With over 170 million square feet of commercial building space (including 6 million thus far in Stamford), 2030 Districts are rapidly emerging as a new model for urban sustainability, officials indicate.

The Stamford 2030 District provides members a roadmap and the support they need to own, manage, and develop high performance buildings by leveraging Community and Professional Stakeholders, market resources, and by creating new tools, partnerships, and opportunities to overcome current market barriers. This type of collaborative action is not only a strategic undertaking to keep Stamford competitive in the year 2030, but also represents a major investment in Stamford's future and reflects the collaborative nature of our region.

New Interactive Tool Brings Focus to Cuts in State Funding of Children's Programs

If a picture is worth a thousand words, the impact of a series of interactive data visualization graphs must be, well, off the charts.  For Connecticut Voices for Children, the new online, interactive visualization tool has been designed to help the public and policymakers see how funding for children's programming in Connecticut has fallen through the years.  Coming on the brink of a new legislative session and an ever-tightening state budget, the hope is that more widespread understanding of  past trends will forestall further cuts. logo.inddThe new interactive tool, on the Connecticut Voices for Children website, enables visitors to track spending across nearly 100 children’s programs over 25 years.  Over the last two decades, spending on children’s programs has declined from 40% to 30% of the state budget, according to the advocacy organization.  Had the state not changed its budgeting priorities, it would have invested about $1.5 billion more each year in children’s programs—enough, for instance, to be the first state to implement a universal early care and education system, Voices points out.Picture1

The new interactive tool, created by Connecticut Voices for Children, enables users to create their own graphs of state budget trends and then embed the charts in social media, blog posts, news articles, and reports. Users, for instance, can compare the dip in state support for K-12 education to the even steeper drop in support for higher education.

Detailed budget visualizations for Fiscal Years 1990 through 2015 are available for the following areas:

  • The overall Children's Budget (at right)
  • Early Care and Education
  • K-12 Education investments
  • Children's Health and Human Services
  • Debt and Fringe Benefits

In producing this resource, Connecticut Voices for Children seeks to draw attention to what they describe as "Connecticut’s long-term disinvestment in young people – a trend that is particularly troubling in a state with an aging and shrinking workforce that will result in an increasing demand for well educated, career ready young adults."

Regarding K-12 education, for example, the website points out "K-12 Education has declined substantially as a share of the General Fund since the early 1990s, from about one fifth to one seventh in the most recent budget. This decline is seen most clearly in Educational Equalization Grants, the state's main contribution to local school districts. State support for K-12 education in Connecticut is among the lowest of any state in the union. In Connecticut, we leave the large majority of education expenses up to towns, which have no major revenue source except the property tax, thus contributing to the state's high and inequitable property taxes."

The information used in creating the graphs is official appropriations data from the Connecticut legislature's non-partisan Office of Fiscal Analysis.

Connecticut Voices for Children's mission is to promote the well-being of all of Connecticut's children and families by identifying and advocating for strategic public investments and wise public policies. Connecticut Voices advances its mission through high quality research and analysis, policy development, strategic communications, and establishment of a sustainable and powerful voice for children.


Whittlesey & Hadley Joins BlumShapiro Among Nation’s Top 200 CPA Firms

Whittlesey & Hadley, P.C., one of the area's largest regional accounting firms, ranks #192 in the Inside Public Accounting (IPA) fifth annual ranking of the Top 200 public accounting firms in the United States.  It is the firms’ debut appearance on the industry ranking list. West Hartford-based BlumShapiro was the highest ranked Connecticut headquartered public accounting firm, ranking at #56, up from #68 a year ago.  BlumShapiro and Whittlesey & Hadley are the only Connecticut-based firms among the top 200.2014 inside

Inside Public Accounting (IPA), founded in 1987, is published by The Platt Group. The Platt Group publishes both the award-winning Inside Public Accounting newsletter and the award-winning National Benchmarking Report.

The top 10 firms – ranked by U.S. net revenue - include some well-known national names, and large regional firms not well known by businesses and consumers outside their regions.  The top 10 are:  Deloitte, PwC, Ernst & Young, KPMG, McGladrey, Grant Thornton, BDO USA, Crow Horwath, CliftonLarsonAllen, and CBIZ  & Mayer Hoffman McCan.  CohnReznick, which has a footprint in Connecticut (including a recent consolidation of suburban offices in downtown Hartford) ranked at #11.

Whittlesey & Hadley’s managing partner, Drew Andrews says, “We are pleased to see our firm join this prestigious list of growing CPA firms in the United States. This ranking represents our strategic plan to expand our professional services and talented team throughout the northeast.”

BlumShapiro was also named among the fifty “Best of the Best” by the publication, a category described as firms that “show strong growth and profitability, and rank high on numerous key metrics, they also demonstrate an enviable culture. These Best of the Best firms are at the top of their game.”accounting

“We are honored to be recognized for this prestigious award,” said Carl Johnson, BlumShapiro Firm Managing Partner.  “To be distinguished as one of the best firms … is a testament to the teamwork, leadership and vision of all employees at BlumShapiro,” said Johnson. BlumShapiro is the largest regional accounting, tax and business consulting firm based in New England, with offices in Connecticut, Massachusetts and Rhode Island.

According to the publication, net revenue at Whittlesey & Hadley grew by 7.9 percent from the previous year; at BlumShapiro up 6.5 percent.

whittlesey
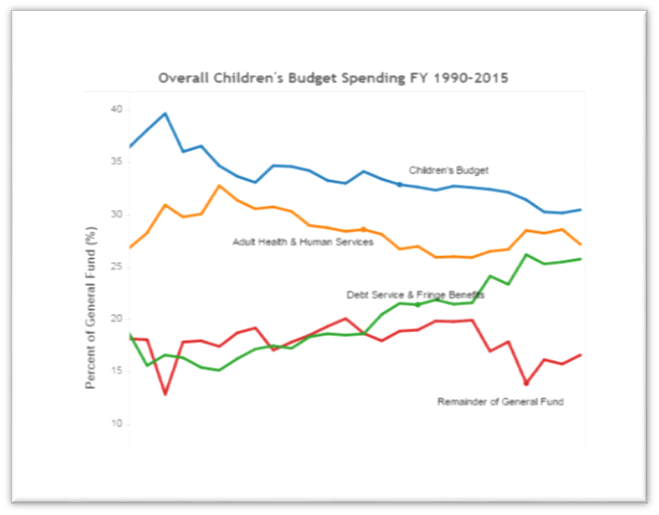
“With more than 540 firms participating in the IPA annual Survey and Analysis of Firms this year, along with many CPA firm associations contributing to the search to identify the IPA 200, this (is) the definitive ranking of the nation’s largest public accounting firms,” said Kelly Platt, principal of The Platt Group, the publisher of IPA.

Ablumshapiromong the industry trends cited by the publication are tighter margins, leadership changes, globalization, new regulations, acquisition pressures, evolving technology, cultural shifts, fierce competition, and commoditization of services (firms struggling to differentiate in the marketplace).

Three firms earned positions in the Top 100 for the first time, and 12 firms – including Hartford’s Whittlesey & Hadley – debut on the Top 200 list.

Other industry trends, as highlighted by Inside Public Accounting:

  • Cultural shifts – Younger employees often have different motivations and expectations than their elders at the firm. Up-and-comers who have “the right stuff” aren’t willing to wait the traditional 12 to 15 years to become partner and will challenge the firm to re-think normal career paths.
  • Lack of diversity among partners – The ever-diversifying population – in age, ethnicity, language and gender – is not reflected in the makeup of the owners of accounting firms and change is glacially slow.
  • Work environment challenges – Technology makes it possible for professionals to work anytime, anywhere. Balancing the needs of the individual with the needs of the firm, colleagues and clients can be tricky.

The IPA 200 are also engaged in acquisitions to grow in size, scope and capability, with 21 mergers reported for the group last year, adding more than 200 staff and more than $22 million into the aggregate numbers of the group.


CT’s 40 Fastest Growing Tech Companies Achieve Statewide Recognition

Connecticut’s fasted growing technology companies will be the center of attention Thursday evening as the Connecticut Technology Council (CTC) and Marcum LLP spotlight the 2014 Marcum Tech Top 40. Now in its 7th year, the annual list features privately and publicly held companies, including some newcomers to the top 40. The 2014 winners are predominantly privately held companies, but 12 public companies also made the list, including Rogers Corporation, Gartner Inc. and Alexion Pharmaceuticals. That’s a slight drop from a year ago, when 14 public companies made the list.

Geographically, Fairfield County is home to 16 winning companies this year, followed by Hartford County and New Haven County, both with ten companies. For Fairfield and New Haven counties, the count increased by two businesses from a year ago; for Hartford County, the number was unchanged from last year. top 40 logo

The selected companies have at least $3 million in annual revenue and a demonstrated record of growth in each of the preceding four years.  Four of the businesses have over $1 billion in revenue.

The Marcum Tech Top 40 recognizes technology leaders in six industry sectors, including Advanced Manufacturing, Energy/Environmental, Life Sciences, New Media/Internet/Telecom, IT Services, and Software. This year’s winners range from newcomer VRSim, Inc., a creator of virtual reality training tools for industrial and manufacturing applications, to Priceline.com, a leader in mobile travel.

Bruce Carlson, CTC’s President and CEO added, “Connecticut is proud of its remarkable heritage of innovation and invention. Job growth in Connecticut is going to come from the technology sector and these Tech Top 40 companies are a great example of the range of technology companies that are growing substantially in Connecticut.”

Among the names on this year’s list:  Frontier Communications, based in Stamford, providing communications services to residential and business customers across the country (in the news this year for the proposed purchase of AT&T’s business in Connecticut); and Bolt Technology Corporation, based in Norwalk, the leading worldwide developer and manufacturer of seismic energy sources, synchronizers and underwater connectors used in offshore seismic exploration for oil and gas; and Fitlinxx, based in Shelton,  an industry leading provider of wellness applications, wireless activity monitors, and health tracking devices that motivate people to live active and healthy lifestyles.

The city with the largest number of companies on the Top 40 list this year is Stamford, with six, followed by Norwalk with four, Shelton with three, and Wallingford, South Windsor, Simsbury and New Haven, each with two businesses on the list.  Other towns with a top 40 high tech busineconnecticut-technology-councilss are Torrington, Danbury, West Hartford, Cheshire, Guilford, Greenwich, Plainville, Middlebury, New London, Killingly, Middletown, Fairfield, Madison, Branford, Farmington, Glastonbury, Windsor, Orange and East Hartford.

“Technology companies have a set of shared challenges that range from capital-raising and complex revenue reporting to intellectual property management and international expansion.  Whether they are private enterprises or Fortune 500 companies, this year’s Marcum Tech Top 40 winners all demonstrate management excellence and market foresight,” said Alex Discepolo, a Tax Partner in Marcum’s New Haven office and Practice Leader of the Firm’s High Technology Services Group.

The October 2 awards program, being held at the Oakdale Theater in Wallingford, will include an exhibition featuring the Marcum Tech Top 40 companies. Six category winners will be announced, and one company will be named overall winner for demonstrating the greatest percentage growth in revenue across all the technology verticals.

The Connecticut Technology Council is a statewide association of technology oriented companies and institutions, providing leadership in areas of policy advocacy, community building and assistance for growing companies. Speaking for 2,500 companies that employ some 200,000 residents, the Connecticut Technology Council seeks to provide a strong and urgent voice in support of the creation of a culture of innovation.

 The Tech Top 40:

Advanced Manufacturing

  • APS Technology Inc – Wallingford
  • Bolt Technology Corporation – Norwalk
  • Dymax Corporation – Torrington
  • Revolution Lighting Technologies Inc. – Stamford
  • Rogers Corporation – Rogers six categories

Energy/Environmental/Green Technology

  • FuelCell Energy, Inc – Danbury
  • Proton OnSite – Wallingford

 IT Services

  • Cervalis LLC – Shelton
  • Datto Inc. – Norwalk
  • Gartner Inc. – Stamford
  • Information Services Group Inc. – Stamford
  • IT direct, LLC. – West Hartford
  • VLink Inc. – South Windsor

Life Sciences

  • Alexion Pharmaceuticals, Inc. – Cheshire
  • Bio-Med Devices, Inc. – Guilford
  • Metrum Research Group LLC. – Tariffville

 New Media/Internet/Telecom

  • Chief Executive Group – Greenwich
  • EasySeat, LLC – Plainville
  • Frontier Communications – Stamford
  • HealthPlanOne LLC – Shelton
  • iSend, LLC – Middlebury
  • Job Target, LLC – New London
  • M2 Media Group – Stamford
  • Priceline.com, Inc. – Norwalk
  • Reality Interactive, LLC. – Middletown
  • TVEyes Inc. – Fairfield

Software

  • Clarity Software Solutions, Inc. – Madison
  • Core Informatics, LLC – Branford
  • Evariant, Inc. – Farmington
  • Evolution1, Inc. – Simsbury
  • Fitlinxx, Inc. – Shelton
  • Higher One, Inc. – New Haven
  • KenCast, Inc. – Norwalk
  • Link Systems Inc. – Stamford
  • Shoptech Corporation – Glastonbury
  • Square 9 Softworks Inc. – New Haven
  • SS&C Technologies Holdings Inc. – Windsor
  • Tangoe Inc. – Orange
  • TicketNetwork - South Windsor
  • VRSim, Inc. – East Hartford

CT Women Underrepresented Among Top Earners; 4th Widest Gap in US

In only three states in the nation are women more underrepresented among the top 1 percent of wage owners, when compared with the state’s overall female population. Connecticut ranks 4th – after South Dakota, New Hampshire and Wyoming – in underrepresentation of women among the top earners in the state. Connecticut has a ratio of 6 men for every woman in the state’s top 1 percent of wage earners. South Dakota has the widest gap and largest ratio, at 8.2.

In Connecticut, 51.3 percent of the state’s population is female, yet only 14.4 percent of the top 1 percent of wage earners in the state are women. That is a gap of 36.9 percent, ranking the state fouTheOnePercentrth.  In Wyoming the gap is 37.1 percent, in New Hampshire 38.6 percent, and in South Dakota, 39 percent. In South Dakota, with the widest gap, only 10.9 percent of the wage earners in the top one percent are women.

On the other end of the spectrum, the gap in Delaware is 10.6 percent, in Hawaii 16.8 percent, Rhode Island 17.8 percent and Vermont 21.7 percent. The ratio of males to females among the top one percent earners is 1.4 in Delaware, 2.0 in Hawaii, 1.9 in Rhode Island and 2.5 in Vermont, compared with Connecticut’s 6.0.

Bloomberg ranked the U.S. states and the District of Columbia on the extent to which females are underrepresented in the 1% income bracket, utilizing U.S. Census data.

Connecticut also had the nation’s second highest threshold income to gain entry into the one percent club, at $429,793. Only Alaska, at $500,052 was higher. Just slightly lower than Connecticut was the District of Columbia, New York, New Jersey, North Dakota and Minnesota ($387, 414). At the opposite end of the states tally was Wyoming, with an income of $244,207 placing individuals in the state’s top one percent of earners.

In the percentage of women in the overall population, Connecticut ranked 10th, at 51.3 percent. Only 10 states have more men than women in their population. Alaska has the highest percentage of men, at 52.1, and the District of Columbia the highest percentage of women, at 52.7. Following closely behind are Rhode Island and Mississippi, both with 51.7 percent of their population being female.

Using data from the U.S. Census, Bloomberg calculated the approximate 99th percentile, or top 1%, of inflation-adjusted wage or salary income figures for those ages 16 and older and employed. Gender information was extracted and the gap between the percentage of females in the 1% bracket and the percentage of females in the state's population was calculated.

CT’s 4th Congressional District Ranks #5 in US for Income Inequality

Connecticut’s 4th Congressional district, centered in Fairfield Country, has been ranked as the district with the 5th highest level income inequity in the nation. A ranking of congressional districts of by their level of income inequality, conducted by Bloomberg, uses the Gini coefficient, a formula that measures the distribution of income across a population. The closer a Gini number is to 1, the greater the level of inequality; the closer to zero, the closer to perfect equality.

Generally, the Bloomberg Businessweek website points out, the U.S. congressional districts with the most inequality share certain traits: “they contain a small, enormously wealthy elite surrounded by impoverished neighbors.” Most of the districts with the greatest disparity are located in or near major urban metropolitan aRich-vs-poor-directionsreas such as New York, Philadelphia, Chicago, Boston, Atlanta, and Washington.
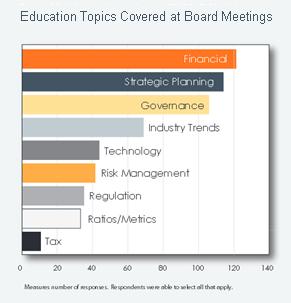
The congressional district where inequality is highest turns out to be New York’s 10th, with a Gini coefficient of .587; followed by Pennsylvania’s 2nd District, at .583; Illinois’ 7th District, at .574, and Florida’s 27th District at .562. Connecticut’s 4th District is next, at .561, followed by New York’s 12th District, Ohio’s 11th District, Georgia’s 8th District and New York’s 16th District. The most equal district is Virginia’s 11th, at .385.

"The big take-away," according to Bloomberg Businessweek: “A strikingly high level of inequality exists throughout the United States.” Also of note, 9 of the top 10 districts with the greatest income inequality are currently represented in Congress by Democrats, including Connecticut’s Jim Himes, Georgia’s John Lewis, Washington D.C.’s Eleanor Holmes Norton, and New York’s Jerrold Nadler, Carolyn Maloney and Eliot Engel.

Breaking down the state’s population into five segments, by income, Connecticut ranked 10th in the share of household income among the lowest income quintile, 5th in the second quintile, 4th in the third quintile, 5th in the fourth quintile at and 4th in the highest-income quintile.

The website takes the state-by-state comparison one step further, providing context by comparing the state data with data compiled by the Central Intelligence Agency, which tracks the Gini coefficient of 139 countries.

“What jumps out,” according to the website report on the data analysis, “is how lousy the United States looks. Our best district in terms of equality (VA-11) is only as good as Portugal, which sits at a pedestrian 71st on the CIA’s list, right in the middle of the pack. That means that the level of equality in every congressional district in America falls below the midpoint of the CIA’s 139-country ranking.”

“Even the best U.S. district has higher inequality than any number of countries you probably don’t associate with economic egalitarianism: Greece, Niger, Ethiopia, Egypt, Pakistan, Kosovo, Mongolia, Ukraine, Bangladesh. The most equal U.S. congressional district can’t compare with the national averages of New Zealand, France, Canada, Netherlands, Australia, Switzerland, Belgium, Germany, and Austria. Most districts in the U.S. (those ranked 39th through 429th) fall in a narrow Gini band between .4 and .499, putting them between Zimbabwe (20th on the CIA list) and the United Kingdom (60th).”

In 2013, a person living alone making less than $11,490 was classified as in poverty. The threshold increased by $4,020 for each additional household member.

Nonprofit Governance Has Room for Improvement, Survey Finds

The 4.9% rise in charitable giving in 2013 is the largest gain since 2008, and comes at a time when greater attention is being paid by philanthropic donors and regulators to the governance practices of non-profit organizations. The CohnReznick 2014 Not-for-Profit Governance Survey reflects some progress as well as areas for improvement by nonprofits on a range of governance measures. The members of CohnReznick’s Not-for-Profit and Education Practice specialize in working closely with the boards and management of not-for-profit organizations to assist them in developing and implementing best-practices for their critical financial and operational functions. “Now more than ever,” the report indicates, “our clients are asking us questions about policies and procedures relating to audit committee governance and risk detection and minimization strategies.”

Key findings in the national survey included:

  • 58% of respondent organizations stated that they have an audit committee that is separate and apart from their finance topics coveredcommittee
  • 54% of respondents stated that their audit committees have between four and six members
  • 27% of the respondents stated that their organizations have a whistleblower hotline
  • 68% of respondents stated that their annual board meetings contain an educational component
  • 82% of responding organizations have a whistleblower policy in place.
  • 42%, stated that they do not have an audit committee that’s separate and apart from a finance committee.

When identifying conflicts of interest, the survey found that 77% of the respondent organizations have an annual disclosure statement in place.

The survey also found that 68% of the nonprofit organizations include an educational component to their board meetings and place a strong emphasis on financial, strategic planning, and governance. Other areas receiving attention at board meetings include industry trends, technology, risk management, regulation and tax issues.

According report coverto the National Center for Charitable Statistics (NCCS), there are more than1.4 million not-for-profit organizations registered in the U.S. This includes almost one million public charities, over 96,000 private foundations, and more than360,000 other types of not-for-profit organizations, including chambers of commerce, fraternal organizations, and civic leagues.

The survey found that less than 50 percent of boards noted that they are “very confident” in their organization’s governance practices. With the addition of new laws and regulations surrounding the industry, “this lack of confidence can give rise to much larger issues hesitation,” the report concluded. According to Forbes, charitable giving rose 4.9% in 2013, the largest increase in five years. This rise indicates “a renewed attention for not-for-profit organizations, which can also lead to renewed scrutiny.”

Knowledge of the intricacies of regulations and the effects that it will have on the governance practices of not-for-profit organizations is crucial to the success of affected organizations, the reported pointed out.

With origins dating back to 1919, CohnReznick LLP is the 10th largest accounting, tax, and advisory firm in the United States. Headquartered in New York City, CohnReznick serves its clients with more than 280 partners, 2,500 employees, and 26 offices – including Farmington, Glastonbury and New London in Connecticut, with plans for newly consolidated offices in downtown Hartford.

The consolidation of the two suburban offices in Glastonbury and Farmington is expected to relocate nearly 200 employees into Hartford later this year. The company plans to lease 50,000 square feet on the top two floors of the Metro Center building on Church Street.

Serious Health Issues Faced by State's Asian Pacific American Residents, New Study Reveals

Stereotypes about a thriving and problem-free Asian Pacific population in Connecticut are just plain wrong, according to a new statewide Needs Assessment Study which reveals “high rates of physical and mental health problems” and serious concerns about access to proper food and healthcare, often exacerbated by communication breakdowns  and language barriers." The 21-page study, by the Connecticut Asian Pacific American Affairs Commission, is said to be the first of its kind in Connecticut.  The 2010 U.S. Census reported APA’s as one of the fastest growing minority populations, growing from 2.4 percent of Connecticut’s population in 2000 to 4.4 percent by 2010. The Census projects a steady increase of the APA population through 2050.

The Needs Assessment was developed in collaboration with three community-based organizations: the Khmer Health Advocates, Lao Association of Connecticut aapacc_logo5-300x151nd Connecticut Coalition of Mutual Assistance Associations. The project was also supported by the Asian American Studies Institute at UConn, the UConn School of Pharmacy and the UConn School of Social Work. It focused on housing, education, language access, employment, access to public resources, and medical and mental health.

More than 300 Southeast Asian Connecticut residents – all over age 18 - participated in the study, include just over one hundred from each of three ethnic groups: Cambodian, Lao, and Vietnamese. The study found clear distinctions between the populations in Connecticut, and researchers stressed that viewing the Asian Pacific American (APA) population in the state as one block of people does a disservice to them, and does not adequately respond to their needs.

Food Insecurity

Food insecurity was a “prominent problem,” according to the report. “Close to half reported that they often or sometimes couldn’t afford to eat balanced meals and 43 percent indicated that their food supplies ran out The survey also reviewed “several measures of food insecurity” and found “significant association” between the ethnic groups and “finding it too expensive to have a balanced meal often or sometimes,” as well as “going hungry for lack of sufficient money for food.”

The report also indicated that “all of the ethnic groups reported concern that some members of their community were socially isolated. In particular, they reported that those age 50 and older were most at risk for isolation.”

capitolHealthcare Concerns

Regarding healthcare, “nearly half experienced at least some difficulty in getting the healthcare they believed they needed,” the report indicated. In addition, “more than half of all participants reported experiencing a language barrier with their physician, and for those that needed an interpreter, 59 percent indicated that a professional interpreter was never or rarely available for healthcare visits.”

In regards to Southeast Asian Refugees, the report noted "chronic mental and physical health conditions follwoing a history of severe trauma," adding that "it is vital that primary care physicians and others treating these individuals screen for a wide range of physical health conditions as well as PTSD and depression."  At a State Capitol news conference releasing the report, Dr. Megan Berthold, Assistant Professor in the UConn School of Social Work, said that there is an "urgent need" to address these concerns, adding that the lack of communication can be "dangerous" and could "lead to misdiagnosis."

Among those who received prescriptions, nearly one-third said they did not fill it due to the expense, and among all surveyed, 17 percent “did not see a doctor when they felt they need to” during the past year due to the high cost.

Among the ethnic differences, a greater number of Vietnamese are smokers, Cambodians were “significantly more likely to be diagnosed with PTSD and depression,” and the Lao community indicating the least frequency of language barriers with physicians. Overall, however, the report indicated that “these communities continue to be underserved due to the limited to no resources available to focus on the cultural and linguistic needs of their communities.”

Numerous Recommendations

Included in the recommendations, the study report states that “service providers, state agencies and stakeholders are encouraged to partner with APA communities” in multiple ways, and calls for additional research that “can advance the needs of the APA population.” The series of 14 recommendations include greater training anreportd education, promoting preventative care, actively recruiting APA members in various professional fields, creating diversity in the workforce, translating materials into the most common APA languages, and raising awareness among the APA population regarding their rights.

It is hoped that Needs Assessment studies can focus on other APA ethnic groups, such as the Indian and Chinese communities, in future years. The APA population in Connecticut includes approximately 50 ethnic groups, sharing some similarities and having great diversity. As the initial study demonstrated, specific needs may vary – an important fact for policy makers and those working with this fast-growing aspect of the state’s population.

Among those commenting on the report during the news conference were Secretary of the State Denise Merrill, who was instrumental in the establishment of the Commission when she was House Majority Leader in the legislature, Marie Spivey, Chair of the State Commission on Health Equity, Tanya Hughes, Executive Director of the state's Commission on Human Rights and Opportunities, and Dr. William Howe, Chair of the Asian Pacific American Affairs Commission (see photo, at left). Theanvy Kuoch, Executive Directo of Khmer Health Advocates, noted that "working together we can improve outcomes for our community members while engaging them in their own care.  We have evidence that this approach also saves health care dollars."

The Asian Pacific American Affairs Commission was created in 2008 by an act of the Connecticut legislature.  The 21 member bipartisan commission oversees matters concerning hte Asian Pacific American population in Connecticut, and makes recommendations to the General Assembly and the Governor on the health, safety, education ,economic self-sufficiency and efforts to remain free of discrimination within the APA population in the state.