Summer Sandwiches: Lobster Roll is Connecticut Standout, Zagat Says

When Zagat’s decided to take a bite into the uniqueness of sandwiches during August (It is national sandwich month! Who knew?) – highlighting particularly noteworthy culinary endeavors in every state in the nation – the focus in Connecticut landed squarely on the lobster roll. Their review of “delicious regional sandwiches” found in each state had some overlap (Maine was also noted for its Lobster Roll, for example) and some regional favorites with a national following. And some surprises (see bison, reindeer, and marshmallow, below). zagat_logo

“While many consider the cold, mayonnaise-driven Maine lobster roll to be the quintessential version of the sandwich, the first lobster roll was actually a hot, buttered one served at a restaurant called Perry’s in Milford, Connecticut, in the 1920s,” Zagat’s explained. “This version is usually simpler, featuring just lobster meat, butter, and maybe some black pepper or lemon juice on a grilled, split-top hot dog bun, and served with potato chips or French fries. “

Cited by the Zagat surveyhotlob600 was Abbott’s Lobster in the Rough in Noank, founded in 1947. “They take the simplicity of the Connecticut-style hot lobster roll and turn it into an art form. Their award-winning sandwich is made with a full quarter-pound of lobster meat (more than is found in the average small lobster) drenched in melted creamery butter and heaped onto a bun. It’s a sandwich so opulent, it’s well worth the trip to this far-off-the-beaten-path lobster pound to get one (not to mention the crowds you have to battle to order).”

Noteworthy in the region were the Italian Sub in New Jersey and the Italian Grinder in Rhode Island. (A distinction without a difference?) In Massachusetts, the Zagat selection was the Fluffernutter: “The delectable marshmallow fluff was in fact invented in Somerville, Massachusetts, in 1917. A man named Archibald Query sold it door-to-door before he sold the recipe, though who it is that thought to pair it with peanut butter on white bread is not as clear. Nevertheless, the fluff is celebrated to this day with a Fluff Festival in Somerville” in September.

New Hampshire was noted for its “Beer-Battered Fish Sandwich” and Vermont for the aptly-named Vermonter, a “ sweet-and-savory sandwich that typically includes either turkey or ham (sometimes both), sharp Vermont cheddar cheese, thinly-sliced green apples and honey mustard, although there are many different variations (including a decent number that come with cranberry mayonnaise instead of honey mustard).”

In case you were wondering, in Alaska it is the Reindeer Sausage Sandwich, in Wyoming the Bison Reuben, in Alabama the Chicken Sandwich with White Sauce, and in Arkansas the Fried Bologna Sandwich, and Mississippi the Elvis sandwich (peanut butter, fried banana and bacon). The Zagat’s  reporting (and tasting) was conducted for the August 2013 observance of National Sandwich Month, with a tip of the plate to the notable Earl of Sandwich.

CT Ranks 4th in Participation in Summer Meal Programs for Low-Income Children

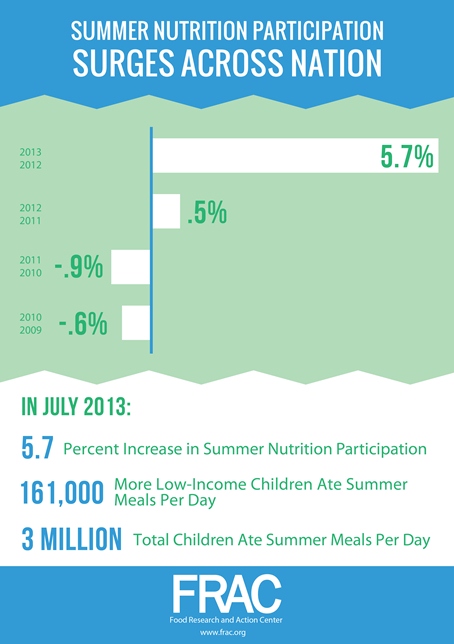
Participation in Summer Meal Programs for low-income children increased in Connecticut in 2013 as compared with the previous summer, with 26.4 percent of low-income children receiving summer meals on an average day in July 2013. This represents an increase of 2.4 percent from the previous summer and ranks CT 4th in the nation for participation. summerfoodwebbutton2012The numbers are increasing nationally as well as in Connecticut. In 2013, for the first time in a decade, the number of low-income children eating summer meals saw a substantial increase year-over-year, according to a report by the Food Research and Action Center (FRAC). Nearly three million children participated in the Summer Nutrition Programs in July 2013, an increase of 161,000 children, or 5.7 percent, from July 2012.

FRAC measures the success of Summer Nutrition Programs at the national and state levels by comparing the number of children receiving summer meals to the number of low-income children receiving school lunch during the regular school year. The programs grew to serve 15.1 children for every 100 low-income children who participated in school lunch during the 2012-2013 school year, a modest increase from the 14.3 per 100 served in the 2011-2012 school year.

Print

End Hunger Connecticut! noted that summer meals in Connecticut still only reached 26.4 students for every 100 low-income children who received regular school year school meals in the 2012-2013 school year. The number of sites increased slightly, from 217 to 236.

“When the school year ends, millions of low-income children lose access to school meals, including about 147,587 in Connecticut. It is in Connecticut’s best interest to ensure that such children have adequate nutrition during the summer so they stay healthy, active and return to school in the fall ready to learn,” Lucy Nolan, Executive Director, End Hunger Connecticut!, said. “While we are extremely proud of our place nationally, we still have a lot of work to do.”

Ranked just above Connecticut in participation were the District of Columbia, New Mexico and New York. Rounding out the top 10 were Vermont, Arkansas, Idaho, Delaware, Maine and Massachusetts.

To further increase the number of Connecticut children who participate in summer meals programs, End Hunger Connecticut! convened partners, community leaders and volunteers to distribute multilingual flyers, posters and other promotional materials at the start of the summer to promote Connecticut’s federally funded free summer meals program.

This year marks the third consecutive year that End Hunger Connecticut! has coordinated ‘blitz days’ in communities across the state to drive summer meals participation. Results of the initiative will be known later this year.

Increasing participation means more nutritious food for hungry children, but it also means more federal funding for communities, officials noted. If every state had reached the goal of 40 children participating in Summer Nutrition in July 2013 for every 100 receiving free or reduced-price lunch during the 2012-2013 school year, an additional 4.8 million children would have been fed each day, and states would have collected an additional $365 million in child nutrition funding in July alone, they point out.

FRAC reportThe Summer Nutrition Programs, which include the Summer Food Service Program and the National School Lunch Program, are designed to fill the food gap for the thousands of low-income Connecticut children who rely on school breakfast and lunch during the school year. These programs provide free meals at participating summer sites at schools, parks, other public agencies, and nonprofits for children under 18.

Connecticut families can find nearby summer meal sites at www.ctsummermeals.org, by calling toll free2-1-1 or by texting ‘CTMeals’ to 877-877.These tools are instrumental for families to find the closest free meals in their communities.

FRAC measures national summer participation during the month of July, when typically all children are out of school throughout the month and lose access to regular school year meals. The national report, including Connecticut data, is available online at www.frac.org

CT Slips from #18 to #21 in State Bikeability Comparison

Connecticut has dropped from 18th to 21st in the rankings of the bicycle-friendliest states, according to the League of American Bicyclists 2014 survey. Every year, the League ranks all 50 states on their bikeability, based on a mutli-faceted Bicycle Friendly State℠ questionnaire. They look at five categories: Legislation & Enforcement, Policies & Programs, Infrastructure & Funding, Education & Encouragement, and Evaluation & Planning.

Overall, the state received 40 out of 100 points, slightly less that the 40.9 earned a year ago, when Connecticut ranked 18th.

On aBFA_SurveyButton_0 1 to 5 scale, with 5 being the highest grade, Connecticut received a 4 in legislation & enforcement, 3 in policies & programs, 3 in education & encouragement, and a 1 in infrastructure & funding.

The top-ranked states were Washington, Minnesota, Wisconsin, Delaware, Oregon, Colorado, Maryland, Utah and California.  Connecticut, ranked 21st, was between Idaho and Tennessee. The top state in New England for bicyclists was Massachusetts, ranked 10th, according to the survey.bike to work

The survey highlights "10 signs of success" in analyzing each of the states.  Connecticut currently has 6 of the 10 in place, according to the survey report:  an active state advocacy group, Complete Streets policy, state bicycle plan, bicycle safety emphasis in the strategic highway safety plan, bicycle education for police, and a safe passing/vulnerable user law.

The Bicycle Friendly State℠ program is designed to establish best practices in states across the program.  In the 2014 survey, the least bicycle-friendly states were Alabama, Montana, and Kentucky.

The League, established in 1880, represents bicyclists in the movement to create
 safer roads, stronger communities, and a bicycle-friendly America. Through information, advocacy and promotion, the organization works to celebrate and preserve the freedom cycling brings to members everywhere.


CT Ranks in Top 10 for Lowest Total Carbon Emissions, Lowest Per Capita Emissions

Connecticut ranks in the top 10 among the states in both the lowest total state energy related carbon dioxide emissions and emissions per capita.  The state ranked second, tied with California and just behind New York, in the lowest emissions levels per capita.  In total state energy related emissions, Connecticut placed in a tie for tenth place. Greenhouse gas emissions for all sources were considered in compiling the data, according to Bloomberg.com, which published the rankings last month, based on 2011 U.S. Census population estimates and statistics from the U.S. Energy Information Administration.  Sources of emission include electric power production, industries, residential heating and transportation.

The lowest state emission levels per capita, in metric tons of carbon dioxide, are New York (8.1), Connecticut (9.2), California (9.2), Oregon (9.3), Vermont (9.6), Massachusetts (10.0), Washington (10.1), Idaho (10.1), Rhode Island (10.5) and Maryland (11.0).  The highest levels per capita were in Wyoming (112.6), North Dakota (79), Alaska (52.7) and West Virginia (51.7).

In total state energy related carbon dioxide emissions, by million metric tons, the states with the lowest emission levels are Vermont (6), Rhode Island (11), Delaware (12), South Dakota (14), New Hampshire (16), Idaho (16), Maine (17), Hawaii (19), Montana (32), Connecticut (33) and Nevada (33).

The states with the highest emission levels were Texas (656 metric tons), California (346), and Pennsylvania (245).


carbon emissions

Connecticut Agriculture Growth Gains National Attention

Connecticut may be the third smallest state in the nation, but it has a large agricultural presence - which led to the state being featured recently by the U.S. Department of Agriculture (USDA) on the federal agency’s website. Bucking the national trend, USDA reports, Connecticut farming has been growing for the past two decades. The state - based on the 2012 Census of Agriculture - has nearly 6,000 farms, which is a remarkable 60 percent increase from the 3,754 farms in Connecticut in 1982. At the same time, the state’s farmland acreage remained relatively stable, which means that the size of an average farm has been trending down, to an average of 73 acres.farming in CT

More than 900 Connecticut farms harvested vegetables for sale in 2012, with bell peppers being the most popular crop. To meet the needs of East Coast homeowners and landscapers, in 2012, 880 of Connecticut's nurseries, greenhouses, floriculture and sod farms grew and sold almost $253 million worth of those crops.

In addition, Connecticut’s coastal area has hosted shellfish farms since Colonial times. In 2012, the state’s aquaculture industry sold nearly $20 million worth of seafood, primarily shellfish from Long Island Sound. There is livestock as well, USDA notes, with 774 farms in Connecticut raising cattle and calves. Most of the sales on the livestock end come from milk, however. In 2012, the state’s farms sold nearly $70 million worth of milk from cows.

Contrary to history and stereotype, in 2012 more than 25 percent of all Connecticut farms were operated by women as principal operators. That is an incremental increase from 23 percent in 2007. Overall, the 2012 Census counted more than 3,700 women farmers in the state.

Connecticut farmers have also stepped up their efforts to get agricultural products into consumers’ hands, the USDA report indicated. With the growing “buy local” movement, nearly a quarter of Connecticut farms market human food products directly to consumers. About 10 percent of the farms in the state now market their products directly to retail outlets such as restaurants, stores, and institutions; and at the same time, 218 of our farms participate in community-supported agriculture programs allowing local residents to partake in their harvest.ct_grown_local_flavor

Although the USDA did not specifically mention the longstanding “Connecticut Grows” campaign from the state’s Department of Agriculture, it has served as a lynchpin for intensified efforts using technology.

The CT Grown Program was developed in 1986, during the administration of former Gov. William A. O’Neill, when the now-familiar green and blue logo was created to identify agricultural products grown in the state. During nearly three decades, the CT Grown Program has blossomed into a multifaceted campaign that promotes these products through a diverse array of avenues in local, regional, national and international markets.

It now features CT Grown producer listings and brochures, connections to farmers markets, the CT Seafood Council, CT Farm Wine Development Council, CT Food Policy Council, CT Milk Promotions Board, and other related councils and commissions.

More recently, the website www.buyctgrown.com was established as “a place to connect people who are ready to discover CT Grown foods and experience Connecticut agriculture.” buyCTgrown is a program of the non-profit CitySeed and receives support from our partners including UConn Extension, CT Farm Bureau, CT NOFA, and the CT Department of Agriculture. Logo_Pledge10_Partner

The website’s “CT 10% Campaign” asks people to spend 10 percent of their existing food and gardening dollars on locally grown goods.” Individuals and businesses can sign up to “take the pledge” on the website, and will receive ongoing information about locally grown products.

Report Calls for Transition to Livable Communities Across Connecticut

In Connecticut, more than one-third of the population is over the age of 50, and that proportion continues to increase. Connecticut’s Legislative Commission on Aging has issued “Connecticut for Lireport covervable Communities,” a new report to the state legislature which outlines more than 50 recommendations for communities looking to enhance livability. The Commission has also launched a website which includes a list of communities that are responding to the call for more livable communities, and suggests a wide range of actions that communities can take.

Connecticut is undergoing a permanent and historic transformation in its demographics, the report points out. Between 2010 and 2040, Connecticut’s population of people age 65 and older is projected to grow by 57 pelivability chartrcent, with less than 2 percent growth for people age 20 to 64 during the same period.

Livable communities are vibrant, inter-generational places that are easy to get around, according to the report. “They include affordable, appropriate housing options, supportive community features and services, and adequate mobility options. They foster independence, engage residents in civic and social life, and allow people to age in place. Done well, they benefit community residents across the lifespan.”

The 50-page report indicates that residents born in Connecticut today can expect to live to be 80.8 years old - the third highest life expectancy in the nation. A lengthy series of recommendations are highlighted in seven different areas: community engagement, health and well-being, housing, planning and zoning, safety and preparedness, social and support services, and transportation.

The recommendations include promoting opportunities for intergenerational collaboration, promoting in-home programs that improve health outcomes, creating a balanced transportation system that connects residents with health care services, and adopting policies that encourage incorporation of accessible housing features into new construction. The recommendations also include a call for municipal plans of conservation and development that include planning for older adults and individuals with disabilities to remain in their homes and communities, and building compact, mixed-use development “to encourage walking and eyes on the street.”

Creating livability requires “robust partnerships, long-range planning and sustained commitment.” To support those efforts the Legislative Commission on Aging plans to be:

  • Providing educational opportunities on livable communities for community leaders and other partners in Connecticut;
  • Creating partnerships to support the multi-faceted, multi-disciplinary endeavor of creating livable communities;
  • Supporting, inspiring and incentivizing communities to enhance livability; and developing policies to support aging in place

To help communities implement the recommendations over time, the Commission plans to:

  • Recognize localities that have implemented livable communities initiatives, pursuant to Public Act 14-73 (which established the livable communities initiative)
  • Expand partnerships across multiple sectors to advance livability, logo
  • Continue to convene municipal leaders, legislators and other thought leaders for statewide and regional forums on creating livability;
  • Continue to identify funding opportunities for municipal leaders, seeking to implement or sustain livable communities initiatives;
  • Work with partners to conduct asset mapping across all Connecticut communities, with the goal of helping each community understand its facilitators and barriers to developing livable communities;
  • Continue to research models in other states, nationally and internationally;
  • Work with the Connecticut General Assembly to identify and advance policy solutions that incentivize and inspire the creation of livable communities;
  • Provide technical assistance to Connecticut communities seeking to enhance or promote livability; and
  • Create town-specific data profiles to enable towns to enhance livability in a targeted and strategic fashion.

Among the communities listed on the new website as having best practices in place in parts of their towns or cities are Branford, Guilford, Madison, Bridgeport, Danbury, Darien, Enfield, Hartford, Middletown, New Haven, New Canaan, Norwalk, Seymour, and Torrington.  The Commission plans to proceed with "asset mapping across all Connecticut communities" and "continue to identify innovations, ideas, and best practices for implementing livability in the state. "

Simsbury, New Haven, New Britain Top Bike- and Walk-Friendly Towns in State

As part of a new "complete streets" initiative that began earlier this year, Bike Walk Connecticut has developed a first-of-its-kind ranking of the state's cities and towns on how bike- and walk-friendly they are. The results paint a varied picture of smaller communities and major cities taking effective steps to earn the designation bike- and walk- friendly. Connecticut’s top ten include: Simsbury (1), New Haven (2), New Britain (3), Glastonbury (4), Middletown (5), Canton (6), Weston (7), Hamden (8), Plainville (9) and South Windsor (10). city_biking_sign

The scorecard and rankings of the most bike- and walk-friendly communities are based on an online, statewide public opinion survey that ran this spring and was open to anyone who lives or works in Connecticut.

The rankings are also based on municipal leadership and engagement efforts -- whether cities or towns have bicycle and pedestrian master plans; citizen task forces or advisory groups; complete streets policies; and whether they have conducted any public outreach efforts related to cycling, walking or complete streets.

Plans are for the surveys and scorecard to be conducted annually as part of Bike Walk Connecticut's new five-year initiative to make it safer and estreetsasier to walk and bike by implementing "complete streets" in cities and towns across Connecticut. Complete streets make it easier and safer for people to get around on foot or by bike, in order to become more physically active.

"We want this project to encourage cities and towns to take a really robust approach to complete streets and being bike- and walk-friendly,” said Kelly Kennedy, Executive Director of Bike Walk Connecticut. “Being able to get around safely by bike or on foot isn't just a fad or a health issue or environmental issue. It's an economic development issue.”

Rounding osimsburyut the top 25 towns in Connecticut in the survey were 11. Coventry, 12. Torrington, 13. Meriden, Milford, 15. Hartford, Manchester, 17. Stonington, 18. Old Saybrook, 19. Southbury, 20. Colchester, Somers.

Bike Walk Connecticut has also started to develop an online repository for complete streets resources. The entire project is made possible through the financial support of the Connecticut Department of Public Health through Cooperative Agreement 1305 from the Centers for Disease Control and Prevention (CDC), the purpose of which is to promote statewide implementation of policies and actions to promote health and prevent and control chronic diseases.

Serious Health Issues Faced by State's Asian Pacific American Residents, New Study Reveals

Stereotypes about a thriving and problem-free Asian Pacific population in Connecticut are just plain wrong, according to a new statewide Needs Assessment Study which reveals “high rates of physical and mental health problems” and serious concerns about access to proper food and healthcare, often exacerbated by communication breakdowns  and language barriers." The 21-page study, by the Connecticut Asian Pacific American Affairs Commission, is said to be the first of its kind in Connecticut.  The 2010 U.S. Census reported APA’s as one of the fastest growing minority populations, growing from 2.4 percent of Connecticut’s population in 2000 to 4.4 percent by 2010. The Census projects a steady increase of the APA population through 2050.

The Needs Assessment was developed in collaboration with three community-based organizations: the Khmer Health Advocates, Lao Association of Connecticut aapacc_logo5-300x151nd Connecticut Coalition of Mutual Assistance Associations. The project was also supported by the Asian American Studies Institute at UConn, the UConn School of Pharmacy and the UConn School of Social Work. It focused on housing, education, language access, employment, access to public resources, and medical and mental health.

More than 300 Southeast Asian Connecticut residents – all over age 18 - participated in the study, include just over one hundred from each of three ethnic groups: Cambodian, Lao, and Vietnamese. The study found clear distinctions between the populations in Connecticut, and researchers stressed that viewing the Asian Pacific American (APA) population in the state as one block of people does a disservice to them, and does not adequately respond to their needs.

Food Insecurity

Food insecurity was a “prominent problem,” according to the report. “Close to half reported that they often or sometimes couldn’t afford to eat balanced meals and 43 percent indicated that their food supplies ran out The survey also reviewed “several measures of food insecurity” and found “significant association” between the ethnic groups and “finding it too expensive to have a balanced meal often or sometimes,” as well as “going hungry for lack of sufficient money for food.”

The report also indicated that “all of the ethnic groups reported concern that some members of their community were socially isolated. In particular, they reported that those age 50 and older were most at risk for isolation.”

capitolHealthcare Concerns

Regarding healthcare, “nearly half experienced at least some difficulty in getting the healthcare they believed they needed,” the report indicated. In addition, “more than half of all participants reported experiencing a language barrier with their physician, and for those that needed an interpreter, 59 percent indicated that a professional interpreter was never or rarely available for healthcare visits.”

In regards to Southeast Asian Refugees, the report noted "chronic mental and physical health conditions follwoing a history of severe trauma," adding that "it is vital that primary care physicians and others treating these individuals screen for a wide range of physical health conditions as well as PTSD and depression."  At a State Capitol news conference releasing the report, Dr. Megan Berthold, Assistant Professor in the UConn School of Social Work, said that there is an "urgent need" to address these concerns, adding that the lack of communication can be "dangerous" and could "lead to misdiagnosis."

Among those who received prescriptions, nearly one-third said they did not fill it due to the expense, and among all surveyed, 17 percent “did not see a doctor when they felt they need to” during the past year due to the high cost.

Among the ethnic differences, a greater number of Vietnamese are smokers, Cambodians were “significantly more likely to be diagnosed with PTSD and depression,” and the Lao community indicating the least frequency of language barriers with physicians. Overall, however, the report indicated that “these communities continue to be underserved due to the limited to no resources available to focus on the cultural and linguistic needs of their communities.”

Numerous Recommendations

Included in the recommendations, the study report states that “service providers, state agencies and stakeholders are encouraged to partner with APA communities” in multiple ways, and calls for additional research that “can advance the needs of the APA population.” The series of 14 recommendations include greater training anreportd education, promoting preventative care, actively recruiting APA members in various professional fields, creating diversity in the workforce, translating materials into the most common APA languages, and raising awareness among the APA population regarding their rights.

It is hoped that Needs Assessment studies can focus on other APA ethnic groups, such as the Indian and Chinese communities, in future years. The APA population in Connecticut includes approximately 50 ethnic groups, sharing some similarities and having great diversity. As the initial study demonstrated, specific needs may vary – an important fact for policy makers and those working with this fast-growing aspect of the state’s population.

Among those commenting on the report during the news conference were Secretary of the State Denise Merrill, who was instrumental in the establishment of the Commission when she was House Majority Leader in the legislature, Marie Spivey, Chair of the State Commission on Health Equity, Tanya Hughes, Executive Director of the state's Commission on Human Rights and Opportunities, and Dr. William Howe, Chair of the Asian Pacific American Affairs Commission (see photo, at left). Theanvy Kuoch, Executive Directo of Khmer Health Advocates, noted that "working together we can improve outcomes for our community members while engaging them in their own care.  We have evidence that this approach also saves health care dollars."

The Asian Pacific American Affairs Commission was created in 2008 by an act of the Connecticut legislature.  The 21 member bipartisan commission oversees matters concerning hte Asian Pacific American population in Connecticut, and makes recommendations to the General Assembly and the Governor on the health, safety, education ,economic self-sufficiency and efforts to remain free of discrimination within the APA population in the state.

New CT Law Responds to Sudden Cardiac Arrest in Student Athletes As Debate Continues

Research shows that an EKG exam, coupled with a complete medical history, and a thorough physical exam is the best way to prevent sudden cardiac arrest. That statement, on the home page of the organization “Screen Across America,” is followed by this statistic: Cardiac arrest is the #1 cause of death of student athletes.” Screen Across America is a consortium of organizations that provide heart screenings to students. They have a presence in 26 states; Connecticut is not one of them. The organization “believes that this should be a standard of care because thousands of children die every year from sudden cardiac arrest.” New York, New Jersey, Massachusetts and Vermont are among the states with local organizations advocating for screening. Connecticut does have a chapter in the Sudden Cardiac Arrest Association (SCAA). The Naugatuck-based chapter raises funds to place Automated External Defibrillators in Connecticut schools. screen_across_america_iisymptons

A recent article in the Wall Street Journal highlighted the divided opinion among the medical community, as well as athletics departments, athletes and parents. The publication reported that “whether to screen young athletes’ hearts – as is done in nations such as Italy and Israel – represents one of the hottest debates in American cardiology.”

The article noted that opponents and proponents of screening each have medical studies backing up their positions, and that proponents were encouraged recently when the National Institutes of Health and the Centers for Disease Control and Prevention announced they would be creating a registry for studying sudden death among those 24 and younger.

Hartford Hospital’s chief of cardiology, Dr. Paul Thompson, told the WSJ that when a young athlete dies from hypertrophic cardiomyopathy (HCM), “it probably could hve been detected. But when a screen finds it in a young athlete without symptoms, we don’t know that it ever would have caused him problems. Meanwhile, he gest labeled a cardiac cripple for life.” you

The Screen Across America consortium does not have a particular organizational model across all locations. Each locale operates “independently of each other,” the website points out, with some being nonprofits and others for profits. “Some of us charge for heart screenings while others offer it free of charge. Our screening protocols may differ slightly. However, many of us have adopted the Seattle Criteria – a set of guidelines made by international experts in the field of sports cardiology,” the website explains.

Another organization advocating screening is “Parent Heart Watch,” which was founded in 2005, as was SCAA. It was started by four parents who each saw their child die from sudden cardiac arrest (SCA). The organization’s website says that “research has shown that SCA is the leading cause of death on school property with one student athlete falling victim to SCA every three to four days. Heart disease is the second leading cause of disease-related fatalities in youth according to the Centers for Disease Control and Prevention (CDC).” The organization also provides information on timely, effective medical responses to cardiac arrest.

According to the American Academy of Pediatrics, SCA takes the lives of thousands of children every year. The United States Centers for Disease Control and Prevention estimates at least 2,000 such deaths occur annually, according to the website of the Sudden Cardiac Arrest Foundation. During the 2014 Connecticut legislative session, a proposal that became Public Act 14-93 earlier this month was approved, which will direct the State Board of Education, in conjunction with health experts, to develop a sudden cardiac arrest awareness program for use by local boards of education. The program must include information on:

  • SCA warning signs and symptoms, including fainting, difficulty breathing, chest pain, dizziness and abnormal racing heart rate
  • Risks of continued athletic activity after exhibiting SCA symptoms
  • Means of obtaining treatment for a suspected occurrence of SCA
  • Proper methods for returning students who experience SCA to athletics.

It will also require school coaches to:

  • Review the SCA awareness program each school year, beginning in 2015
  • Immediately remove students from play who show symptoms of SCA
  • Not permit students removed from play to return without the written clearance of a licensed healthcare professional.

billIn addition, it calls for creation of a consent form for parents of student athletes to sign on the warning signs, symptoms and treatment of SCA and relevant school policies. Similar legislation has already been adopted in Pennsylvania, several other states are also considering SCA bills, according to the SCAF. The provisions of the new law take effect a year from now, with the school year that begins in the fall of 2015.

Connecticut’s legislation was inspired in part by the tragic story of Andy Peña, a Darien student athlete who died of sudden cardiac arrest in 2011, just one month away from turning 15. Andy’s parents, Victor and Giovanna, founded the Andy Smiles Forever Foundation in his memory, to educate the general public and support research on the causes and prevention of sudden cardiac death amongst youth, officials said.

http://www.youtube.com/watch?feature=player_embedded&v=hiheVyvFQiA


CT Ranks #12 in Meeting Long-Term Care Needs of Older Residents

When it comes to support for seniors and caregivers, it matters where you live – and Connecticut is better than most places. According to a new, comprehensive state-by-state Scorecard from AARP, Connecticut ranks 12th in the nation in meeting the long-term care needs of older residents and people with disabilities. Even with the solid showing, AARP officials stress that more needs to be done, especially as the state’s 50-plus population continues to grow. Specific areas cited include more support and training for family caregivers, and easing patient transitions to and from the hospital or a skilled nursing facility.

senior long term careRaising Expectations 2014: A State Scorecard on Long-Term Services and Supports for Older Adults, People with Physical Disabilities, and Family Caregivers – an update of the inaugural 2011 Scorecard – ranks each state overall and within 26 performance indicators along five key dimensions:

  • affordability and access;
  • choice of setting and provider;
  • quality of life and quality of care;
  • support for family caregivers; and,
  • effective transitions.

New indicators this year include length of stay in nursing homes and use of anti-psychotic drugs by nursing homes, raising serious concerns about the quality of institutional care. The Scorecard was complied by AARP with support from The Commonwealth Fund and SCAN Foundation.

According to the state Scorecard, a majority of family caregivers (59.4%) face a degree of stress and worry. In addition, Connecticut ranks last (51) when it comes to the percent of home health patients with a hospital admission. This signifies a need for more resources and training for family caregivers - especially around compCT rankingslex medical tasks – so that their loved ones don’t end up back in the hospital and can continue to live independently at home, according to AARP officials.

“The vast majority of older Connecticut residents want to live independently, at home, as they age – most with the help of unpaid family caregivers,” says Nora Duncan, state director of AARP Connecticut, which serves nearly 600,000 members age 50 and older in Connecticut.

Today, unpaid family caregivers provide the bulk of care for older Connecticut residents, in part because the cost of long-term care remains unaffordable for most middle income families. In Connecticut, it is estimated that more than 486,000 residents help their aging parents, spouses and other loved ones stay at home by providing assistance with bathing and dressing, transportation, finances, complex medical tasks like wound care and injections, and more.

long term scorecard“When it comes to helping older Connecticut residents live in the setting of their choice, this silent army of family caregivers assumes the lion’s share of responsibility,” explains Duncan. “Many juggle full-time jobs with their caregiving duties; others provide 24/7 care for their loved ones. With every task they undertake, these family caregivers save the state money by keeping their loved ones out of costly nursing homes – most often paid for by Medicaid. They have earned some basic support.”

The top 12 states overall are Minnesota, Washington, Oregon, Colorado, Alaska, Hawaii, Vermont, Wisconsin, California, Maine, District of Columbia, and Connecticut, which make up the top quartile among the states. At the bottom of the rankings are Tennessee, Mississippi, Alabama and Kentucky.

According to the Scorecard, Connecticut ranks 29th in the percent of Medicaid long-term care dollars that support care provided at home and in the community – the care setting that most residents prefer. The Scorecard spotlights specific areas that call for improvement, including:

  • Percent of home health patients with a hospital admission;
  • Percent of nursing home residents with low care needs;
  • Percent of people with 90+ day nursing home stays successfully transitioning back to the community.
  • Family caregivers without much worry or stress, enough time, well-rested;

Of the 26 Scorecard indicators, 13 may be improved through state policy changes, which officials say points to the importance of AARP’s multi-state advocacy campaign, launched this year, to help older Americans live independently, at home, and the family caregivers that support them. “Even facing tight budgets following the Great Recession, Connecticut is making clear progress to help our older residents. However, this Scorecard shows we have more to do – and with a predicted ‘silver tsunami’ sweeping over our state in the next 20 years, the time to act is now.”

The full state Scorecard, along with an interactive map of state rankings and information, is available at www.longtermscorecard.org.