Leadership Greater Hartford Launches New Brand Identity As 40th Anniversary Approaches
/Leadership Greater Hartford (LGH), the region's highly regarded go-to source for tackling community challenges through knowledge and cooperation, has unveiled its new logo and visual identity, which reflects the organization’s growth and prominent role in strengthening community leadership connections. Three pillars, “Community. Leadership. Connections,” informed the design of the organization’s new logo and form the backbone and structure of the new website, www.leadershipgh.org.
"We are proud of our past and look forward to the future. While our logo is changing, one thing that will never change is our purpose and 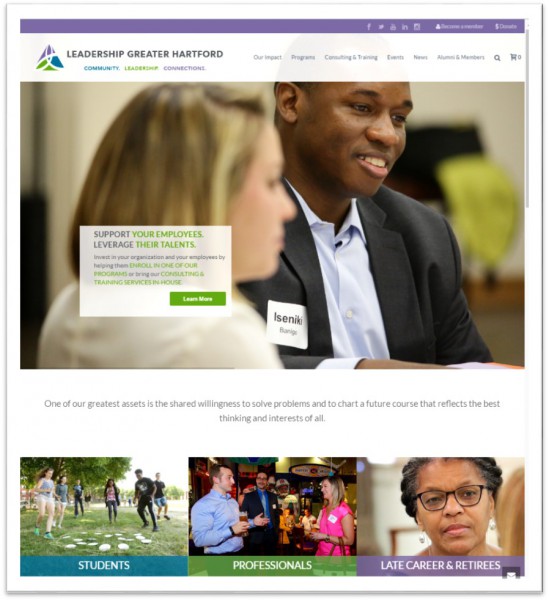 mission,” said Ted Carroll, President of Leadership Greater Hartford. “It is important that our brand reflect the organization we have become and where we will continue to be headed in the future - making our communities better and stronger.”
The website points out that “more than 600 employers have enriched the development of their staff and become involved with civic progress; 2500+ students from four dozen schools across the region have gained broader perspectives and wider circles of friends; more than 500 seniors gained the opportunity to continue giving back to the communities they’ve seen undergo so much change in their lifetimes.”
As Leadership Greater Hartford has grown and evolved, broadening participation and developing an array of effective programs and initiatives, the organization notes that the business landscape has changed, including in market demographics, competitive environment, and the acceleration of social media.
LGH will celebrate its 40th anniversary on November 15, with their annual Polaris Awards Gala. As the organization enters its milestone fortieth year, it is “well-prepared and firmly engaged to be a relevant, forward-thinking resource for the community – both the private and public sectors – for the next 40 years,” officials said, as the website highlights that “our program participants have completed more than 200 community impact projects, we have trained and placed more than 450 individuals on more than 125 nonprofit boards, and program graduates volunteer at a rate of 137% higher than that of the rest of the country.”
The web redesign and visual identity was developed by MRW Connected, Inc. “All of us at MRW Connected engaged with Leadership Greater Hartford in the exciting process of re-branding and re-messaging this important organization in their 40th anniversary year,” explained MRW Connected president and founder Tom Willits.![]()
Officials indicated that LGH staff, organization leadership and Board members, program participants as well as the Greater Hartford community, were involved in the process “to better understand their organizational objectives and accomplishments. In this way we helped Leadership Greater Hartford realize their goals of creating an updated look and responsive, engaging website that truly represents the inspired leadership development work they do and allows the community-at-large easier access to their programs and their network," Willits added.
Leadership Greater Hartford (LGH) is a mission-driven, nonprofit organization that supports and strengthens the local community by training and connecting aspiring and established leaders. The well-known LGH programs for professionals include Quest, Executive Orientation, Hartford Encounters, Leaders on Board and Summit. Encore Hartford and Third Age Initiative are aimed at late-career individuals and retirees; Common Ground, Leading Off Campus and Summer Nexus are designed for high school and college students.
For more information about how to be a participant or sponsor, or to inquire about customized training with Leadership Greater Hartford, call 860-951-6161 (x1800), email info@leadershipgh.org visit .leadershipgh.org, or follow LGH on Facebook and Twitter @leadershiphtfd.
 In addition to the expert panel on opioid abuse, there will be more than 30 presenters on public health topics, a presentation on the history of CPHA and public health in the
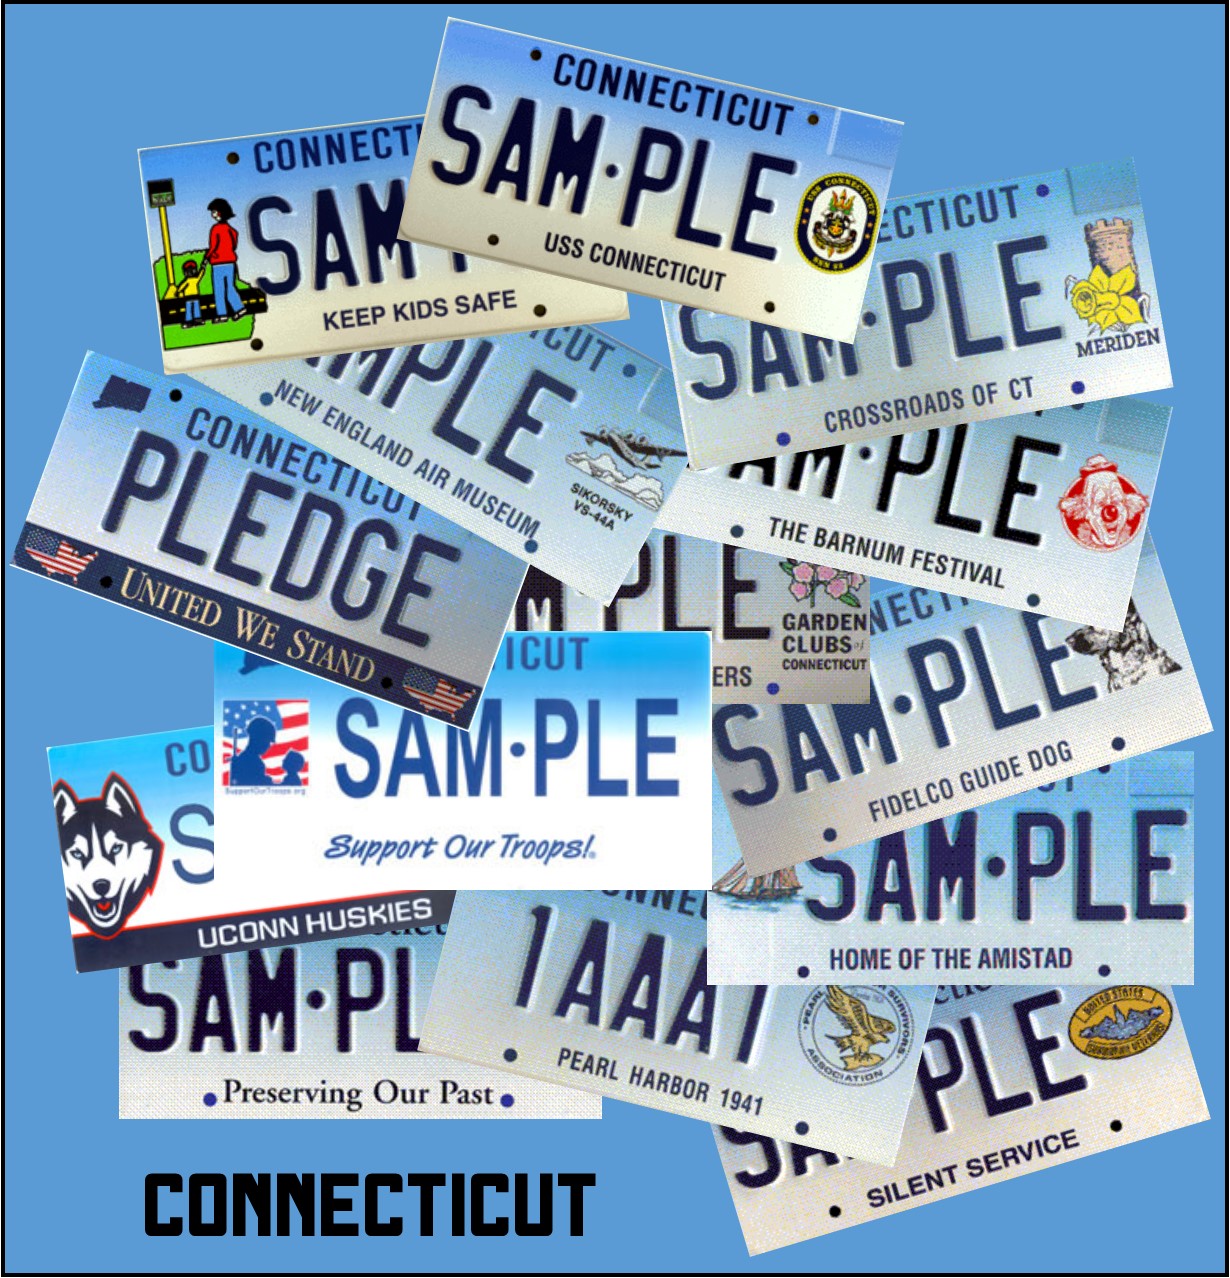
 When individuals purchase a Keep Kids Safe plate, a portion of the fee goes to the Keep Kids Safe Fund, which “makes many worthy projects happen for youngsters.” The fund awards grants to schools, hospitals, municipalities and other non-profit organizations working to make all Connecticut children safer from severe and preventable injuries, according to the DMV website.
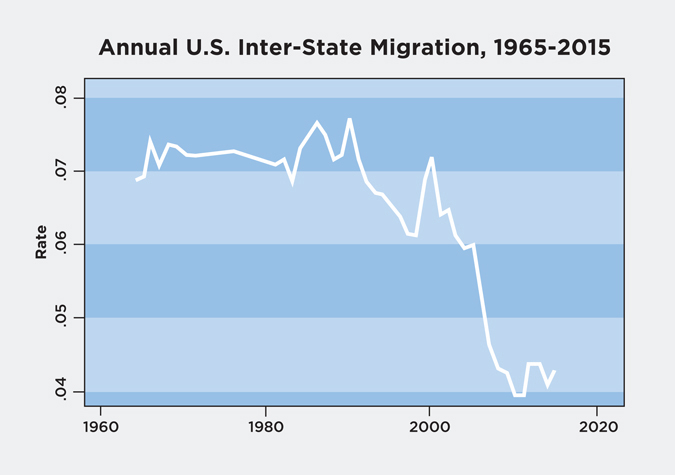
 Increasingly, residents believe that jobs are “very hard to get” in Connecticut compared with six months ago (from about one-quarter to one-third of those surveyed in Q2 2016 versus Q2 2015), and are, in growing numbers, saying they would rather leave than stay.
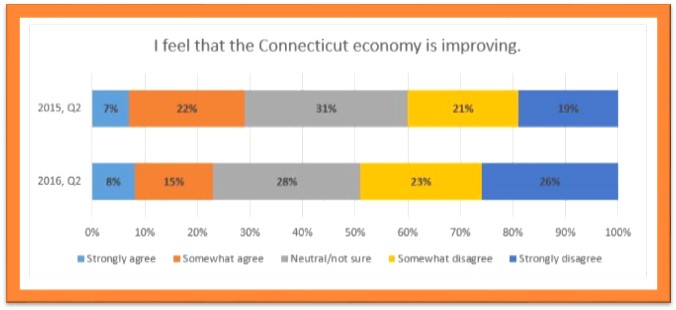 Forty-three percent, an increase from 40 percent in the year’s first quarter, answered “all of the above” when asked if education, libraries, public health, public safety and animal control could be provided regionally. Among those services individually, there was slightly greater support for a regional approach to public safety, slightly less for each of the others. The largest increase was for “all” of the services.
 The
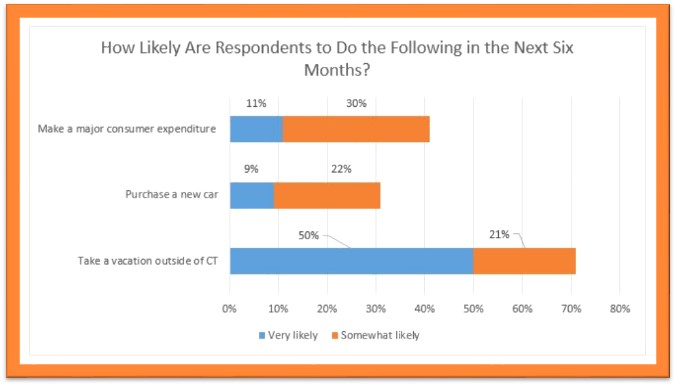
The  A minimum-wage worker in Connecticut would need to work full time for 36 weeks, or from January to September, just to pay for child care for one infant. And a typical child care worker in Connecticut would have to spend 63.6% of her earnings to put her own child in infant care, according to the data.


 Participating schools will be encouraged to take innovative approaches to teaching civics in the classroom and to consider involving extracurricular activities that promote civic and community engagement.
 Describing Hartford’s prominent manufacturing history, Hinz said “Hartford, CT, is a classic story in the history of American technology. If you have ever wondered why people refer to “Yankee ingenuity,” this is what they are talking about.” He adds, “In the mid and late 1800s, the United States overtakes Great Britain as the world’s foremost economic superpower, largely on the strength of its prowess in inventing and manufacturing new technologies. Hartford is at the center of that revolution.”
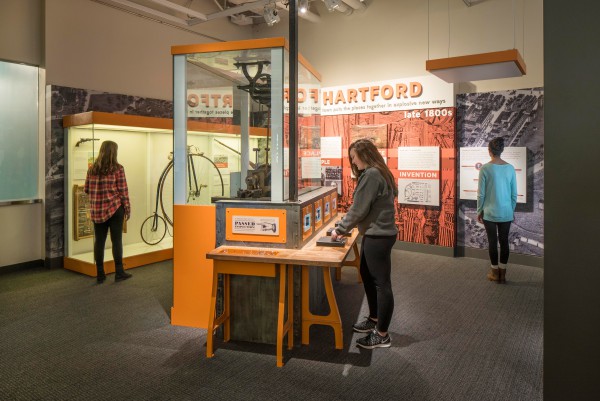 The exhibit notes that by the 1850’s “Hartford became the center of production for a wide array of products—including firearms by Colt, Richard Gatling and John Browning; Weed sewing machines; Royal and Underwood typewriters; Columbia bicycles; and even Pope automobiles.”
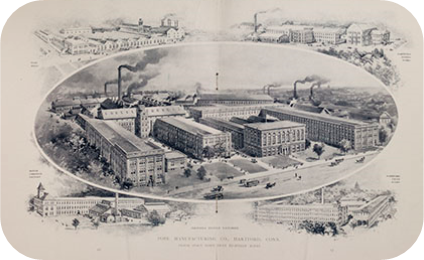 rode his high-wheeler from the station down Capitol Avenue to the Weed Sewing Machine Company.’”
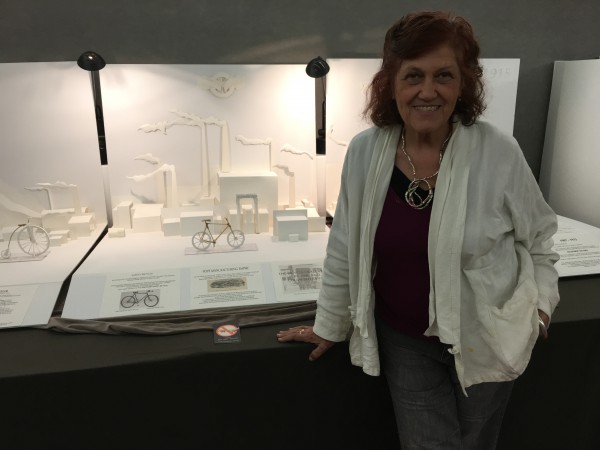 Jeanne Manzelli, a resident of Windsor, has a
 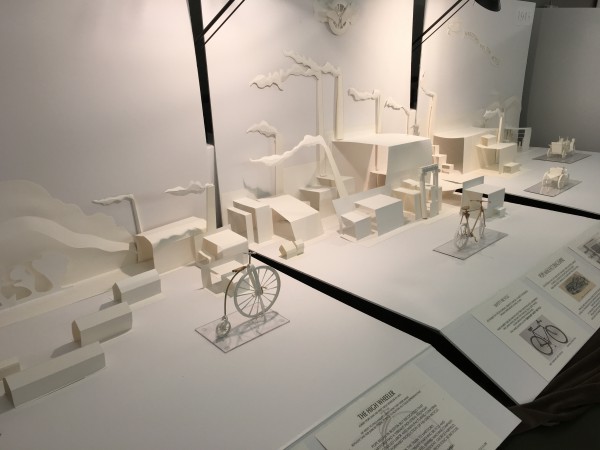 BFA in Sculpture from the Massachusetts College of Art and her MED in Art Education from the University of Massachusetts, Amherst. Her experience includes a 20 year career in design, manufacture, appraisal and sale of jewelry, two decades as mural artist working closely with interior designers as an industry professional, and 14 years teaching basic and advanced drawing, sculpture and 3D design as well as color theory at Tunxis Community College.
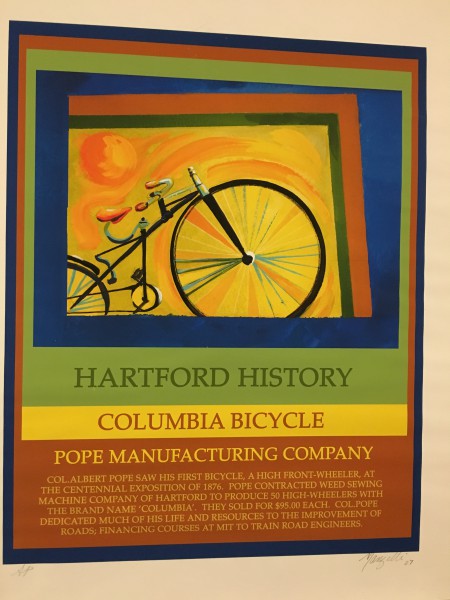

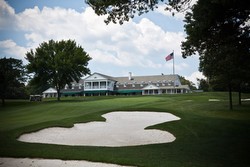 Des Moines Golf and Country Club was the site of the 1999 U.S. Senior Open Championship which drew a record 252,800 spectators.
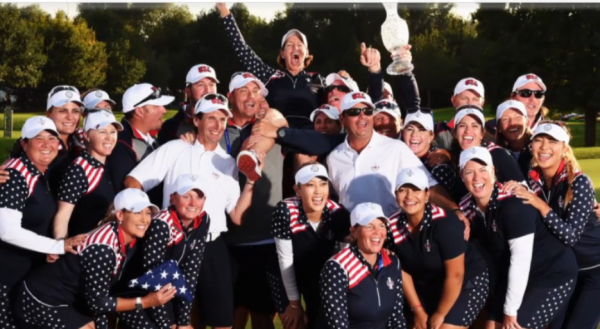


 The analysis points out that the type of land in a given area has a significant impact on its worth. Agricultural and other largely undeveloped areas are generally worth significantly less than cities and suburbs land. Developed land, or land where housing, roads, and other structures are located, is valued at an estimated $106,000 per acre, while undeveloped land was estimated at $6,500 per acre, and farmland at only $2,000 per acre, according to the analysis.