CT Ranks #30 in Motorcycles Per Capita; Helmets Not Required

Which states have the most motorcycles per capita?  The top three are South Dakota, New Hampshire (Live Free or Die!) and Iowa. Connecticut – the Land of Steady Habits – rides in at number 30 among the states.

South Dakota comes in first with 12 people for every motorcycle, besting the national average by 66 percent, according to data compiled by the website The Motley Fool.  The state had 69,284 motorcycles registered, repmotorcycle-300x185resenting 0.82 percent of all motorcycles in America. South Dakota is home of the annual Sturgis Motorcycle Rally, which attracted 467,338 riders in 2013.  

According to the most recent report by the U.S. Department of Transportation, there were 8,410,255 motorcycles registered nationwide by private citizens and commercial organizations, according to the most recent annual data, from 2011. That represents one motorcycle owner out of every 36 people.30

Connecticut ranked #30 on the list of states, with 97,960 motorcycles, representing 36 people for every motorcycle.  Reaching the top fifteen states were New Hampshire, Iowa, Wisconsin, Wyoming, North Dakota, Vermont, Montana, Minnesota, Alaska, Idaho, Maine, New Jersey Colorado and Delaware.

New Hampshire placed second with 17 peomotorcycles
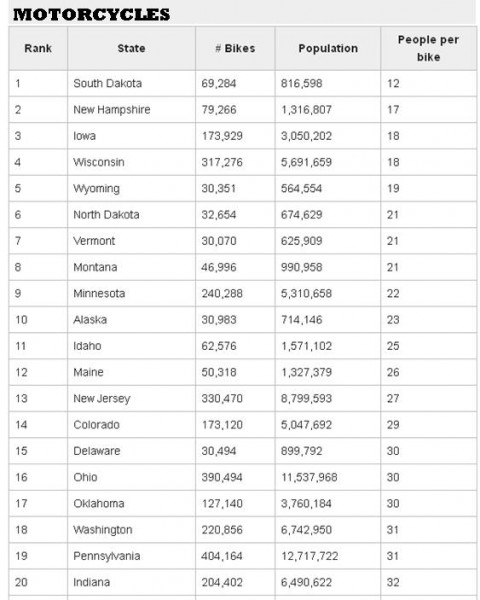
ple for every motorcycle beating the national average by 53 percent.  The state had 79,266 motorcycles registered, representing 0.94 percent of all motorcycles in America,.    The state is also home to Laconia Motorcycle Week, which dates back to the early 1900s and is one of the country’s oldest rallies.

New Hampshire also is one of 31 states without a mandatory helmet law. In Connecticut, motorcycle operators between 16 and 17 years old must wear a helmet. Drivers over 18 are required to wear a helmet if they only have a motorcycle permit, and not a motorcycle license. Drivers of all ages must wear protective eyewear, such as goggles or glasses, unless the cycle is equipped with a windshield.

States with the least motorcycles per capita are Mississippi, Louisiana, Texas, New York, Georgia, Maryland, Utah and California. 

The state with the most motorcycles is California with 801,803, followed by Florida, with 574,176, Texas with 438,551, Pennsylvania with 404,164, Ohio with 390,494,  New York with 345,816 and  New Jersey with 330,470.

Currently, about half the states require helmets for all motorcyclists, according to the Governor’s Highway Safety Administration.  As outlined above, boost other states require helmets for certain riders, and a few have no helmet law.

  • 47 states and the District of Columbia have a helmet law effecting at least some motorcyclists.
    • 19 states and the District of Columbia have a universal helmet law, requiring helmets for all riders.
    • 28 states require helmets for specific riders.
  • 3 states (Illinois, Iowa and New Hampshire) do not have a motorcycle helmet law.

In 1967, the federal government required states to enact universal motorcycle helmet laws to qualify for certain highway safety funds, the website noted.. By 1975, all but three had complied. In 1976, Congress revoked federal authority to assess penalties for noncompliance, and states began to weaken helmet laws to apply only to young or novice riders.

Passenger Traffic Gaining Altitude At Bradley - Gradually

Flying high?  Well, sort of.  Bradley International Airport reports an increase of 1 percent in passenger counts for 2013, including four consecutive months of growth at the end of the year.

The Connecticut Airport Authority assumed oversight of Bradley in July from the state Department of Transportation.  That effectuating Gov. Malloy’s proposal, approved by the state legislature two years ago, for a new quasi-state agency that would be more responsive to market opportunities and less grounded in the state’s bureaucratic procedures.

The numbers increased 1 percent in September, 4 percent in October, 3 percent in November, and a lofty 20 percent in December, the Hartford Business Journal reported.  The overall count of passengers getting on and off planes at Bradley was 5,421,875 in 2013, compared to 5,381,860 in 2012.

Looking slightlBradleyy farther back, in 2009 the total was 5,334,322.  The Bradley International Airport Strategic Plan for 2010-2013, prepared in 2009, anticipated 6,545,000 enplanements and deplanements in 2013 – about 125,000 more that the actual totals.  At that time, an annual average growth rate of 6.2 percent was projected.  The same report called for additional growth in passengers of 3.4 percent annually for 2013 – 2018.  The projections were provided in the InterVISTAS report, Bradley International Air Traffic Forecasts – Final Report, dated April 25, 2010.

So much for predictions.

Bradley continued its end-of-year growth pattern at the start of 2014, with passenger counts increasing 9 percent in January.  There is, however, a long way to go to achieve the numbers projected years ago, which are necessary to come within range of what’s needed to bring plans for a new terminal off the drawing boards and into construction.

Earlier this year, it was reported that if passenger counts increase as currently projected, and other conditions are realized, construction of a new Terminal B would tentatively begin in just under a decade, in 2022. The entire complex, with the additional new terminal, would be up and running by about 2024 at the earliest.  Picture2

Before that threshold is reached – which remains uncertain – plans are to proceed with roadway realignment, scheduled to start in late 2015 or early 2016, with completion in late 2017 or early 2018.  That would include a rotary to be built where the Route 20 connector, off Interstate 91 Exit 40, to the garage’s exit road, and a new access road to a newly constructed transportation center.

The elevated road in front of Terminal A just past the Sheraton would remain, then all upper level traffic would be diverted to the lower level. The elevated roadway in front of Terminal B will be demolished.

That would make space for a new ground transportation center, which is expected to have a rental car facility, about 800 public parking spaces and a transit center with curbside services for limousines, taxis, and buses.  Just about anyone driving past the old, rusting and vacant terminal eagerly anticipates its demolition, as much as the array of new services that are planned to replace it.

Fifth Time A Charm? Vulnerable User Bill Back Before Legislature

“Study after study reveals that more people would be willing to make more trips by bike or on foot if they felt they could do so without taking their lives in their hands.”  That comment at a legislative hearing by Kelly Kennedy, Executive Director of Bike Walk Connecticut, highlights the reason behind proposed legislation that would “help hold accountable careless drives who injure or kill non-motorized users of the road.”

Dubbed the “don’t hit me” bill, it is baambulance_ck for a fifth consecutive year at the State Capitol, endorsed by an array of 23 organizations.  In each of the past two years, it passed the Senate but was not considered by the House.  It recognizes that “vulnerable road users,” such as pedestrians, bicyclists, first responders, and highway workers need additional legal protections, and provides enhanced penalties for careless driving resulting in injury or death of a vulnerable road user.

The "Vulnerable User" bill:

  • Provides for a fine of up to $1,000 for injuring or killing a vulnerable user due to careless driving; and
  • Defines a vulnerable user as a pedestrian; cyclist; animal rider or driver; highway worker; farm tractor driver; user of a skateboard, roller or inline skates; user of a wheelchair or motorized chair; or blind person and his or her service animal.

The statistics behind the effort are clear:

  • Careless drivers injure hundreds of people every year in Connecticut--130 pedestrians and cyclists were killed between 2010 and 2012 and approximately 1,400 pedestrians and cyclists are injured every year, according to Bike Walk Connecticut.  Between 2006 and 2012, there were more than 10,000 deaths or injuries.
  • The League of American Bicyclists' top recommendation for Connecticut in its Bike Friendly State Report Card calls for Connecticut to "Adopt a vulnerable road user law that increases penalties for a motorist that injures or kills a bicyclist or pedestrian."  (CT's Bike Friendly State ranking was #18 in 2013.)

Nora Duncan, State Director of the Connecticut AARP, testified in support of the bill, noting that “an older pedestrian is 61 percent more likely to die from a crash than a younger pedestrian.”  The bill, she said, “could improve pedestrian safety by deterring negligent behavior that puts vulnerable uses at risk of injury or death.”  In a survey, 47 percent of people over age 50 in Connecticut said they felt they could not safely cross main roads close to their home.

share the roadThe proposal was also supported by the State Department of Transportation, which suggested that the definition “be all encompassing to include all users such as persons on a legal non-motorized device” such as scooters and skateboards.  Transit for Connecticut, a statewide coalition of 33 business, social service, environmental, planning and civic organizations advocating the benefits of mass transit, supported a vulnerable user law indicating that “with emphasis on energy conversation and healthy lifestyles, the number of walkers and bicyclists is growing.  These residents, along with residents living in close proximity to bus stops and transit services need proper access if they want to use public transit.”

Kirsten Bechtel of the Yale School of Medicine’s Department of Pediatric Emergency Medicine, called for individuals who commit an infraction under the proposed law to “attend driver retraining and perform community service.”  In written testimony, she said that “vulnerable user laws in Oregon, Washington and Delaware include these requirements to ensure that drivers are held accountable and operate their vehicles safely in the future.”  Others, including the Tri-State Transportation Campaign, supported that idea.

Clinton resident Debbie Lundgren, in an email to the Transportation Committee, said succinctly, “pass the Vulnerable User Bill this year.  We have waited long enough!”

The  Committee is expected to consider SB 336 later this month.  If approved there, it would go on to the Senate for consideration.  A road well traveled.

Connecticut Ranks #22 in Motor Vehicle Thefts; Rate Drops 3 Percent

Connecticut ranks #22 in the nation in motor vehicle thefts, with 238 thefts per 100,000 registered vehicles, a one-year drop of 3.3 percent, according to the most recent full-year data.

The District of Columbia had the greatest theft rate, with a total of 3,661 vehicles stolen and 322,350 registered vehicles in D.C.  That reflected a reduction in thefts of 18 percent in 2012 as compared with 201auto theft map
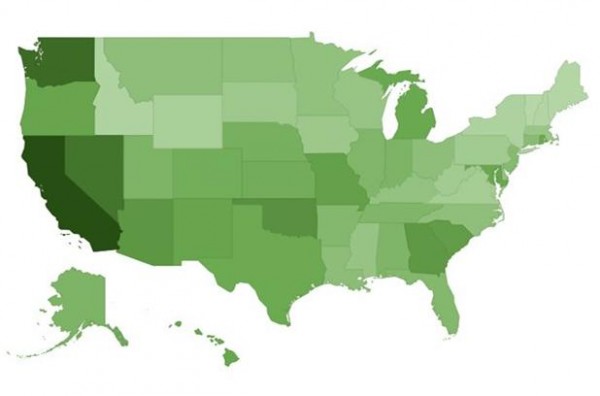
1, but still outdistanced all 50 states.

Rounding out the top 10 states with the highest rate of car thefts were California, Nevada, Washington, Maryland, Georgia, Arizona, South Carolina and Oklahoma.  Among the New England states, Rhode Island ranked #12, Massachusetts was #34, Maine was #47, New Hampshire was #49 and Vermont was #51, with 435 thefts and 606,941 registered vehicles – the lowest rate in the nation.

In Connecticut in 2012 there were 6,449 motor vehicle thefts.  The state has 2,706,459 registered vehicles.fbi-logo-large

The data was compiled by Bloomberg.com based on information from the Federal Bureau of Investigation (FBI) Uniform Crime Reports, and U.S. Department of Transportation Federal Highway Administration.

According to data compiled by the FBI and provided by the Criminal Justice Information Services Division:

  • There were an estimated 721,053 thefts of motor vehicles nationwide in 2012. The estimated rate of motor vehicle thefts was 229.7 per 100,000 inhabitants, placing Connecticut’s car theft rate  just above the national average.
  • The estimated number of motor vehicle thefts increased 0.6 percent in 2012 when compared with the 2011 estimates, but declined 24.8 percent when compared to the 2008 estimates, and 42.8 percent when compared to the 2003 estimates.
  • More than $4.3 billion was lost nationwide to motor vehicle thefts in 2012. The average dollar loss per stolen vehicle was $6,019.
  • In 2012, of all motor vehicles stolen, 73.9 percent were automobiles.

Want a Snow Day off from School? It Takes Less Snow in Southern CT

The forecast calls for snow Sunday night into Monday morning, and with it comes the possibility of school cancellations.  Whether or not students receive a snow day – in Connecticut and across the country – has everything to do with where they live, more than the depth of the snowfall.

Connecticut, more than many states, seems to have varying standards across the state, if data recently published by the website flowingdata.comconnecticut snow, based on a nationwide map developed using county-by-county data, is to be believed.

The data indicates how much snow, on average, it takes to close schools across the country.  Not surprisingly, in the northern states it takes quite a bit, while in the southern U.S. even the slightest snowfall can keep school children home.

In Connecticut, however, there appears to a less than uniform standard.  In the states’ southernmost counties – including Fairfield, New Haven, Middlesex and New London - it generally takes 3 - 6 inches of snow to close schools.  In the counties across the upper tier of the state – including Litchfield, Hartford, and Tolland, it takes 6 to 12 inches.

Windham Country, in the northeastern corner of the state, tends more toward the 3-6 inch line of demarcation.  State law in Connecticut  requires at least 180 school days per year, but individual districts—including those experiencing identical weather—often have vastly different ways of accommodating cancellations within the academic calendar.  A morning review of the school closing list on any of the major television stations demonstrates the inconsistencies beyond doubt.

The data does not account for ice storms and other winter conditions that can impact when local school superintendents decide to postpone a day’s school.  The data also does not reflect early dismissals or delayed arrivals due to weather conditions.

Across the nation, in much of the Midwest and Great Plains, school closing often depends more on wind chill and temperature than on snow accumulation. It has also been pointed out that school closures tend to say more about an area's infrastructure than the toughness of its citizens.  The recent impact on Atlanta and other Southern cities when hit with a relatively modest storm reflected that reality.

According to the Connecticut Department of Energy and Environmental Protection, the month of March brings, on average, 4.2 inches of liquid precipitation and 9.3 inches of snowfall.  In 1994, however, a record 83.1 inches of snow fell, the most since record-keeping began in 1905.

  snow cancel

The map was developed by Alexandr Trubetskoy.

Drive for More Electric Vehicles Continues to Gain Support, Funding in CT

The advance of electric cars continues, as does Connecticut’s encouragement of the trend.

The Connecticut Department of Energy and Environmental Protection (DEEP) and the Connecticut Automotive Retailers Association (CARA) will recognize state automobile dealers who sell or lease the highest number of electric vehicles (EVs) between February 1 and July 31, 2014 with the first ever “Connecticut Revolutionary Dealer Award.”  One award will be presented to the dealer that sells or leases the highest number of new EVs – incevconnecticutbannerluding plug-in hybrids – and the other will go to the dealer who sells or leases the most EVs as a percentage of total sales during the period.

The announcement this week follows by just a few months the agreement by eight states representing nearly a quarter of U.S. auto sales – including Connecticut - to promote infrastructure and take other steps to increase the number of electric- and hydrogen-fueled cars, trucks and buses on the roads. The states involved are Connecticut, California, New York, Maryland, Massachusetts, Oregon, Rhode Island and Vermont.

By developing standards for charging stations, expanding financial incentives to buy the cars and lowering consumer electric rates, the states hope to make the vehicles more appealing, The goal is 3.3 million non-polluting cars on the road by 2025. Zero-emission vehicles include battery-electric vehicles and hydrogen fuel-cell-electric vehicles

State Funding Leads to More Charging Stations

State officials said that Connecticut is leading the nation in developing ways to encourage residents and businesses to buy electric and other zero-emission vehicles when making transportation purchases.  Since July 2013, the state has provided $177,600 to 48 towns, businesses, and schools to build 75 electric vehicle charging stations throughout the state.  It is estimated there are already more than 164 publicly available charging stations in Connecticut, including many located at auto dealers.

The Department of Energy and Environmentcharging map
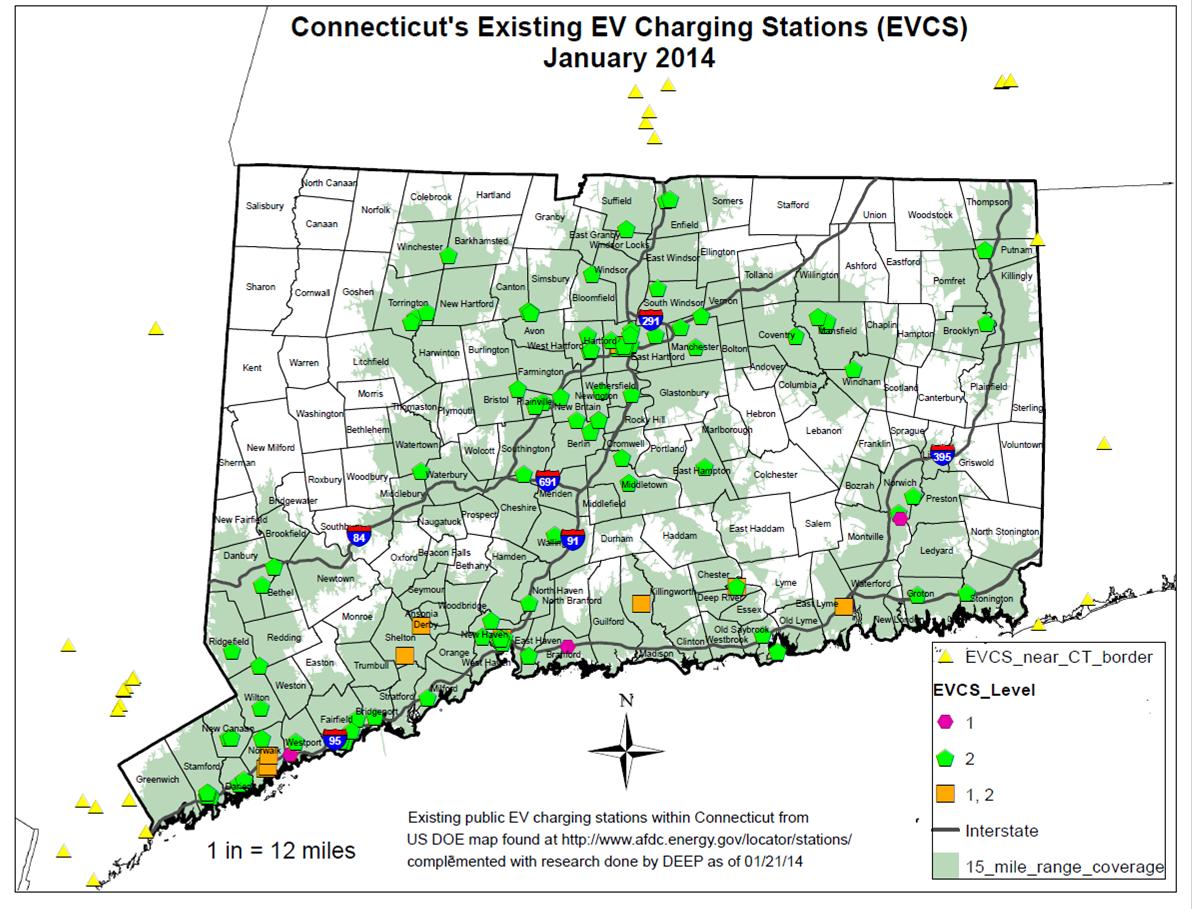
al Protection provides an up-to-date list of all the charging stations in Connecticut, as well as those near the state’s border in neighboring states.  Just over 50 of Connecticut’s 169 communities have at least one charging station.  Both Hartford and New Haven each have nine stations. Stamford has six, Bridgeport has one, Waterbury has none, according to the January 2014 data from DEEP.

Nationally, automakers are under pressure from the federal government to increase the average mileage of the vehicles they sell. Zero-emission vehicles are also supposed to make up at least 15% of sales by 2025. The Electric Drive Transportation Association told CNN Money said the market for electric and hybrid vehicles is growing steadily, especially as word of mouth spreads from satisfied customers.

 Electric vehicles are “a ‘win-win’ for our state because they can cut costs for motorists while improving our environment and public health,” said interim DEEP Commissioner Ronald Klee.  “Cars and trucks burning gasoline and diesel are one of the largest sources of harmful air pollution and greenhouse gases that contribute to climate change.” Expanding the number of publicly available charging stations in Connecticut is critical to meeting the goals of the eight-state agreement.”

Electric cars are powered entirely by an electric motor supplied by a large battery.  Unlike traditional hybrid cars, electric cars do not have a gasoline engine; they are “fueled” by plugging into an electric charging station.  A plug-in hybrid electric vehicle has an electric motor, an internal combustion engine and a plug to connect to the electrical grid.car charging

The Connecticut Automotive Retailers Association is a statewide trade association representing over 250 franchised new car and truck dealerships primarily engaged in the retail sale of new and used motor vehicles, both foreign and domestically produced.

Last fall, Luis Ramírez, CEO of GE Energy Industrial Solutions joined Governor Malloy in unveiling the GE Electric Vehicle (EV) Solar Carport in Plainville.  The project, one of the most expansive undertakings of its type in North America, uses GE’s new smart EV Charging Stations to charge electric vehicles.  DEEP’s stated goal, former Commissioner Dan Esty said at the time, is to provide “publicly accessible EV charging stations within a 15-minute driving radius of any location in Connecticut.”

U.S. electric car sales have more than tripled from 17,000 in 2011 to 52,000 in 2012, according to data from the DEEP. Motorists bought more than 40,000 plug-in cars in the first six months of 2013, the most recent data available.

State's Public Transportation Commission Calls for Service Improvements, Safeguards to Transit Fund

With the start of the legislative session, one of the many reports landing on legislators desks include a series of six recommendations for improving public transportation services, developed by the Connecticut Public Transportation Commission and outlined in their recently released 2013 Annual Report. The recommendations, according to Chair Kevin Maloney, “do not call for any major new State-funded initiatives, though some of the recommendations would require incremental expenditures to current projects or services.”

The Commission, a 14-member advisory body comprised of gubernatorial and legislative appointees, and including members from industry and the public, developed the recommendations following seven public hearings in Norwalk, Putnam, Bristol, Orange, New Milford, Enfield and New London, and monthly meetings throughout the year.  The Commission:

1.  Strongly supports efforts to safeguard the Special Transportation Fund, stating that resources of the fund “must be reserved to address the needs of Connecticut’s roads, bridges and transit systems.”  The report noted that:

  • transfer of Fund monies to the General Fund deprives Connecticut’s infrastructure and services of these much-needed resources
  • the transfer of Fund monies violates the trust that the Special Transportation Fund’s supporting revenues and user fees will benefit the transportation services and facilities upon which those who pay the gas tax, gross receipts tax, fares and license and permit fees rely
  •  “the continued deferred investment in our transportation infrastructure that the diversion of Special Transportation Fund resources causes will erode Connecticut’s attractiveness and make it harder to compete with other states for businesses and residents”

2. Recommends sustained support for adequate for the continued operation and growth of the Coastal Link bus service, operated by Greater Bridgeport Transit, Norwalk Transit and Milford Transit along the Route 1 corridor, be provided. The line – which the report describes as “highly successful” and “perpetually in jeopardy” due to insufficient funding - carries over 4,000 passengers per weekday and over 1.2 million passengers annually, and the butransportation report
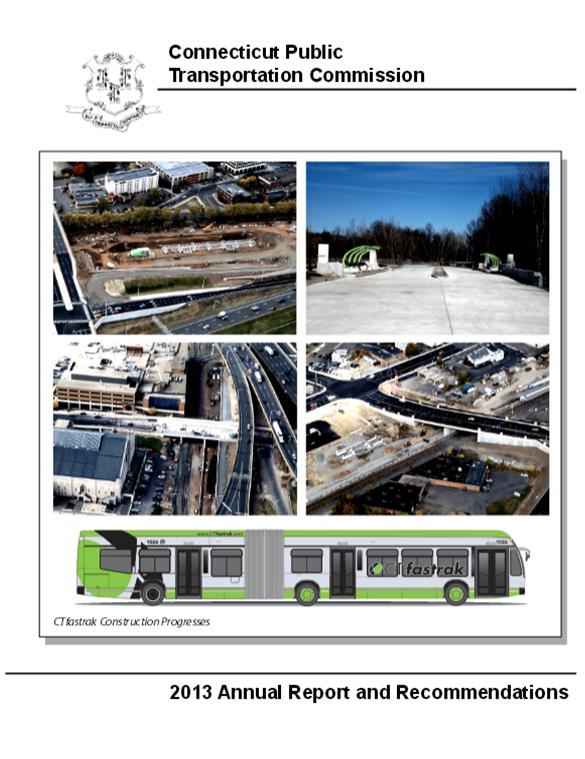
ses running this service are frequently at or above capacity with some occurrences where riders must be turned away.  “At a minimum,” the report recommends, “additional investment of state funds would be required to support additional buses to provide a consistent level of services and improve service quality.”

3. Commends ConnDOT for restoring funds to the Municipal Dial-A-Ride program – a “much needed program” that provides mobility to seniors and persons with disabilities across the state, and is “especially important to small rural communities.”  Funding had been reduced by 25 percent in 2011, which was restored in the FY2014 state budget, according to the report.  Approximately 130 municipalities apply for program funds each year.  The report notes that Connecticut is the seventh oldest state in the nation, with the over 65 population projected to grow by 64 percent by 2030. 

4. Encourages ConnDOT to apply the techniques used to inform the public about the progress and projected benefits of CT FastTrak (previously known as the Hartford-New Britain Busway) with information on other high profile projects such as the Stamford Transportation Center.   The report states that a “more vigorous and pro-active outreach effort...may pay dividends in lessening political headwinds and gain public support for these projects.”   Such actions “for other major transit projects such as the New Haven-Hartford-Springfield commuter rail service would also serve both ConnDOT’s and the public’s interests.”

5.  Urges State cooperation with an on-going effort by the Housatonic Railroad to develop a privately-run, unsubsidized passenger rail service between Danbury and Pittsfield.  With the commitment by Massachusetts of substantial funding for that state’s portion of the project, this proposal is starting to gain some momentum, the report indicates.

6.  Recommends “more effective dissemination of information about new and existing transit services,” recognizing that “the public does not have sufficient awareness of and information about existing transportation services to take full advantage of these services.”  The Commission indicated that this was a “recurring theme” at the Commission’s public hearings, and called for both high-tech and low-tech solutions.  The report noted that “addressing this need can be challenging,” because “ConnDOT has no dedicated marketing staff and no marketing budget,” and “marketing for individual services is often sporadic and inconsistent.” connecticut

Additional topics were noted in the Annual Report as a result of issues raised during public testimony, including:

  • the increasing popularity of cycling and the resulting demand for more bicycle amenities and facilities,
  • the desire of several smaller transit districts to implement designated and signed bus stops to increase system visibility and assist their riders,
  • the need for better communication on train platforms to alert riders as to which track an arriving train will be using,
  • the increasing demand for inter-regional bus services, repeated accounts of train fares going uncollected, and
  • the demand for bus and rail services which cross Connecticut’s boundaries into adjacent states.

The Commission is chaired by Kevin Maloney, President/CEO of Northeast Express Transportation, Inc. which operates NEXTAir, NEXTCourier and NEXTDistribution.  Commission members include Christopher Adams, Richard Carpenter, Morton Katz, William Kelaher, Yvonne Loteczka, Kevin Maloney, Edward McAnaney, Robert Rodman, Kiernan Ryan, Russell St. John, Richard Schreiner, Richard Sunderhauf, Alan Sylvestre, and John Zelinsky.  Among the ex-officio members are DOT Commissioner James Redeker, Sen. Andrew Maynard and Rep. Antonio Guerrera.

The Commission continues to meet monthly in accordance with state statute, with the next meeting scheduled for March 6 at New Haven’s Union Station.

Familiar Business Logos Coming to a Highway Near You, Promoting Tourism

The logos of Taco Bell, Starbuck’s and Georgie’s Diner are among 10 business logos and 7 tourist attraction logos that will be appearing on a total of 27 state highway signs in Connecticut this year, under a state program just underway.  The highway signs, part of the state’s ongoing efforts to promote tourism, will appear on I-95, I-91, I-84, I-395 and Routes 8 and 9.

Administered by the state Department of Transportation, the 10 business logos that will be appearing on 13 signs across the state include A-1 Diner, Dunkin Donuts, Georgie’s Diner, Mobil, Starbucks, Comfort Inn, Taco Bell, Residence Inn, Guilford Suites, and Chili’s.

The seven tourist attraction logos that will appear on 14 roadway signs include the Essex Steam Train & Riverboat, The Griswold Inn, the Tanger Outlet Center, The Adventure Park at Storrs, Niantic Bay Boardwalk, Sailing Ship Argia Cruises, and Antique Center (at exit 8 on I-95).  Among the attractions, four attractions will be having signs posted for the first time, with each to have a sign in each roadway direction (northbologosund and southbound, or eastbound and westbound).

The largest number of logos appearing will belong to Taco Bell, with four roadway signs, on I-395 at exit 93, I-91 at exits 16 and 47E, and Route 9 at exit 19.

According to the DOT, the Specific Information (Logo) Signing Program is intended to provide the motoring public with information on essential travel services (gas, food, lodging, camping) that are available at qualified interchanges on expressways in Connecticut.

The program allows qualified businesses to apply and erect their business sign or logos on specific information (logo) signs. Businesses must meet minimum qualification criteria specified in the regulations governing the program. There are no exceptions or waivers. A non-refundable $2,000.00 application fee per business, per interchange must accompany the application.highway sign

Installation of business signs is permitted only after field review of business and sign feasibility is conducted by the Department and certain concurrences and permits are completed or obtained.

All costs for fabrication and installation of signing by a contractor is the responsibility of the initial business on an interchange approach. Subsequent businesses are required to reimburse the initial business a percentage of the initial business’s installation cost as indicated in the regulations. Subsequent businesses are also responsible for all costs for the installation of their business signs. Businesses must continue to meet minimum qualification criteria as long as the business sign is displayed or signing will be removed.

The Connecticut Tourist Attractions Sign Program is intended to create a predictable and recognizable system to help travelers locate places of interest that will make their experience in Connecticut more Adventure Storrs logoenjoyable. Participating businesses must indicate how many potential visitors they hope to attract at various periods during the year.  Those accepted Argiainto the signage program must annually update DOT on their visitor-traffic counts and provide related information.

In another project promoting Connecticut sites and attractions for highway travelers, I-95 will soon see signs posted by DOT promoting the University of Bridgeport, Housatonic College, Barnum Museum, Webster Bank Arena, Harbor Yard Ballpark, Shoreline Star Greyhound, Connecticut Audubon Center, Silver Sands State Park, Westfield Post Mall, PEZ Visitor Center, West Haven Beaches, University of New Haven Yale Bowl.  Three of the signs are new (Yale Bowl, Silver Sands and CT Audubon); the others are replacing existing signs.

Exodus: Connecticut Ranked #1 in People Moving From State

Connecticut residents are on the move.  Out.

The state led the nation with the highest percentage of outbound moves in 2013, according to Atlas Van Lines’ annual report of moves throughout the U.S. and Canada. Of 2,055 residents' moves during the year, 1,230 of them, or 60 percent, were out of state – the highest percentage in the nation.  That's compared to 825 moves from other states into Connecticut.new_atlas_logo

A year ago, Connecticut was #7 in the nation in the ratio people moving out-of-state, with 1,123 outbound and 834 inbound moves, in a survey by United Van Lines.  This year, Connecticut led the nation in outflow of residents in the Atlas Van Lines survey.

us moving mapDuring the past five years, inbound moves peaked in 2010 at 1,009 – with a just slightly higher  1,160 outbound moves.  Since then, the numbers have skewed increasingly out-of-state, Atlas reported.

The 2013 year was the state's highest outbound percentage and highest total number of outbound moves since 2009.  Connecticut has been an outbound state for six of the past ten years, including the past three consecutively, according to Atlas.  An “outbound” state is defined as one that has more than 55 percent of moves outbound.

The remainder of the New England states were "balanced" in 2013, with the exception of New Hampshire, which was considered an inbound state in 2013. The data indicates that progressively fewer people were moving into Connecticut in the last three years, a pattern not consistent throughout New England.  None of the other New England states were outbound states in 2013.  In the previous year, Maine joined Connecticut as an outbound state in the United Van Lines survey.

States that saw the greatest percentage of inbound movers: North Dakota, North Carolina, and Texas.  States with the highest outbound move percentage after Connecticut were New York and Indiana, both at 59 percent.  Only 12 states were net outbound states:  Connecticut, New York, Indiana, Wyoming, Delaware, Nebraska, Minnesota, Illinois, Indiana, Ohio, Pennsylvania, and New Jersey.Connecticut

The Greenwich Time reported that the branch manager of Danbury's Certified Van Service of Connecticut say, his truckers – part of the United Van Lines company - relocated about 100 families from the Hartford area to Charlotte, N.C., and from Fairfield County to Atlanta. For Kevin Kaster, president and owner of Kaster Moving in Stamford, the study confirms one trend he's recently experienced.  "Texas has been a hotspot the last two years, no question," he said. "An inordinate amount of people from around here are going to Texas."  Brielle Sollinger, aoutboundssistant marketing manager at Fallon Moving and Storage in Windsor, agreed.   "Texas is big. We also do lots of Virginia, North Carolina and South Carolina," she said in a phone interview Friday afternoon.

Atlas reported that across the nation, most states were balanced evenly between inbound and outbound moves. The company also reported that the number of total moves increased during the year, something it said could be an indicator of an improving economy.  The data covered the period from January 1 through December 31, 2013.

New Haven Is Among Most Walkable Cities in America, Ranks #8 Nationwide

New Haven is one of America’s most walkable cities, with 11.2 percent of commuters walking to work, the 8th highest percentage in the nation, among cities with populations of at least 100,000.  The top 10 list of Most Walkable Cities, published by GOVERNING magazine, notes that many of top communities are in the Northeast, and that communities across the country are stepping up efforts to enhance alternative ways of commuting from home to work. New_Haven_downtown_map
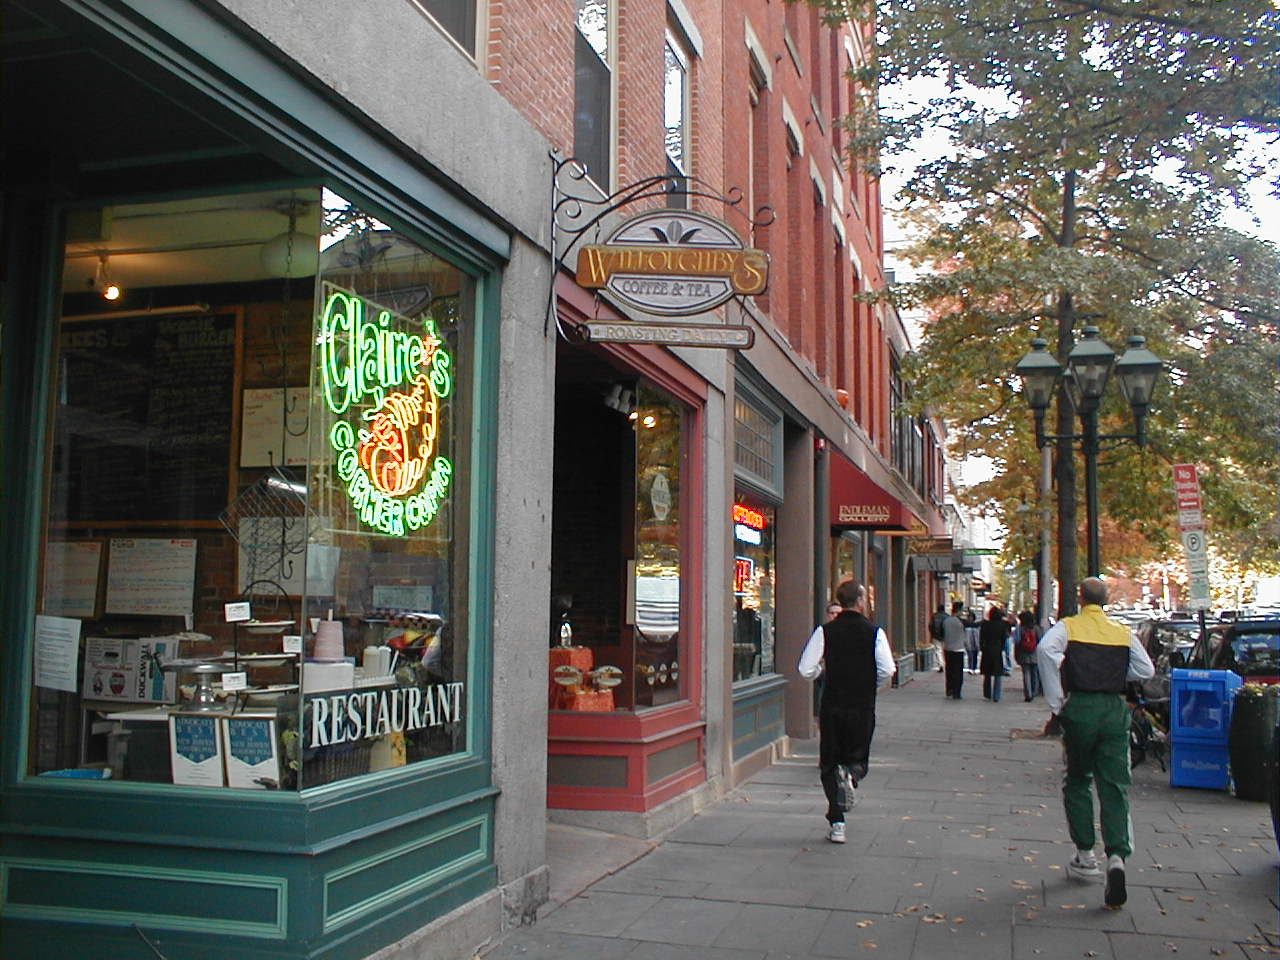
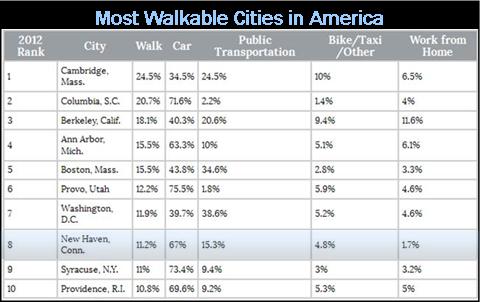
The top cities were Cambridge, MA (24.5%), Columbia , SC (20.7%), Berkeley, CA (18.1%), Ann Arbor, MI (15.5%), Boston, MA (15.5%), Provo, UT (12.2%), Washington, DC (11.9%), New Haven, CT (11.2%), Syracuse, NY (11%) and Providence, RI (10.8%).OLYMPUS DIGITAL CAMERA

Overall, 67 percent of New Haven commuters use their car, 11.2 percent walk, 4.8 percent bike or use other modes of transportation, and 1.7 percent work from home., according to the data developed from the U.S. Census Bureau's American Communities Survey, which included 300 metropolitan areas.

Nationally, only 2.8 percent of workers primarily commuted by walking last year, a figure that remains mostly unchanged from recent annual estimates, GOVERNING reported.

Among the New Haven walkers, 36 percent are age 16-24, 52 percent are age 25-44, 9 percent are age 45-64 and 2 percent are age 65 or older.  The median age of walk commuters is 27.8, according to the date.  In categorizing individuals, a person’s longest distance traveled is used, so those walking tp transit stations are designated as public transportation commuters, even though a portion of their daily commute involves walking.

Among Connecticut’s most populous cities, in Bridgeport 4.3 percent of commuters walk to work; in Stamford the figure is 4.7 percent, in  Hartford 7.9 percent, and in Waterbury 2.6 percent.

walkable chart