Connecticut's Small Business Friendliness Grade Drops to "D"

A new survey of small business friendliness in the nation’s states has dropped Connecticut’s overall grade from D+ to D, and given the state a failing grade in seven of eleven small business friendliness categories.  The grades dropped as compared with last year's survey. Thumbtack.com, in partnership with the Ewing Marion Kauffman Foundation, released the third annual Small Business Friendliness Survey showing that small business owners in Utah, Idaho, Texas, Virginia and Louisiana gave their states the highest rating for friendliness to small business. In contrast, small business owners gave California, Rhode Island and Illinois an "F," while New Jersey joined Connecticut in earning a "D" grade. grade D

More than 12,000 entrepreneurs nationwide participated in this year's survey - the largest of its kind and  the only survey to obtain data from an extensive, nationwide sample of small business owners to determine the most business-friendly locations.

The survey ranked states on specific categories, including: the ease of starting a business, ease of hiring, state and local business regulations, health & safety regulations, employment, labor & hiring regulations, tax code and tax-related regulations, licensing forms, requirements and fees, environmental regulations, zoning and land use regulations, and the availability of training & network programs for small business owners.thumb logos

Connecticut received a B in two categories: ease of hiring and training & network programs, and a D in one: ease of starting a business. In all other categories, Connecticut received an F for small business friendliness.

Some of the key findings for Connecticut, according to the survey of small business owners:

  • Connecticut received a D for its friendliness towards small business, one of the worst grades in the country.
  • Connecticut received the worst grade in the nation for its regulatory friendliness.
  • The state rated in last place for its health and safety, licensing, environmental regulations, and zoning laws.
  • Small businesses in Connecticut had the second worst outlook for the national economy of any state.
  • Female entrepreneurs in Connecticut rated the friendliness of their state government 9 percent higher than their male counterparts.

connecticutIn last year’s survey, Connecticut did not receive a single grade of “F.” The state’s overall grade was D+, and included an A in training & networking,  B in ease of hiring, and  B- in health & safety regulations. Other grades were D+, C- and C. In the first survey conducted, in 2012, Connecticut’s overall grade was D, and the state was not graded F any category.

"Creating a business climate that is welcoming to small, dynamic businesses is more important than ever, but rarely does anyone ask small business owners themselves about what makes for a pro-entrepreneur environment," says Jon Lieber, chief economist of Thumbtack.com. "Thousands of small business owners across the country told us that the keys to a pro-growth environment are ease of compliance with tax and regulatory systems and helpful training programs."

Some of the survey's key findings include:

  • Small businesses in Texas, Utah and Idaho have rated their states in the top five every year this survey has run, while California and Rhode Island have been rated in the bottom five every year.
  • The friendliness of professional licensing requirements was the most important regulatory issue in determining a state's overall friendliness to small businesses. Closely following licensing requirements was the ease of filing taxes.
  • Once again, tax rates were a less important factor than the ease of regulatory compliance in determining the overall friendliness score of a jurisdiction. Two-thirds of respondents said they paid their "fair share" of taxes – that is, they felt like they were neither under-paying nor over-paying.
  • Small business owners who were aware of training programs offered by their government were significantly more likely to say their government was friendly to small business than those who weren't.


Connecticut’s Taxpayer Burden Among Nation’s Highest, Report Finds

The states with low tax burdens are experiencing net immigration, and states with high tax burdens are experiencing high net outmigration, according to an analysis by Governing magazine of data from the Tax Foundation. Connecticut, which the publication lists as having among the nation’s highest taxpayer burdens, is seeing more residents leaving than arriving, the data indicates. The 15 states with high “Tax Burdens and Taxpayer Burdens” are, ranked from highest to lowest, Connecticut, New Jersey, New York, California, Illinois, Massachusetts, Maryland, Hawaii, Rhode Island, Delaware, Vermont, Kentucky, Michigan, Pennsylvania and West Virginia.

Here’s how Governing described the Tax Foundation’s latest annual study: “Across the 50 states, the share of revenue coming from local and state taxes varies significantly, as does the mix of property, sales and income taxes. When measuring the burden imposed on a given state’s residents by all state and local taxes, one cannot merely look to collections figures for the governments located within state borders. There is a significant amount of tax shifting across state lines, and this shifting is not uniform. Further, this shifting should not be ignored when attempting to understand the burden faced by taxpayers within a state.”tax burden map

That is especially true in Connecticut, where significant numbers of residents work in New York, Massachusetts and Rhode Island. Addressing these issues, the Tax Foundation estimates the total state and local tax burdens arising from all sources as a share of state income. The Tax Foundation calls this statistic the "State-Local Tax Burden." In the Tax Foundation's most recent study, covering fiscal 2011, the "State-Local Tax Burden" ranged from a low of 6.9 percent (Wyoming) to a high of 12.6 percent (New York).

According to the report, “New York residents experienced the highest burden at 12.6 percent of income. Next were New Jersey and Connecticut, where residents paid 12.3 and 11.9 percent, respectively. Rounding out the top ten in highest state-local burdens are California, Wisconsin, Minnesota, Maryland, Rhode Island, Vermont, and Pennsylvania. Connecticut taxpayers’ burden has risen 0.8 percentage points from 11.1 percent in 1977 to 11.9 percent in 2011, putting the state in third place.

New York, New Jersey, and Connecticut have occupied the top three spots on the list since 2005. The report notes that “this may be partially attributed to high levels of expenditures which must be sustained by high levels of revenue. Further, in the case of Connecticut and New Jersey, relatively high tax payments to out-of-state governments add to already high in-state payments. This is likely related to the fact that these are high income states that pay high levels of capital gains. High levels of capital gains will result in residents paying an increased share of other states’ business taxes.”

The report also indicates that “Maine and Vermont have the largest shares of vacation homes in the country, and they collect a sizeable fraction of their property tax revenue on those properties, mostly from residents of Connecticut, Massachusetts, and other New England states.”

The organization Truth in Accounting calculates "Taxpayer Burden" -- the per-taxpayer share of the money needed (or available) to pay bills. In fiscal 2011 (the same year as the latest Tax Foundation results), the "Taxpayer Burden" ranged from a low of minus-$34,100 (a surplus, in Alaska) to a high of $50,900 (in Connecticut).

tax burdenAdded Bill Bergman, the director of research for Truth in Accounting, a Chicago-based nonprofit working to “promote truthful, timely and transparent government financial reporting”: “States that rank high on both Tax Burden and Taxpayer Burden face another challenge. The third whammy is that citizens in these states are leaving for other states, taking their taxable spending, property and income with them. It seems reasonable to suspect that their choice to leave may be directly or indirectly related to state fiscal conditions.”


Nationally, state and local tax burdens dropped in 2011 as compared with 2010, largely attributable to incomes rising that year for the first time since 2008, Governing reported. The study methodology noted that “when Connecticut residents work in New York City and pay income tax to both the state and the city, the Census Bureau will count those amounts as New York tax collections, but we count them as part of the tax burden of Connecticut’s residents.”

Since 1937, the Tax Foundation’s “research, insightful analysis, and engaged experts have informed smarter tax policy at the federal, state, and local levels” the organization’s website explains.

CPTV to Launch Third Season of Infinity Hall Live to National Audience, New Content-Rich Website

There was a time when Connecticut Public Television was most associated across the country with a purple dinosaur named Barney. Next it was the UConn women’s basketball team that became synonymous with CPTV. Now, a distinctive concert series has come to define the local network well beyond our state’s borders. Infinity Hall Live, the intimate concert series taped at historic Infinity Music Hall in Norfolk, returns in July to CPTV with a new season of five episodes. This season’s line-up includes: five-time Grammy-winning blues legends The Robert Cray Band, folk/pop artist Brett Dennen and his four-piece band, alt-country rockers Deer Tick, seven-time Grammy nominee singer-songwriter Joan Osborne and the band of brothers Los Lonely Boys. infinity

Co-produced by Connecticut Public Television (CPTV) and Infinity Music Hall, the third season of the series, airing on CPTV and public television stations across the country, features a lineup of diverse artists from a wide range of musical genres – rock, folk, blues and more – appealing to fans of every taste and generation.

Nationally, over 70 percent of public television stations nationwide have broadcast Infinity Hall Live, bringing fans from all over the country inside the cozy Victorian music hall. Major markets airing the new season beginning in July will include New York, Los Angeles, San Francisco, Boston, Washington DC, Phoenix, Portland, St. Louis, Cleveland and many more. A complete list of stations is available at www.pbs.org/tv_schedules/. Executive Producer is multiple regional Emmy Award winner Jennifer Boyd.

Known for its rustic style, the intimate 300-seat Infinity Hall, built in 1883, has a unique ability to offer fans a profound and personal way to not only enjoy their favorite artists’ songs, but also listen to interviews on their creative processes. In candid pre- and post-show interviews, the performers reflect on their motivations, their inspirations, and their unique style of songwriting and playing.

In addition to the new concert programming this season, Infinity Hall Live is offering a major relaunch of its website at www.ihlive.org. The website will feature more bonus content, a new design, extended interviews and videos not featured in the broadcast versions of the shows.

The new season of five episodes will be combined with 22 concerts from the previous two seasons of Infinity Hall Live and released online over the coming year for on-demand video streaming.

Every two weeks, a new concert will be released on the Infinity Hall Live website, www.ihlive.orginfinity hall website, for a limited time. The full programs will also be available for streaming online on PBS Video (http://video.pbs.org/program/infinity-hall-live/)and on TVs and mobile devices through the PBS apps for iOS (iPhone and iPad), Apple TV, Kindle Fire, Roku and Xbox.

Connecticut Public Television is one of the top presenting stations of public television programming in the U.S., with over two decades of experience producing programs that inform, educate, entertain and inspire – including a strong reputation and track record as a leader in performance programming


With Hockey History, North Carolina and Connecticut Look to Baseball, Attendance Growth

North Carolina and Connecticut – two states forever linked in the cross-currents of sports by the Hartford Whalers relocation to the Tarheel State in 1997, are both using 2014 to heighten their professional baseball credentials. The City of Hartford has announced that the Double A franchise currently in New Britain will be moving to the Capitol City in 2016 in a soon-to-be-built $60 million, nearly 10,000 seat stadium. Just two months ago, the Triple A Charlotte Knights opened their newly constructed 10,200 seat $55 million downtown stadium. The Knights are an affiliate of the Chicago White Sox. Ground was broken on the new stadium in September 2012, about an 18 month construction schedule.

BB_T_Ballpark_media_7suaxdjb_lv2jd5cuThe first Knights game took place on April 11, 2014. (photo at left) The stadium features a two-level club with skyline views as well as a VIP, climate-controlled club with full service bar. In addition to corporate suites, there are 987 club seats at the new Charlotte stadium. Of those, 170 on the upper level sell for $41.50 per game, or nearly $3,000 per season. The remaining 817 club seats, at $21 per game, sell for about $1,500 annually.  All of the club seats were sold out 10 months prior to the season opener, according to the Knights website.  Season tickets require either a two- or four-year commitment. Naming rights to the stadium were sold to BB&T Corporation in 2012. Published reports also indicate that multiple new hotels are expected to open in the area around the stadium in the coming years, along with restaurants and retail.

The Charlotte team’s website reports that “National ballpark consultants conservatively estimate that in its first year BB&T Ballpark should draw at least 600,000 fans just for baseball.” In addition to obtaining corporate sponsorships, among the fundraising initiatives along the way in Charlotte were commemorative bricks sold to be placed in the stadium’s entrance, at a cost of between $90 to $195, containing individual messages determined by purchasers. A portion of the sales went to local charities in Charlotte.

Comparing Attendance Numbers, Possibilities

The Rock Cats drew more than 307,000 fans to their 6,100-seat stadium in New Britain last year, ranking sixth in the 12-team Eastern League. The Knights were last in attendance in the Class AAA International League last year, with an average of 3,803 per game, down from a high of 4,736 in 2006, according to the Charlotte News Observer. In 2013, the New Britain Rock Cats averaged 4,653 fans per game, which ranked 59th among baseball’s minor league teams. Charlotte ranked 80th. The top team in the league - and in minor league baseball - the Columbus Clippers, drew 9,212 per game.

Knights website

The AAA Pawtucket Red Sox average attendance in 2013 was 7,827, ranked #10 in minor league baseball. The Double-A Portland Sea Dogs, also a Red Sox affiliate, ranked 47th, drawing an average of 5,096 per game. Among Double-A teams, Portland ranks tenth.

The top minor league teams, based on average attendance in 2013, are in Columbus, Lehigh Valley, Indianapolis, Sacramento, Dayton, Buffalo, Louisville, Round Rock (Texas) and Albuquerque. The top Double-A teams are in Frisco, TX (7,057); Richmond, VA (6,689); Reading, PA (6,321); Tulsa, OK (5,704); Birmingham, AL (5,669); Corpus Christi, TX (5,498); Trenton, NJ (5,373) and New Hampshire (5,125).

On July 12, 2008, the Rock Cats established a franchise record for single game attendance, with a crowd of 8,115 at New Britain Stadium. The record was broken on June 27, 2009, with a crowd of 8,212. The Rock Cats reached the 8,000 mark once again on May 31, 2014 with a crowd of 8,079.

For those who wonder if there is a Triple A future for a Hartford baseball stadium, the history of Pawtucket may be of interest. The first team to be named the Pawtucket Red Sox debuted in 1970 as a member of the Double-A Eastern League, according to Wikipedia. After three seasons as a Double-A Red Sox affiliate, Pawtucket's Eastern League franchise moved to Bristol, CT in 1973 to make room for the new Triple-A PawSox. And as most Connecticut sports fans recall, the Bristol franchise then moved to New Britain in 1983, first as a Red Sox Double-A affiliate (through 1994) and then as the farm team of the Minnesota Twins.IMG_6669

And might the presence of a stadium in Hartford, rather than New Britain, cause the Red Sox to return with an affiliate in Connecticut? Apparently not any time soon. The Sox appear set in Pawtucket and Portland.

In January 2013, the Portland Sea Dogs announced an extension of their affiliation with the Boston Red Sox as the Double A minor league team. Their contract was set to end after the 2014 season but the extension through the 2018 season was announced during the Portland Sea Dogs Hot Stove Banquet by Red Sox director of player development Mike Hazen and Sea Dogs president Charlie Eshbach. Eshbach served as Eastern League President for 11 years and is the league's longest serving active member  – dating back to his tenure as general manager of the Bristol Red Sox in Connecticut, not too many years after attending college at UConn.

“We are delighted to extend our relationship with the Portland Sea Dogs for an additional two seasons,” said Hazen at the time. “We are extremely fortunate to work with some of the best people in minor league baseball in Portland. The Burke family, Charlie Eshbach, and the entire Sea Dogs organization always go above and beyond to provide support to our players and staff. With the Sea Dogs, our minor leaguers experience the ideal environment to succeed and grow.”

The Sea Dogs are now in their 21st season at Hadlock Field, their 12th as an affiliate of the Boston Red Sox. The Red Sox originally entered into an agreement with the Sea Dogs following the 2002 season, when Portland changed affiliations from the Florida Marlins.

 (photo credit: Rob Kavaler)

rankings

Connecticut Leads Nation in Dental Visits for Third Consecutive Year

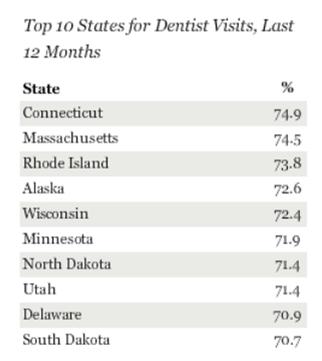
For the third year in a row, Connecticut residents were the most likely to say they visited a dentist in the last 12 months. The state is joined by two New England neighbors, Massachusetts and Rhode Island, as the only states where nearly three in four residents report that they visited a dentist. The top 10 states for dental visits, according to a Gallup Healthways Well-Being survey, are: Connecticut (74.9%), Massachusetts (74.5%), Rhode Island (73.8%), Alaska (72.6%), Wisconsin (72.4%), Minnesota (71.9%), North Dakota and Utah, (each at 71.4%), Delaware (70.9%) and South Dakota (70.7%). kids-dentistry

Just over half of the residents in Mississippi say they’ve visited a dentist during the past year (53%), coming in last for dental care among the 50 states. At the bottom of the list with Mississippi are Oklahoma, Louisiana, Arkansas, Texas, West Virginia and Tennessee. dental visits top 10 states

Five states - Connecticut, Massachusetts, Rhode Island, Wisconsin, and Minnesota - have ranked in the top 10 states for dental visits every year since Gallup and Healthways began daily tracking in 2008.

Connecticut has taken the top spot four times -- from 2011 through 2013, and in 2009. On the other end of the spectrum, eight states -- Mississippi, Oklahoma, Louisiana, Arkansas, Texas, West Virginia, Tennessee, and Kentucky -- have ranked in the bottom 10 every year since 2008. Nationally, 64.7% of Americans in 2013 said they visited the dentist at least once in the past 12 months. This is essentially unchanged from 65.4% in 2012, and remains in line with the averages reported in previous years since 2008.

gallup logoThese findings are based on interviews with more than 178,000 American adults conducted during 2013 as a part of the Gallup-Healthways Well-Being Index. Respondents were asked whether they visited the dentist in the last 12 months.
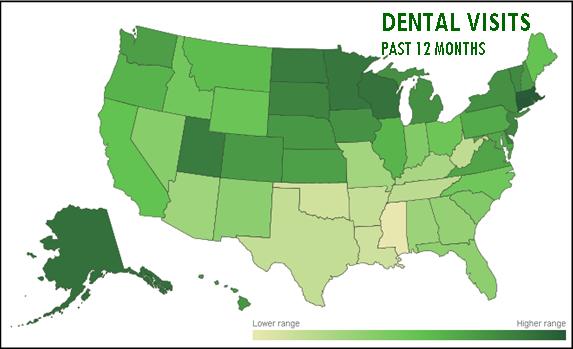
Residents of Eastern states are the most likely to report visiting the dentist in the past year, according to the survey data. Residents in the Midwest are the second-most likely to report visiting the dentist in the past year, and four Midwestern states are included within the top 10 for 2013. Residents of Southern states are the least likely to go to the dentist and make up eight of the bottom 10 states for dental visits.

The study noted that a relationship between dental visits and income exists, and those states with fewer reported visits also have, on average, a relatively lower percentage of residents with enough money to pay for healthcare and a higher percentage of uninsured residents.

map chart

Middle School Girls to Focus on STEM Fields at Annual Innovation Event

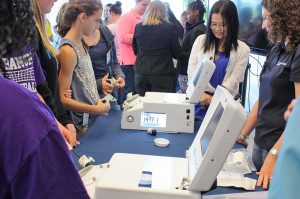
Connecticut’s drive to promote the development of the STEM fields – science, technology, engineering and math – to boost Connecticut’s economy and create sustainable jobs includes women and girls as essential to the efforts’ success. girls of innovationThat aspect will be front and center on Saturday, June 7, when the Connecticut Technology Council sponsors the annual Girls of Innovation program in Hartford, geared specifically to middle school age girls, entering grades 7 and 8, “to experience science and its challenges in a fun, interactive way,” according to program organizers.


Girls of Innovation “inspires today’s middle school students to consider careers in science and technology-related research, health services and business areas.” During the day, volunteers drawn from the Connecticut Women of Innovation program and CTC membership meet and work with the girls. They talk with the students about their experiences and careers and guide them through the challenges created by the Staff Scientists at the Connecticut Science Center.GOI-LOGO-crop-web

Hank Gruner, Vice President of Programs at the Connecticut Science Center, which hosts the program, understands the need to develop programs that will bring more middle school girls into science and technology fields. “The Connecticut Science Center feels strongly that this type of project is essential for Connecticut’s future science and technology workforce,” says Gruner.

Officials point out that although women fill close to half of all jobs in the U.S economy, they hold less than 25 percent of STEM related careers. A key message from the Girls of Innovation program is to show participating middle school students real scientists who are “like me” and to inspire girls with the confidence, enthusiasm and persistence to continue pursuing their scientific interests. The program achieves that by bringing the girls together with women working in STEM careers who can talk with the girls about their own career path and interests and choices they made while growing up. The program sponsor is Covidien. New this year, and as a thank you to the girls participating in the science challenge, program sponsors will be coordinating a hands-on activity and distributing Genius Boxes at the conclusion of the event. A Genius Box is a do-it-yourself, boxed project containing all the necessary materials a child needs to complete the challenge inside. genius-box-287x300

The Genius Box co-founders will be distributing their prototype Circuits Genius Box to the middle school girls at the event, completing a Flying Saucer circuits activity in small groups with program participants and then presenting each girl with a box to take home containing two remaining Circuits activities - a DIY Circuit Board to light up an LED and sound a buzzer, made up of a 3 volt battery, paper clips, and fasteners, and also a Pop-up LED Circuits card made from a 3 volt battery and copper wire.

A new entrepreneurial start-up developed as part of a college challenge by students Kate Pipa and Shivangi Shah, Genius Box delivers a monthly themed box of STEM (science, technology, engineering, and math) experiments “right to your door, packed with projects and learning opportunities.” The drive behind the business is clearly stated: “We empower the changemakers and problem-solvers of tomorrow, today.” CTC logo

The mission of the Connecticut Technology Council is to build an interactive community of innovators and their supporters that can leverage these great advantages to create a thriving economy, job growth, a global reputation for entrepreneurial support, and a lifestyle that attracts the best and brightest people to come here and retains the young people who have grown up here. The CTC recently hosted the 10th annual Women of Innovation awards, which recognized 59 women from across Connecticut for their innovation and leadership contributions in the STEM fields.

Connecticut Ranked 2nd in Nation in Percentage of Workforce in Financial Industries

Connecticut ranks second in the nation in the percentage of its workforce in the financial industry, just behind Delaware and ahead of New York, Arizona and Nebraska, according to data compiled last month by the U.S. Bureau of Labor Statistics. In Connecticut, 7.9 percent of the workforce is employed in financial industries, which includes finance, insurance and real estate. The data is collected as part of the Current Employment Statistics (CES) program, a monfinancial imagethly survey of about 141,000 businesses and government agencies which provides detailed industry data on employment, hours and earnings of workers on nonfarm payrolls.

Delaware’s 10.3 percent tops the list of states, ahead of Connecticut’s 7.9 percent. The state’s percentage stayed between 8 percent and 9 percent for much of the past decade, dropping below 8 percent for the first time in May 2013. It has been at either 7.9 percent or 8 percent since then in the monthly reports. Between May 2010 and May 2014, Connecticut’s had the second largest decline among states in the percentage of workforce in the financial industry, with a reduction of 0.4 percent, exceeded only by Oregon’s 0.5 percent.

The states with the smallest percentage of workforce in the financial industries are Alaska, Vermont, Mississippi, Wyoming, West Virginia and Arkansas. Washington D.C. also has among the lowest percentages of population employed in the financial industries.

The U.S. average is 5.5 percent.

In terms of growth of the financial industry sector within a state’s workforce, the leading states are New Mexico, Montana,, West Virginia, and Delaware, among the13 states where there was an increase between May 2013 and May 2014. Connecticut was among 21 states were the percentage was virtually identical this year as compared with a year ago.

Feds Disband National Blueway Program, CT River is Sole Survivor

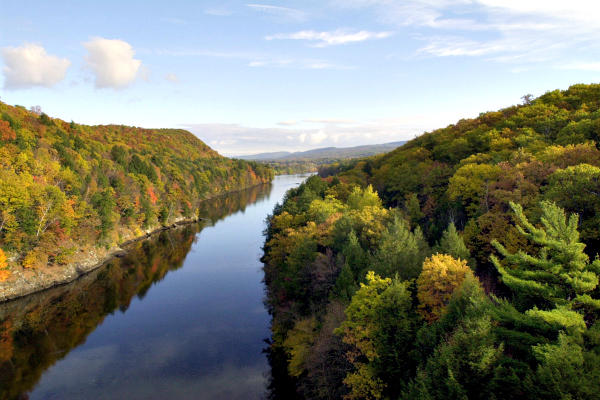
It seemed like a good idea at the time. U.S. Secretary of Agriculture Ken Salazar designated the Connecticut River as the nation’s first National Blueway, in recognition of conservation efforts underway. That was two years ago – the first of what was intended to be a series of similar designations across the country. Fast forward to 2014. The fledgling federal program was abruptly discontinued by current Ag Secretary Sally Jewell, after a departmental review. Since it’s auspicious start, only two official designations were made.

The first was the Connecticut River, which runs through Connecticut, Massachusetts, Vermont and New Hampshire. The second was the White River, which spans more than 700 miles through Missouri and Arkansas. But that second designation was revoked after local opposition. And now the entire program is history, with the Connecticut River grandfathered in as the short-livCT RIVERlogoed program’s sole survivor.

The National Blueways System wConnecticut Riveras created in May 2012 under President Barack Obama’s America’s Great Outdoors Initiative. The program was voluntary, didn’t include any new regulations, and a designation brought no additional funding, the Associated Press has reported. It was intended to promote watershed conservation and support sustainable and healthy water supplies.

Federal officials insisted the program would not include any new protective status or regulations, but opponents in Missouri and Arkansas — largely conservative groups — weren’t convinced, the AP reported. Published reports indicated that some feared the conservation recognition program would lead to increased regulation and land seizures. That led first to the revocation of the White River designation last summer, followed by the end of the entire initiative earlier this year.

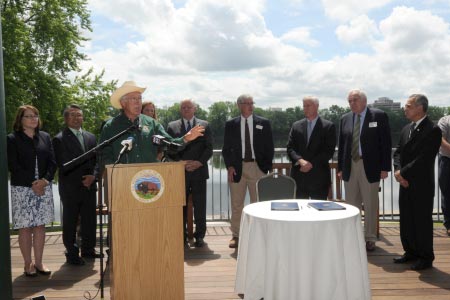
In riverfront ceremonies in Hartford on May 23, 2012, Interior Secretary Salazar designated the 410-mile-long Connecticut River as America's first National Blueway, saying restoration and preservation efforts on the river were a model for other American rivers. The blueway designation was intended to support existing local and regional conservation, recreation and restoration efforts, and does not establish a new protective status or regulations for a river, Salazar said at the time.

He was joined at Riverside Park in Hartford by U.S. Sen. Richard Blumenthal; U.S. Rep. John Larson; Principal Deputy Assistant Secretary of the Army Terrence “Rock” Salt; Friends of the Silvio O. Conte Refuge Chairman Patrick Comins and other members of the conservation and business communities. designation announcement

That would be the program’s high water mark, so to speak.

“The National Blueways Committee will be deactivated, but the department will continue to encourage collaborative, community-based watershed partnerships that support sustainable and healthy water supplies,” a department spokeswoman told the AP this year, explaining the department’s decision to end the program. She reiterated that the Connecticut River will maintain the National Blueway designation it received two years ago – and now will be the only one in the country.

CT Teacher Shortage Areas Identified For Next School Year

If you’re looking to pursue teaching in Connecticut schools, the State Department of Education (SDE) provides a road map of where the demand is likely to be greatest. SDE has announced the Certification Shortage Areas for 2014-15 for Connecticut schools, and virtually all reflect continued areas of shortage – with only one new entry on the list. The subjects identified are:Teacher-Classroom-Bing

  1. world languages, 7-12;
  2. bilingual education, PK-12;
  3. school library and media specialist;
  4. speech and language pathologist;
  5. technology education, PK-12;
  6. comprehensive special education, K-12;
  7. science, 7-12;
  8. Teachers of English to Speakers of Other Languages, PK-12;
  9. intermediate administrator;
  10. mathematics, 7-12;

Each year in the fall, SDE surveys certified educational positions to determine the number of teaching and administrative vacancies that existed before the state of the school year, and the vacancies that remained after the start of school. Results from the survey are used to determine the shortage areas for the following school year – in this case, for 2014-15. Nine of the 10 shortage areas identified for 2014-15 were also shortage areas in the previous year. TESOL (Teachers of English to Speakers of Other Languages), PK-12 will be the only new shortage area in the 2014-15 school year.

The shortages may get worse before they get better.

The SDE report also indicated that 18.2 percent of all certified staff who were employed as of October 2013 are eligible for retirement. Over the next five years, the report indicated, “this percentage will increase to 26.9 percent. It is significant that a number of the shortage areas also have particularly high percentages of teachers who will be eligible for retirement over the next five years.”

The survey noted that 61 percent of positions that remained vacant on October 1 were due to the lack of qualified candidates, a level that is unchanged from the previous year. The most frequent reason cited for not identifying a qualified candidate was “late postings that affected the size and quality of the applicant pool.”

The Data Bulletin that detailed the survey findings was developed by the Performance Office of the Bureau of Data Collection, Research and Evaluation within SDE.

Hartford’s Health & Fitness Ranks #12 Among Nation’s Top 50 Metro Regions

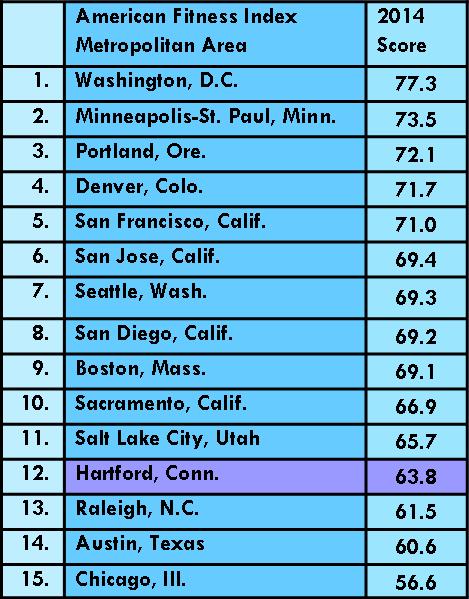
Apparently, Hartford is in better shape than many of us may have thought. In fact, a national analysis by the American College of Sports Medicine (ACSM), with support from the Anthem Blue Cross and Blue Shield Foundation, ranks the metropolitan statistical area (MSA) of Hartford-West Hartford-East Hartford as 12th in the nation in the annual American Fitness Index™ (AFI) report. The 2014 AFI data report, “Health and Community Fitness Status of the 50 Largest Metropolitan Areas,” reflects a composite of preventive health behaviors, levels of chronic disease conditions, and community resources and policies that support physical activity.

In the 2014 report metropolitan Hartford received a score of 63.8 (out of 100 possible points) to earn the overall #12 ranking. Hartford ranked #7 in Community Health and #17 in Personal Health, according to the data analysis.logo

Leading thwalkinge rankings is the Washington, D.C., metro area with a score of 77.3, followed by Minneapolis-St. Paul, Portland, Denver, San Francisco, San Jose, Seattle, San Diego, Boston Sacramento and Salt Lake City.
Researchers analyzed the data from the U.S. Census, the U.S. Centers for Disease Control and Prevention’s Behavioral Risk Factor Surveillance System (BRFSS), The Trust for the Public Land City Park Facts and other existing research data in order to give a scientific, accurate snapshot of the health and fitness status at a metropolitan level.

The data regarding Hartford-Westfitness chart Hartford-East Hartford indicate that 78 percent engaged in physical activity or exercise within the past 30 days, 35 percent eat two pieces of fruit per day, and 14 percent eat 3 or more vegetables per day. Just over 15 percent of the population are smokers. Overall, 60 percent are described as being in “excellent or very good health,” although 36 percent indicate they had days when their “mental health was not good” during the past month.

Among the “areas of excellence” cited for Hartford-West Hartford-East Hartford are a higher percent bicycling or walking to work, more farmers’ markets per capita, more golf courses and tennis courts per capita and a higher percent eating two or more fruits per day.

ACSM worked with the Indiana University School of Family Medicine and a panel of 26 health and physical activity experts on the methodology of the AFI data report. The 2014 edition uses revised methods from the first six full-edition reports released from 2008 to 2013.

New variables, including each community’s Walk Score ranking, have been added or modified and some variables have been removed to improve and enhance the 2014 data report.

“The AFI data report is a snapshot of the state of health in the community and an evaluation of the infrastructure, community assets and policies that encourage healthy and fit lifestyles. These measures directly affect quality of life in our country’s urban areas,” said Walter Thompson, Ph.D., FACSM, chair of the AFI Advisory Board.

The American College of Sports Medicine is the largest sports medicine and exercise science organization in the world. More than 50,000 international, national and regional members are dedicated to advancing and integrating scientific research to provide educational and practical applications of exercise science and sports medicine.