Caregiving Is Critical Issue as "Incredible Demographic Transformation" Continues, Aging Report Stresses

The United States continues to experience “incredible demographic transformation,” according to the Final Report of the White House Conference on Aging (WHCOA), a year-long, nationwide endeavor throughout 2015. In Connecticut, with the nation’s 7th oldest population, input was provided by legislative and executive branch agencies, which held hearings and offered expert testimony from organizations including AARP, the state Department on Aging, Legislative Committee on Aging and Commission on Aging. “No topic attracted more attention in the lead-up and follow-up to the 2015 WHCOA than caregiving. It echoed across all four of the conference issue areas,” the report indicated, referencing the four common themes that emerged as particularly important to older Americans: Retirement Security, Healthy Aging, Long-Term Services and Supports, and Elder Justice.cover  The final report noted the participation, at the Boston Regional Forum, of Connecticut’s Commissioner of the Department of Public Health, Jewel Mullen.

Among the findings in the report, issued by the White House, that will demand the attention of policy makers in the next decade:

  • Over 10,000 baby boomers are turning 65 every day, and the fastest growing demographic in the U.S. is women over age 85. The proportion of older adults representing racial and ethnic minorities is also increasing rapidly.
  • There is a need to break down the silos between housing, transportation, health care, and long-term services and supports in order to support healthy aging. The United States must also take advantage of an “increasing array of web-based technologies, robotics, and mobile devices” that “help older adults access the services they need, stay connected to family and friends, and remain active and independent.”
  • The majority of assistance for older Americans is generally provided at home by informal caregivers, especially family and friends, and are often the “primary lifeline, safety net, and support system for older adults.” Although rewarding, caregiving can be demanding, and “informal caregivers need to be supported and sustained with appropriate resources.”
  • With family structures changing as Americans are having fewer children and increasingly moving away from families of origin, the availability of family members to provide care is diminishing. “Direct care is a demanding profession with low wages, long hours, and limited benefits. It is critical for there to be efforts to recruit and retain a sufficient number of direct-care workers to keep pace with the growing need.”chart

The White House has held a Conference on Aging every decade, beginning in 1961, to identify and advance actions to improve the quality of life of older Americans. In 2015, the United States marked the 50th anniversaries of Medicare, Medicaid, and the Older Americans Act, as well as the 80th anniversary of Social Security. The White House Conference on Aging provided "an opportunity to recognize the importance of these key programs as well as to look ahead to the next decade."

At a public hearing in May at Connecticut's Legislative Office Building, state officials noted that Connecticut is undergoing a “permanent and historic transformation” in its demographics.  Statistics released as part of the WHCOA report echoed that observation.

65-600x249On July 13, 2015, President Obama hosted the sixth White House Conference on Aging, joining older Americans and their families, caregivers, and advocates at the White House and virtually through hundreds of watch parties across the country.

The July event built on a year-long dialogue; the White House Conference on Aging launched a website to share regular updates on its work and solicit public input; engaged with stakeholders in Washington, D.C. and listening sessions throughout the country; developed policy briefs on the emerging themes for the conference and invited public comment and input on them; and hosted regional forums with community leaders and older Americans in Tampa, Florida; Phoenix, Arizona; Seattle, Washington; Cleveland, Ohio; and Boston, Massachusetts.  Additional hearings, including those in Connecticut, were shared with conference officials.  Individuals and groups participated via live webcast in watch parties held in every State and were able to ask questions of panelists and others via Twitter and Facebook.

The Final Report, completed in late December and publicized by the White House this week, now goes to policy makers at the federal and state level to review findings and consider policy actions to respond the critical issues cited as requiring attention.

ph-whcoa-blog-collage


Average Age of Mothers Increasing in CT and Nationwide, Federal Data Reveals

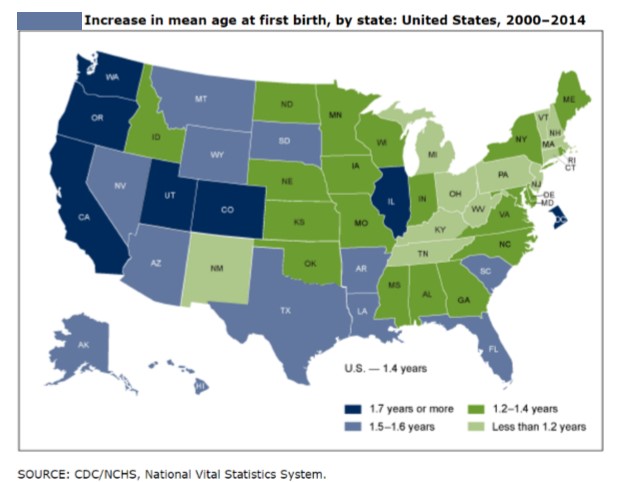
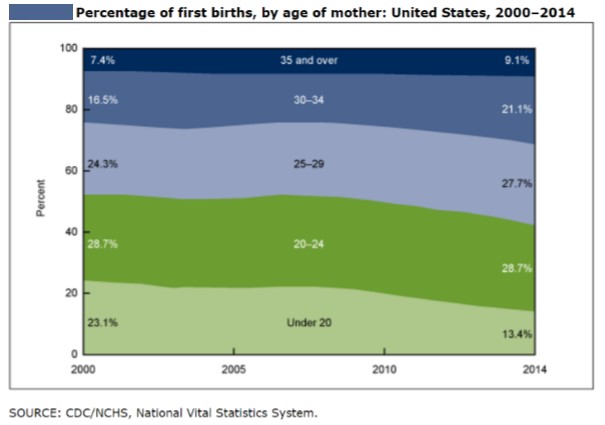
First-time mothers are older than ever, new federal data has revealed.  Since 2000, the average mother’s age at the birth of her first child has increased in every state in the nation, rising 1.9 years or more in D.C., California, Oregon, and Utah, while increasing by less than a year in Connecticut, Michigan, New Hampshire, and West Virginia. Overall, the average age of mothers has increased from 2000 to 2014 for all birth orders, with age at first birth having the largest increase, up from 24.9 years old in 2000 to 26.3 years in 2014, according to newly released data compiled by the Centers for Disease Control and Prevention.  Connecticut is among a dozen states with the smallest increases in the average age of first-time mothers. graph

The federal agency points out that “a mother's age at birth, and particularly the average age when a mother has her first child, is of interest to researchers and the public. Mean age can affect the total number of births a mother has over a lifetime, which in turn impacts the composition and growth of the U.S. population. Age of mother is associated with a range of birth outcomes, such as multiple births and birth defects, the agency noted.

The largest factor in the rise a mother’s average age when her first child is born is the decline in the proportion of first births to mothers under age 20, down 42 percent from 2000 to 2014, or from approximately 1 in 4 births to 1 in 7.

Increases in the average age for all birth orders were most pronounced from 2009 to 2014, according to the data.  While the average age at the birth of a mother’s first child was fairly stable for the first half of this time period, greater increases were observed from 2009 (25.2 years) to 2014 (26.3 years).new mom

Increases from 2000 to 2014 in average age for higher birth orders were less than those for first births, rising 1.4 years for first births, 1.0 years for second births, 0.8 years for third- and fourth-order births, and 0.5 years for fifth- and higher-order births.  As a result of the different rate of increases by birth order, the gap in the average age between sequential birth orders is less than previously. For example, the difference in a mother’s average age at first birth compared with the mean age at second birth was 2.8 years in 2000 and fell to 2.4 years in 2014.

States with larger increases (1.7 years or more) in the average age at first birth tended to be in the western United States (California, Oregon, Washington, Utah, and Colorado), the data indicated. Greater increases were also seen in Illinois, Arkansas, and D.C.

mapThe report emphasized that over the past several decades, the United States continued to have a larger number of first births to older women along with fewer births to mothers under age 20. “This trend and the more recent uptick in delayed initial childbearing can affect the number of children a typical woman will have in her lifetime, family size, and for the overall population change in the United States,” the federal agency pointed out.


This report contains data from the birth data set, which is part of the National Vital Statistics System (NVSS). NVSS contains all live births reported in the United States. The birth data set is the primary data set for analyzing birth trends and patterns in the United States.


PERSPECTIVE: Gun Reforms vs. Gun Servants

by Dick Polman Why do Republicans nauseatingly refuse to address America's gun murder epidemic? Why are they so determined to sustain our well-earned reputation as the most violent nation in the civilized western world? Why are they jerking their knees in reflexive opposition to President Obama's modest attempts to defend our right to remain alive?

Of course we know why. It's Obama hatred and gun lobby love.

You would think, judging by their tiresomely predictable reactions, that Obama is poised to dispatch an army of flying monkeys to swoop into American homes and spirit away the 270,000,000 guns that we apparently hold dear.PageLines- CTperspective.jpg

But this fever swamp rhetoric is flatly contradicted by reality. Obama is basically tweaking existing gun laws to make them work better. Which is exactly what Republicans have been urging all along.

For instance, the federal background check system is notoriously understaffed and under-financed. Under federal law, if the FBI can't complete a check within three days, the buyer gets his gun without the check having been completed. That's what happened last year in Charleston, South Carolina. Remember the white racist terrorist who killed nine people at the historic black church? He got his gun because the understaffed feds didn't obtain his criminal record within the mandated three days.

So Obama is beefing up the background-check system - directing more money and manpower to weed out the criminals and mentally ill. Plus, he's earmarking an extra $500 million to mental-health services, to better help those who have woes between their ears.

Yet the Republicans don't like any of that.

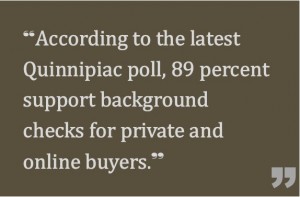
Obama also took action to close loopholes in existing laws - most notably, the one that allows people to buy guns, without any background screening, from private sellers and online sellers. Isn't it logical to tweak existing laws so that everybody gets screened prior to buying bang-bangs? The American public certainly thinks so; according to the latest quoteQuinnipiac poll, 89 percent support background checks for private and online buyers.

The Republicans don't want any of that, either.

Requiring shippers to report stolen guns - that makes sense, too. Investing in advanced technology so that kids can't accidentally pull gun triggers - that makes sense, too. And yet, not a single Republican has spoken up to say, hey, that's a good idea.

Instead, all we got was the usual pap, plus a lot of whining about Obama's alleged kingly behavior. They're basically complaining that Obama is doing end-runs around the Republican Congress, somehow forgetting that the Republican Congress is invested in doing the gun lobby's business by doing nothing. Just last month, in fact, it squashed a bill designed to beef up background checks.

Kathleen Parker - the center-right political columnist, no friend of Obama's - says it well on Wednesday: "In fairness to the gun lobby, which may not deserve such charity, one can understand reservations about limiting access to guns. What is less easily understood is the refusal of Republicans to take the reins of any given issue and do something constructive rather than invariably waiting to be forced into the ignoble position of 'no.' It is one thing to be in the pocket of the National Rifle Association. It is another to do nothing and then assume a superior posture of purposeful neglect, as though do-nothingness were a policy and smug intransigence a philosophy."

Can Obama's executive actions substantially curb our annual gun murder epidemic? No way. We have too many guns in circulation for that to happen. He freely acknowledged that on Tuesday, saying, "We know we can't stop every act of violence, every act of evil in the world.  But maybe we could try to stop one act of evil, one act of violence."

There it is - the desire to save at least a few of the lives that would otherwise be lost. Doing something to dent the death toll sure beats thoughts 'n' prayers.

Or to paraphrase the Talmud, "He who saves a single life, saves the world entire."

__________________________________________

Dick Polman is a former columnist at The Hartford Courant and was founding editor of The Hartford Advocate.  He is the national political columnist at NewsWorks/WHYY in Philadelphia and a "Writer in Residence" at the University of Pennsylvania. Email him at dickpolman7@gmail.com. Copyright 2016 Dick Polman, distributed exclusively by Cagle Cartoons newspaper syndicate.

PERSPECTIVE commentaries by contributing writers appear each Sunday on Connecticut by the Numbers.

Ten Percent of CT Community College Students Earn Bachelor's Degree, Below National Average, 30th in U.S.

Nationally, only 14 percent of community college students go on to earn a bachelor’s degree within six years.  In Connecticut, that percentage is even lower – 10 percent.  That’s the finding in a new study measuring states’ effectiveness at helping community college students attain four-year degrees. In the best-performing states—Wyoming, Montana, and Maryland—nearly 20 percent of community college students earned a bachelor’s within six years. But in several states, bachelor’s completion rates were in the single digits. Connecticut ranked 30th out of 43 states.  The study was released this week by the Community College Research Center at Teachers College, Columbia University.  tackling transfer

As the cost of higher education continues to grow, the role of considerably less-expensive community colleges - and their success at helping students earn an associate’s degree and continue in higher education is receiving more scrutiny.  The study concluded that "transfer outcomes depend on what community colleges and 4-year colleges do to teach and support their students."  The data also indicated that 36 percent of higher income students transfer to a 4-year school while 28 percent of low-income students do.  A diminishing percentage complete the requirements for a bachelor's degree after transferring.

The study’s analysis indicated that for “students who plan to transfer to a four-year college, there too often is no clear path through the thicket of choices at the community college and across the divide to the four-year school. Though as many as 80 percent of new community college students want to get a bachelor’s degree, only about 14 percent transfer and graduate within six years.”

The Connecticut State University and College System has developed a Transfer and Articulation Program (TAP) aimed at “ensuring Connecticut community college students complete degree programs that transfer to the Connecticut State Universities and Charter Oak State College “without either losing or generating excess credit.”Community-College-Research-Center

Under the new plan, students attending any of the state’s 12 community colleges enrolled in the program would complete the first 60-63 credits at a community college and the final 60-63 credits at one of the state universities (Central, Eastern, Southern or Western).  The program, which launches for students entering college in the Fall 2016 semester, will allow students to select from “over 20 concentrations that prepare them to complete four-year bachelor’s degrees.”

CSCU logoThe first TAP pathway—Biology—was approved by the Board of Regents last month, “after careful review by TAP's Framework Implementation and Review Committee (FIRC) and curriculum committees on all 17 CSCU campuses.”  Additional pathways are slated to be determined beginning next month, with a total of 11 initially to be selected.  Possible subject areas include history, chemistry, communication, criminology, English, math, political science, psychology, social work and sociology, according to the state Board of Regents website.

“This research tells Connecticut that far too many community college students are failing to meet their higher education goals,” said Davis Jenkins, a senior research associate at the center, told the Connecticut Post. The TAP program aims to help address that. The study found that students who can tranfer 90 percent of their crfedits are 205 percent more likely to earn their bachelor's degree, compared to those who transfer half or less.  transfer

The study looked at the outcomes of more than 700,000 degree-seeking students nationwide who entered higher education through a community college in fall 2007, providing evidence about where students are getting stuck in particular states.

Some states, such as Oklahoma, had above-average rates of transfer out of community colleges but low transfer-student graduation rates at four-year schools. In others, such as Washington, community colleges transferred out relatively few students, but relatively high numbers of those who transferred earned bachelor’s degrees. In the states where more community college entrants earned bachelor’s degrees, both rates tended to be high, according to the study’s authors.

10 percentThe study also found that “the student demographics at community colleges appear to matter less than how the colleges serve students aiming to transfer. Regardless of whether they are rural or urban, or serving mostly lower or higher income students, community colleges can boost the transfer success of their students by looking to better performing schools to inform their practices.”

Housed at Teachers College, Columbia University, CCRC strategically assesses the problems and performance of community colleges in order to contribute to the development of practice and policy that expands access to higher education and promotes success for all students.


https://youtu.be/Fg61rj6kO-o


Background Checks Up 71 Percent in Past Five Years in CT, 12th Highest Increase in U.S.

Between 2010 and 2015, the number of background checks in Connecticut related to the purchase of firearms grew by 71.4 percent, ranking Connecticut 12th in the nation in the increase in background checks, according to data compiled by Bloomberg.  The number of background checks during the five-year period increased in every state in the nation, except Utah. In Connecticut in 2010, there were 179,595 background checks conducted as part of the process of purchasing  a firearm.  In 2015, that number had increased to 307,750 during the year, the data compiled by the National Instant Criminal Background Check System (NICS) revealed.gun stats graphic

The states with the largest increased in the number of background checks, from 2010 to 2015, were Indiana (211% increase), Delaware (162%), Alabama (139%), California (115%), District of Columbia (112.6%), Florida (105.1%), Wisconsin ((96.8%) Ohio (90.3%), Illinois (79.4%) and New Jersey (78.2%).

Overall, the largest number of background checks occurred in Kentucky, with 3.2 million.  California conducted 1.7 million, Texas 1.5 million, Illinois 1.2 million, and Wisconsin 1.1 million.

The Bloomberg news website ranked the 50 states and the District of Columbia by the percentage increase in number of NICS firearm background checks from January 1, 2010 through December 31, 2015. NICS is the National Instant Criminal Background Check System.background-check

In six jurisdictions – the states of Indiana, Delaware, California, Alabama, Florida and the District of Columbia – the number of federal firearm background checks more than doubled from 2010 to 2015.

Because of varying state laws and purchase scenarios, the statistics do not represent the number of firearms sold, the data analysis indicated.


$80,000 in Grants Boost Preservation Initiatives in 7 CT Communities

Connecticut Main Street Center (CMSC), the downtown revitalization and economic development non-profit, has selected seven organizations and municipalities to receive a share of $80,400 in 2016 Preservation of Place grants. The grants will be used to provide communities in Bridgeport, Canton, Haddam, Fairfield, New Britain, New Haven (Westville Village) and Simsbury with targeted resources to increase their capacity to plan for preservation and revitalization initiatives in their downtowns and neighborhood commercial districts. place

This year's awards are notable because two applicants, Canton and New Britain, sought the grant funds to pursue the creation of tax increment financing (TIF) districts, made possible through the passage of legislation in 2015 that was proposed by a coalition led by CMSC. TIF is a financing mechanism in which an investment in a specified area is repaid over time using the increased tax revenue generated by the investment.

"The projects funded through this year's Preservation of Place round have the potential to be transformative for these communities," said John Simone, CMSC's President & CEO.  "Canton and New Britain may very well become the models for creating successful TIF districts, while Haddam's award can help set the foundation for a unified, mixed-use commercial area that marries their historic charm with a modern, connected design. Certainly, all of the communities represented are as diverse in location as in their unique character, but each has something wonderful to offer, which will only be enhanced through the use of these grant funds."

The Preservation of Place grant program provides a source of funding for new initiatives that can be integrated into, and leverage, comprehensive Main Street preservation and revitalization programs.  The funds are meant to be flexible to meet individual community need.

The 2016 recipients of Preservation of Place grant funds are:BPT creates

  • Bridgeport Downtown Special Services District - Awarded $10,400 for Bridgeport CREATES, Phase II, to assist in the pre-development activities associated with the creation of a Maker Space/ Innovation Center.
  • Town of Canton - Awarded $10,000 for a Tax Increment Financing Master Plan for Collinsville Center & the Collins Company Complex to develop a viable TIF agreement, master plan and district to help develop the historic complex.
  • Town of Haddam - Awarded $10,000 for a Market Analysis & Village District Zoning Regulations for Tylerville in order to assess viable businesses and draft zoning regulations that will allow for and promote such businesses, as well as mixed-use development, in this historic area.
  • Town of Fairfield - Awarded $10,000 for a Signage & Wayfinding Program for Downtown & Neighboring Commercial Districts to help visitors and residents navigate their way around downtown Fairfield's many prominent cultural, tourist and academic attractions.
  • New Britain Downtown District - Awarded $10,000 to work in conjunction with the City on the Creation of a Tax Increment Financing District for transit oriented development around the CTfastrak terminus.
  • Westville Village Renaissance Alliance (New Haven) - Awarded $20,000 for the Westville Village Comprehensive Plan: The Visioning Phase, a comprehensive plan to guide a sustainable and place-based approach to long-term economic and physical development.
  • Simsbury Main Street Partnership - Awarded $10,000 for a Comprehensive Parking Study of Downtown to develop specific parking recommendations, including short- and long-term solutions.

Since 2008, the Preservation of Place grant program has leveraged over $1 million of investment in local Main Street initiatives. Connecticut Main Street Center and the Preservation of Place grant program receive support from the State Historic Preservation Office, with funds from the State of Connecticut through the Community Investment Act.

Advertisers Target Hispanic and Black Youth with Unhealthy Snack Ads, UConn Center Study Finds

The University of Connecticut’s Rudd Center for Food Policy & Obesity is calling on media companies to “set nutrition standards” for snack ads aimed at children and teens and “stop targeting advertising high-calorie, nutritionally poor foods to all young people,” but “especially advertising aimed at Black and Hispanic youth.” The recommendations come in the wake of a report that found that Black and Hispanic children “are exposed to more food advertising than white non-Hispanic children” and much of it is for unhealthy foods that have a greater likelihood of adversely impact children’s health.rudd-logo-300x77

The Rudd Center’s report, Snack Facts, found that Black children saw 64 percent more snack food ads on TV compared to white children, and Black teens viewed 103 percent more compared to white teens.  The disparity, according to the report issued last fall, had increased between 2010 and 2014, the most recent year studied.  “FACTS” is an acronym for “Food Advertising to Children and Teens Score.”

The findings also indicated that in addition to a barrage of advertising for unhealthy snacks, Black children and teens saw approximately 50 percent and 80 percent more ads for healthier fruit and yogurt brands – although the positive findings were generally outdistanced by findings of concern.  Black children also saw 99 percent more ads for savory snacks and Black teens saw 129 percent more, compared with white children and teens.spanish snak ads

From 2010 to 2014, TV ads for savory snacks (salty or spicy) viewed by black children increased 48 percent and ads viewed by black teens increased 95 percent.  “Given that youth of color suffer from higher rates of obesity and other diet-related diseases,” the Rudd Center indicated, “snack food advertising likely exacerbates health disparities affecting their communities.”

Two-thirds of 2- to 5 year-olds and more than half of youth ages 6 to 19 report having three of more snacks per day, and Americans are spending more on snacks – an increase of more than $100 million from 2012 to 2015, according to data cited in the report.

The Rudd Center report found that snack advertising on Spanish language television had changed dramatically between 2010 and 2014, and not for the better:

  • Yogurt advertising declined by 93 percent, and not one fruit brand advertised on Spanish-language TV in 2014.
  • Spending on savory snack ads (salty/spicy snacks) skyrocketed 551 percent and sweet snack ads rose 30 percent.
  • Ads for unhealthy snacks comprised 88 percent of snack food ads viewed by Hispanic children on Spanish-language TV in 2014, a dramatic jump from 39 percent in 2010.

The 102-page report reviewed the advertising practices of specific companies in the snack food industry, and highlighted changes in advertising emphasis.  It also tracked trends in advertising on social media.  The advertising analysis examined 90 brands spending more than$1 million in total advertising in 2014 from 43 different companies, according to the report. chips

The report suggested that “media companies could provide lower rates for advertising that promotes nutritious foods,” noting that aggressive marketing of unhealthy snack foods to children and teens exacerbates the crisis of poor diet and related diseases among young people.”

Snack FACTS examined the nutritional quality and advertising for 90 snack food brands offered by 43 companies that were marketed to U.S. children and teens on TV, internet, and in schools in 2014. Researchers analyzed healthier snacks, including yogurt, fruit, and nuts, as well as unhealthy snacks, including sweet and savory snacks such as cookies, chips, and fruit snacks, comparing 2010 and 2014 when possible.

The report also indicates that “companies have recognized the business opportunity in marketing healthy snacks to young people,” and urges those companies to respond in children and youth’s best interest.

The Rudd Center for Food Policy & Obesity, which affiliated with UConn a year ago after a decade at Yale University, is a non-profit research and public policy organization devoted to improving the world’s diet, preventing obesity, and reducing weight stigma. The Rudd Center is described as “a leader in building broad-based consensus to change diet and activity patterns, while holding industry and government agencies responsible for safeguarding public health.”  Research related to the report was funded by a grant from the Robert Wood Johnson Foundation.snack food

CT Ranked 14th Among Smaller States for Small Business Activity; MA Is 2nd Among Large States

Small business activity is on the rise in 49 of the 50 U.S. states, according to a new report from the Kauffman Foundation. The report provides a broad index measure of small local business activity, analyzing the states in peer groups of the 25 largest states by population and the 25 smallest states by population.  Connecticut ranked 14th among the smaller 25 states, for the second consecutive year, and was the lowest-ranked New England state.CT rank The density of established small businesses per 100,000 residents increased slightly from the previous year, from 1,147.3 to 1,167.4 in 2015.  Established small businesses are defined in the study as businesses over the age of five employing at least one, but less than fifty, employees.  The rate of small business ownership also grew slightly in Connecticut, from 6.14 percent to 6.34 percent.

Demographic trends for Connecticut noted in the report indicate an increase in native-born small business ownership, and upticks in the percentage of small businesses led by Latinos, 55 to 64 year-olds, 35-44 year-olds, high school graduates and college graduates.  More small businesses are run by men than women.

Overall, what the report describes as “Main Street entrepreneurial activity – an indicator of the number of established small businesses and the number of business owners in a location – experienced a large increase in 2015, reversing a six-year downward and stagnant trend in the U.S.”Kauffman logo

"Following a post-recession downward and stagnant trend in small business activity, we're now seeing Main Street Entrepreneurship begin to rise," said E.J. Reedy, director in Research and Policy at the Kauffman Foundation. "This obviously is good news given that these small businesses make up 63 percent of all employer firms nationally."

The Kauffman Index: Main Street Entrepreneurship State Trends report includes these findings:

Among the 25 largest states, the five states with the highest activity were Minnesota, Colorado, Massachusetts, New York and New Jersey. Among the 25 smallest states, the states with the highest activity were Vermont, Montana, North Dakota, South Dakota, Wyoming, Maine, Nebraska, New Hampshire, Rhode Island, Iowa, Oregon, Idaho, and Kansas.

Insights on business owner demographics for the 25 smallest states, including Connecticut:

  • States with the highest rates of female business owners were Vermont, Montana, Wyoming, Oregon, and South Dakota.
  • States with the highest rates of older adult business owners (ages 55-64) were South Dakota, Vermont, North Dakota, Montana and Nebraska.
  • States with the highest rates of young adult business owners (ages 20-34) were South Dakota, North Dakota, Montana, Wyoming and Vermont.

state ranksTennessee is the only state that did not show an increase in established small business activity in 2015 compared with 2014.


The new Main Street Entrepreneurship Index is an indicator of small business activity, presenting trends over the past two decades, focusing on established small businesses (firms older than five years with less than 50 employees) and trends in ownership rates. The Index measures business activity along two distinct and complementary dimensions: the rate of business owners in the economy – the percentage of adults owning a business in a given month, and established small business density – the ratio of established small employer businesses compared to population.

The Kauffman Index of Entrepreneurship is the first and largest index tracking entrepreneurship across city, state and national levels for the United States, and also presents demographic characteristics of the business owners.

In a companion study and report, focusing on the nation’s largest metropolitan areas, Small business activity is on the rise 38 of the top 40 largest metropolitan areas, the top five metropolitan areas for small business activity as measured by the Index were New York, Boston, Providence, San Francisco and Portland.  The report on metropolitan areas noted that “the one to experience the biggest increase in rankings was Providence, which moved up three spots to tie with Boston for second place in the 2015 Index.”

Whalers Departing Attendance, Carolina's Recent Attendance, Among NHL's Lowest (Hartford Higher)

During the 2014-15 National Hockey League season, the teams with the lowest average home attendance were the Arizona (13,345), Carolina Hurricanes (12,594) and Florida Panthers (11,265). So far in the current season, through 23 home games, the attendance for Hurricanes games has sunk even lower, averaging 11,390, lowest in the league.  They are the only team in the league to draw less than 13,000 fans per game. Hartford_Whalers_Logo.svg

Fifteen years ago, during the 2000-01 season, the attendance numbers weren’t much better.  Carolina had the league’s second lowest attendance, drawing an average of 13,355 per game for 41 home games.  That ranked 29th in a 30-team league.

That was also only a handful of seasons after the teams’ move South, ending their 18-year history as the Whalers in Hartford, moving to Greensboro, North Carolina and becoming the Carolina Hurricanes for the start of the 1997-98 season.

In the 30-team league, during the past 15 years, Carolina has been among the league’s bottom-third in  average attendance eight times, and the bottom-half every season but one.  In 2006-07, the team ranked 15th in the league, their high-water mark.  It was the season after the team won the league’s Stanley Cup.   (The 2004–05 NHL season was not played due to a labor dispute.)

Those attendance number aren’t significantly different that the attendance levels when the team abruptly departed Hartford, nearly two decades ago.  In early 1996, a 45-day “SNHL logoave the Whale” season-ticket drive resulted in 8,300 season tickets sold, about 3,000 more than the previous year.  In the aftermath of the season ticket drive, and heading into the 1996-97 season, the Whalers management said they would remain in Hartford for two more years, in accordance with their lease.
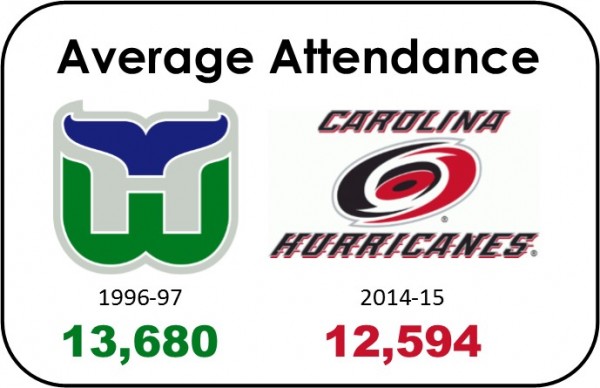
In the Whalers' final season in Hartford, 1996-97, attendance at the Hartford Civic Center had grown to 87 percent of capacity, with an average attendance of 13,680 per game.  Published reports suggest that the average attendance was, in reality, higher than 14,000 per game by 1996-97, but Whalers ownership did not count the skyboxes and coliseum club seating because the revenue streams went to the state, rather than the team.  Attendance increased for four consecutive years battendenceefore management moved the team from Hartford. (To 10,407 in 1993-94, 11,835 in 1994-95, 11,983 in 1995-96 and 13,680 in 1996-97.)
During the team’s tenure in Hartford, average attendance exceeded 14,000 twice – in 1987-88 and 1986-87, when the team ranked 13th in the league in attendance in both seasons.

Last season’s top attendance averages were in Chicago (21,769), Montreal (21.286), Detroit (20,027), Philadelphia (19,270), Washington (19.099), Calgary (19,097), Toronto (19.062), Minnesota (190230 Tampa Bay (188230 and Vancouver (18,710).  The New York Rangers drew an average of 18,006, ranking 17th in the league in average attendance.

Florida’s attendance last year was a league-low 11,265; Arizona was 13,345 per game. The previous season, the New York Islanders, Columbus Blue Jackets, Dallas Stars, Florida Panthers and Arizona Coyotes all drew less than 15,000 fans to home games across the season.  So far this season, with about half the home games played, five teams continue average 14,000 fans per game or less.

On March 26, 1997, Connecticut Gov. John G. Rowland and Whalers owner Peter Karmanos Jr., who had purchased the team in 1994, announced that the Whalers would leave Hartford after the season because they remain far apart on several issues, with the main sticking points linked to construction of a new arena. The team agreed to pay a $20.5 million penalty to leave at the end of the season, a year before its commitment was to expire.

The final Whalers game in Hartford was on April 13.  Less than a month later, the Carolina Hurricanes were born, beginning play that fall in Greensboro while a new facility was built in Raleigh.  Efforts to bring the NHL back to Hartford since that day have been unsuccessful.

memories