CT Aerospace Industry Seeking Strong Presence at International Airshow
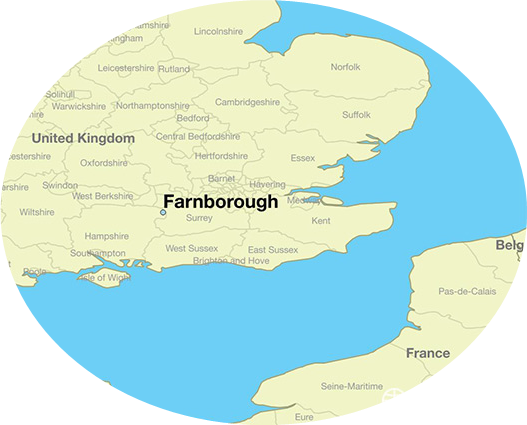
Described as “the largest industry event on the aerospace calendar,” the Farnborough International Airshow, to be held in mid-July in Great Britain, boasts more than 1500 exhibitors from more than 50 countries.  Among them will be a contingent from the State of Connecticut, if the state’s aerospace industry suppliers step up and sign on.  At the most recent Farnborough show, in 2016, $14.5 million in sales was reported by Connecticut exhibitors. The State Department of Economic and Community Development (DECD) and the Connecticut Center for Advanced Technology (CCAT)  have invited Connecticut aerospace manufacturers to participate in promoting the state’s world-class aerospace industry at the upcoming show, July 16-22, 2018.  Exhibit space is available on a first-come, first-served basis, with the cost per exhibit set at $11,000.

An anticipated 73,000 industry professionals “from across the globe and a range of aerospace sectors” are expected, including “key global influencers plus the latest thought leadership and industry insight,” according to organizers.  Farnborough’s news network will run a series of talks, panel discussions and seminars, and high-profile keynote speakers “will challenge current perceptions and provide ideas for the future.” Among the featured sessions will be “meet the buyer,” described as a structured approach to putting sellers in front of targeted buyers.

The biennial event is widely recognized for its role in connecting the worldwide aerospace market. It has traditionally been a backdrop for the announcement of multi-billion dollar deals, and for the launch of major innovations.

The state’s exhibit space is to include a prime location in the U.S. Pavilion, with Connecticut companies to receive allocated space to display graphics, literature and parts; pre-arranged B2B meetings at discount price; access to the U.S. Exhibitors Lounge and meeting rooms; company listing in two show directories and logistical support prior to the show and on-site.

Among the participating companies is Connecticut Coining, based in Bethel, a leading manufacturer of deep-drawn metal parts used in aerospace, medical, defense and high voltage tubes.  The 50-year-old company includes among its customers industry leaders manufacturing bellows, joints, bleed, duct (anti-ice, telescopic) assemblies as well as silencers, and crossover & oil cooler systems.

Satisfied Connecticut companies in 2016 include Windsor-based Aero Gear: “I have been trying to get a foot in the door with Rolls Royce for years. This air show allowed me to make the contacts necessary to develop them into a customer. The show was a home-run for Aero Gear,” said Doug Rose, who founded the company in 1982, developing expertise in the design, engineering and manufacturing of gears and gearbox assemblies for the global aerospace industry.

Countries including Mexico, Turkey and the U.S. will be vying for business alongside a significant European presence from Germany, France and Spain as well as the U.K.  Organizers say the 2018 edition will see the largest presence yet from China, with 70 per cent growth in participation since the 2016 show. Japan has increased its presence with a second Pavilion, joining Malaysia, Korea and Indonesia representing Asia.  It all comes just weeks after escalations in tensions among the world’s leading industrialized nations, reflected in the G7 meeting in Canada last week.

Focus on Preventing Driving Deaths During Deadliest Period

The period between Memorial Day and Labor Day is the time when motorists are more likely to be injured or killed in fatal crashes involving a teen driver.  It is described as the “100 deadliest days,” by the AAA Foundation for Traffic Safety. More than 1,000 people were killed in crashes involving teen drivers in 2016, according to the organization, a 14 percent increase compared to the rest of the year and a figure that equates to 10 people per day.

The two AAA Clubs in Connecticut -- AAA Northeast and AAA Greater Hartford -- gathered with Federal and State traffic safety advocates in Hartford to draw attention to the data in the hopes of reducing the numbers in the coming three month period.

"The number of fatal crashes involving teen drivers during the summer is an important traffic safety concern for AAA," says Fran Mayko, AAA Northeast spokeswoman.  “Research shows young drivers are at greater risk during this time, and have higher crash rates compared to older, more experienced drivers because of two factors: speeding and nighttime driving."

Over the last five years in Connecticut, there have been 44 fatal crashes involving teen drivers, including 12 last summer during the 100 "Deadliest Days" period. At least half of the crashes occurred after 9 pm, according to data obtained through UConn's CT Crash Data Repository, officials pointed out.

Although none of the victims in those 12 crashes was a teen driver, the driver's passengers or someone in another vehicle were either injured or killed. "Statistics shows these crashes affect everyone on the road, not just teen drivers or their parents," says Mayko. "Education, coupled with proper driver training and parental involvement, will help teen drivers become better, safer drivers on our roadways."

Based on 2016 National Highway Traffic Safety Administration data, the AAA Foundation research highlighted the following:

  • 36% of all motor teen driver vehicle fatalities occurred between 9:00 pm and 5:00 am;
  • There was a 22% increase in the average number of nighttime crashes per day involving teen drivers between May and September compared to the rest of the year;
  • 29% of all motor vehicle deaths involving a teen driver were speed-related;
  • 1 in 10 nighttime crash fatalities and 1 in 10 speed-related fatalities involved a teen driver.

Overall, Connecticut traffic deaths have been inching up for most of the past few years on average, mirroring a national trend.  Traffic deaths were down in 2017 to 284, according to the UConn Crash Data Depository, after  reaching an historic high of 311 in 2016, after a steady increase in the previous few years (278 in 2015, 248 recorded in 2014).  Nationally, traffic fatalities are the highest they’ve been since 2008.

AAA urges parents to discuss the higher risks teens face during the summer and to familiarize themselves with Connecticut's Graduated Drivers Licensing (GDL) laws and become actively involved in the learn-to-drive process involving their inexperienced teen.  To prepare for the summer drive season, AAA also encourages parents to:

  • Discuss early and often the dangers of risky driving situations with their teens;
  • Teach by example and minimize their own risky behavior when behind the wheel;
  • Make and enforce a parent-teen driving agreement that sets driving limits based on the state’s GDL.
  • Visit TeenDriving.AAA.com that offers tools such as interactive widgets, highlighting teen driving risks and state licensing information. An online AAA StartSmart program also offers parental resources on how to become effective in-car coaches and ways to manage their teen’s overall driving privileges.

The AAA Foundation for Traffic Safety is a not-for-profit, publicly funded research and educational organization, whose mission is to prevent traffic deaths and injuries by conducting research into their causes. It also educates the public about strategies to prevent crashes and reduce injuries when they do occur.


https://youtu.be/QmCJKvyXhEQ


Another Federal Agency Says School Buses Should Have Lap/Shoulder Belts; Most States, Including CT, Don't

The National Transportation Safety Board (NTSB) this week recommended to states that all new large school buses be equipped with both lap and shoulder seatbelts, the first time such a recommendation has been issued for the vehicles by the agency. The board also recommended requiring collision-avoidance systems and automatic emergency brakes on new school buses, but the follow-through on the recommendations falls to states and local jurisdictions.  The NTSB recommendation is not a federal requirement, and comes three years after a similar call by the National Highway Traffic Safety Administration (NHTSA). Connecticut, as most states, does not require lap and shoulder seat belts in school buses.

The NTSB recommendations, made to the 42 states, the District of Columbia, and Puerto Rico, all of which lack requirements for lap/shoulder belts on large school buses, were accompanied by a recommendation to the states of Florida, Louisiana, New Jersey, and New York to amend their statutes to upgrade their seat belts requirements from lap-only belts to lap and shoulder belts.

Connecticut’s legislature has previously debated a lap-and-shoulder belt requirement on school buses, but has failed to pass such a requirement, including, most recently, last year. Legislation that would have imposed a requirement in Connecticut, effective in 2022, failed to gain approval from the Transportation Committee after a public hearing.

Last summer, Nevada joined California, Florida, Louisiana, New Jersey, New York and Texas in enacting laws requiring seat belts. The law in Louisiana requires school buses be equipped with seat belts, but this is subject to appropriation for the purchase of such buses and the state legislature has not provided funding to trigger the requirement. Similar language in Texas’ law was removed in 2017, according to the National Conference of State Legislatures.

NTSB Chair Robert Sumwalt said at the close of Tuesday’s NTSB meeting this week, which included a review of two 2016 school bus crashes that killed 12 and injured 37, “The recommendations that we issued and reiterated today, if acted on, will help ensure that new school buses are manufactured with tried and true occupant protection such as lap-shoulder belts, as well as collision avoidance technology such as automatic emergency braking.”  The meeting was held just days after a school bus accident in New Jersey that killed a young student and teacher.

The recommendation comes three years after a similar stance from the then-Administrator of NHTSA, Mark Rosekind:  "The position of the National Highway Traffic Safety Administration is that seat belts save lives," Rosekind said in November 2015. "That is true whether in a passenger car or in a big yellow bus. And saving lives is what we are about. So NHTSA's policy is that every child on every school bus should have a three-point seat belt."

“The main hold up continues to be funding,” State Rep. Fred Camillo of Old Greenwich, who introduced Connecticut legislation to accomplish that objective, told CT by the Numbers last year.  Passage has been elusive here, and elsewhere, despite the change in position by NHTSA more than two years ago.  The federal agency previously viewed school buses as safe without seat belts, because of their construction.

That changed in 2015.  Since then, as Connecticut’s Office of Legislative Research noted in a 2016 report to the legislature, “NHTSA has been exploring ways to make seat belts on schools buses a reality.” NHTSA points out that seat belts have been required on passenger cars since 1968; and 49 States and the District of Columbia have enacted laws requiring the use of seat belts in passenger cars and light trucks.

The Connecticut Association of Public School Superintendents testified against the measure last year, calling for approval to be “postponed” until a series of questions – ranging from the use of bus monitors to the cost of seat belt maintenance to district liability from unused seat belts – could be answered.

The Connecticut Association of Boards of Education (CABE) – representing local elected school boards across the state – also voiced their opposition at a January 30, 2017 public hearing.  CABE officials expressed concern about “years of busses” that would “need to be replaced or retrofitted.”  They also noted that lap belts “would not work best for 5-year-olds and 18-year-olds alike.”  In addition, questions were raised about students who might “unclick the belt” and the liability of bus drivers if they did.

Camillo initially proposed the bill in 2011 after a Rocky Hill student was killed in a school bus crash.  Last year in Connecticut, in March, after a school bus accident in Canterbury sent five students to the hospital, public discussion on the pending proposal was renewed, but the legislature ultimately did not take action.  “This accident today is just another reminder that we really need to do something regarding this issue. We don’t want to wait for another tragedy to occur,” Camillo told the Norwich Bulletin.  Later that month, five people were injured after a crash involving a school bus in North Haven.

At NTSB, Robert L. Sumwalt was sworn in as chairman last August, after being nominated by President Trump and confirmed by the U.S. Senate. He began his tenure at the NTSB in August 2006 when President Bush appointed him to the Board and designated him as Vice Chairman. In November 2011, President Obama reappointed him to an additional five-year term as Board Member.

The NTSB this week also called for “facial recognition data to catch driver license fraud at every opportunity, with data shared across states. It demands that certified medical examiners effectively play their role in denying medically unfit drivers a medical certificate.”  Added Sumwalt:  “Action on the safety recommendations issued and reiterated today will constitute a crackdown, but only from the point of view of drivers who put the safety of our children and other road users at risk. Such a crackdown is long overdue.”

Hit-and-Run Crash Deaths Increase in Connecticut and Nationally, Analysis Reveals

At the beginning of this month, Connecticut State Police investigated a hit and run car crash that killed one person on I-84 near exit 2 in Danbury.  Less than a week later, in Middletown, a person sought in a hit and run accident that resulted in a death last November was arrested.  Just two weeks earlier, Bridgeport police made an arrest in connection with a hit-and-run crash that killed an elderly man last June. 
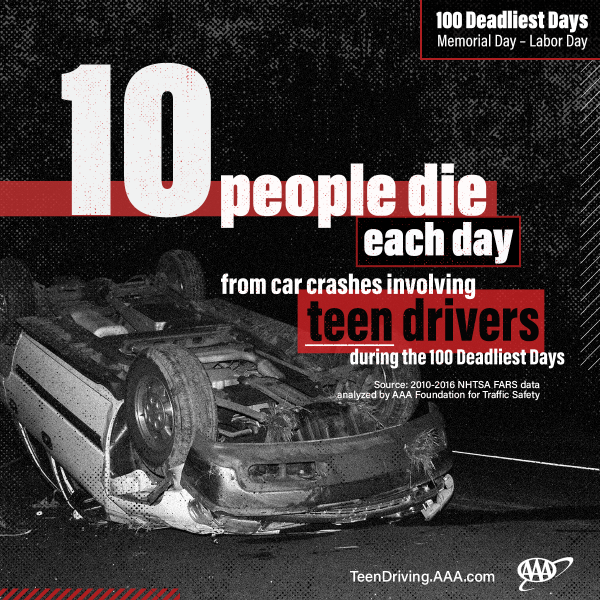
If you have a sense that reports of hit-and-run accidents have increased in frequency, you’re correct.

Data compiled by the AAA Foundation of Traffic Safety from 2006 to 2016, found there were 148 hit-and-run crashes involving at least one fatality in Connecticut. There also appeared to be a spike in fatalities from 2015, when there were 14 incidents, compared to 2016 where there were 24 such incidents.

Connecticut is not alone.

Hit and run crashes have killed more than 2,000 people in 2016, which equates to more than 1 such crash every minute on U.S. roads, according to a new study from AAA.  That’s the highest number of these types of crashes on record and a 60% increase since 2009.

With the number of hit-and-run crashes on the rise, AAA is calling for drivers to be alert on the road to avoid a deadly crash and remain on the scene if a crash occurs.

In the study, AAA researchers found:

  • An average of 682,000 hit-and-run crashes occurred annually since 2006.
  • Nearly 65% of people killed in hit-and-run crashes were pedestrians or bicyclists.
  • Hit-and-run deaths in the U.S. have increased an average of 7.2% each year since 2009.

In Connecticut over the six-year span, it was determined more than half of the fatal crashes occurred overnight, primarily on weekends, in the Fall.  Earlier this year, a Connecticut man was sentenced to six years in prison for a hit-and-run that authorities say killed a mother after she pushed her 7-year-old daughter to safety in October 2016.

“Hit-and-run crashes in the United States are trending in the wrong direction, especially in Connecticut,” said Fran Mayko of AAA Northeast. “The analysis shows such crashes are a growing traffic safety challenge and the AAA Foundation wants to work with all stakeholders to help curtail this problem.”

In all states, it’s the drivers legal and moral responsibility to avoid hitting pedestrians, bicyclists, or another vehicle; and leaving a crash scene significantly increases the penalties, whether or not the driver caused the crash, AAA emphasized.

In the US, state laws make it illegal for drivers involved in crashes to flee the scene. Penalties vary depending upon crash type and guilty parties may face large fines, lose their license or spend time in prison. In Connecticut, drivers who hit a vulnerable user is required to stop, remain on the scene, render aid if necessary, and notify law enforcement.

In the latest analysis, New Mexico, Louisiana and Florida have the highest rate of fatal hit-and-run crashes on a per-capita basis while New Hampshire, Maine and Minnesota have the lowest rates.


Firm Inspecting New London's Gold Star Bridge Project Also Designed Collapsed Florida Pedestrian Bridge

Project inspection and oversite for the rehabilitation of the southbound Gold Star Bridge structure on I-95 in New London and Groton, due to be completed later this year, is being conducted by the Connecticut Department of Transportation and FIGG Bridge Inspection.  FIGG, whose logo appears prominently on the website devoted to providing the public with project information, is the firm that designed the pedestrian bridge that collapsed at Florida International University on Thursday. 
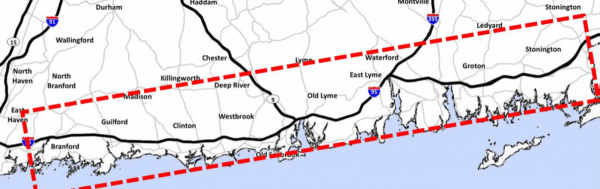
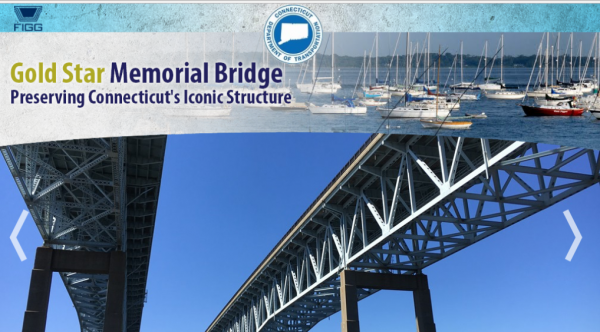
The Gold Star Memorial Bridge, described as “Connecticut’s most iconic structure,” is the largest bridge in the State of Connecticut. It is 6,000 feet long and over 150 feet tall at the center span. The bridge is actually a pair of steel truss bridges that span over the Thames River, between New London and Groton, according to the project website.

The project was awarded to Mohawk Northeast in December 2016 and onsite activities began a year ago, in April 2017. Project inspection and oversight, conducted by the state Department of Transportation and FIGG Bridge Inspection, is anticipated to be completed by late Fall this year.

UPDATE:  The Miami Herald is reporting that an engineer from FIGG working on the Florida project notified the state two days before the collapse of cracking on the bridge.  

FIGG has its headquarters in Tallahassee with offices in Pennsylvania, Minnesota, Texas and Colorado, the Miami Herald reported. The company specializes in all types of bridge design and focuses solely on bridge design and engineering both in the U.S. and abroad, according to the company's website. The FIU-Sweetwater UniversityCity Bridge is the largest pedestrian bridge moved via Self-Propelled Modular Transportation in U.S. history, the University's website noted prior to the collapse.

The newspaper also reported that FIGG, which provides design, engineering and construction services, was cited by the Virginia Department of Labor for four violations in 2012 after a 90-ton piece of concrete fell from a bridge under construction near Norfolk, Virginia.

At the Gold Star Bridge, plans call for the structure’s expansion joints to be replaced, as well as overhead sign structures, according to the project website. In total, the bridge has more than 1,000,000 square feet of deck surface area spread over 11 vehicle traffic lanes and a pedestrian sidewalk. The average daily traffic count is 117,000 vehicles.

“Repairs and maintenance of the bridge’s structural steel includes steel girder end repairs, bolt replacements, and bearing replacement and maintenance.  Repairs to the substructure include concrete repairs and crack sealing,” the website explains.

The site notes that “During off peak hours the number of lanes may be reduced to accommodate repairs and improvements,” and there will be periodic closures of the sidewalk.

The company’s website touts “FIGG's exclusive focus on bridge design and construction engineering inspection enables us to provide state of the art technology, innovative aesthetics and materials, and a unique capacity to partner for research.”

After the 2007 collapse of the Highway 35 West bridge in Minneapolis, Minnesota, FIGG built a $233.8 million 10-lane replacement bridge, the Tallahassee Democrat reported.  It was heralded for its state-of-the-art safety systems, including sensors designed to monitor bridge stress and corrosion.

FIGG focuses solely on bridge design and engineering both in the U.S. and abroad. Since 1978, the company has built, studied and designed $10 billion in bridges in 39 states and six countries, according to its website.

The Northbound Gold Star Bridge was built 30 years prior to its sister Southbound Gold Star Bridge.  Repairs on the Northbound bridge are due to begin later this year, the project website indicated. “In the end,” the website predicts, “the service life of the iconic Gold Star Bridges will be extended for decades.”


https://www.youtube.com/watch?v=xYLrBQv3t4o

Marijuana, Cellphones May Increase Pedestrian Fatalities, Federal Report Suggests; Fewer Deaths in CT as 23 States See Increase

Connecticut is one of 20 states that saw a decline in the number of pedestrian deaths in the first half of 2017, as compared with the first half of the previous year.  The trend nationally, however, is in the opposite direction, as 23 states saw pedestrian deaths increase.  Seven states were virtually unchanged.  And the trend in recent years has also been a rising death toll. The number of pedestrian fatalities increased 27 percent from 2007 to 2016, while at the same time, all other traffic deaths decreased by 14 percent. A new national study raises the possibility of a number of factors for the increase – an increase in the number of cars on the road, the increasing use of cell phones, and the use of marijuana, which has been legalized for recreational use in some states, including neighboring Massachusetts. The report suggests that it "provides an early look at potential traffic safety implications of increased access to recreational marijuana for drivers and pedestrians."

The Governors Highway Safety Administration (GHSA) released a 38-page study this week estimating that just under 6,000 pedestrians lost their lives last year, essentially the same death toll as 2016. The projected total in both years represent the highest levels seen since 1990, Governing magazine reported.  The number of states with pedestrian fatality rates at or above 2.0 per 100,000 population has more than doubled, from seven in 2014 to 15 in 2016. From 2015 to 2016, pedestrian fatalities in the nation’s ten largest cities increased 28 percent (153 additional fatalities), according to the GHSA report.

The number of miles traveled by vehicles increased nationally by 2.8 percent between 2015 and 2016 then rose another 1.2 percent the first half of last year, according to Federal Highway Administration data  The GHSA report noted that nearly 6,000 pedestrians died in motor vehicle crashes in 2016 and 2017, coming after a spike in the number of pedestrian deaths in 2015. "It has been more than 25 years since the U.S. experienced this level of pedestrian fatalities. Because both 2015 and 2016 saw large increases in pedestrian fatalities, the continuation of pedestrian fatalities at virtually the same pace in 2017 raises continued concerns about the nation’s alarming pedestrian death toll," the report stated.

“We’ve plateaued at a very bad place,” Richard Retting, who authored the report, told Governing. “This should not be a new normal.”

While pedestrian deaths have increased over the past decade, other types of traffic fatalities declined. Pedestrians accounted for 16 percent of all motor-vehicle related deaths in 2016, up from 11 percent in 2007. Federal data suggests nighttime collisions are a major problem -- three quarters of fatal crashes occurred after dark.

In Connecticut, there were 31 pedestrian fatalities in the first half of 2016; 20 in the first half of 2017, a decrease of 35 percent. Connecticut was one of 11 states, 2014-2016, where 20 percent or more of the pedestrian deaths were among people age 70 or older.  Connecticut's pedestrian fatality rate in 2016 was 1.73 per 100,000 population, which ranked 20th in the U.S.  In the first half of 2017, the state ranked 31st.

Retting told Governing that he suspects cellphone use by drivers and pedestrians could also be a culprit. The GHSA report stated that "Without stating a direct correlation or claiming a definitive link, more recent factors contributing to the increase in pedestrian fatalities might include the growing number of state and local governments that have decriminalized recreational use of marijuana (which can impair judgment and reaction time for all road users), and the increasing use of smart phones (which can be a significant source of distraction for both drivers and pedestrians).

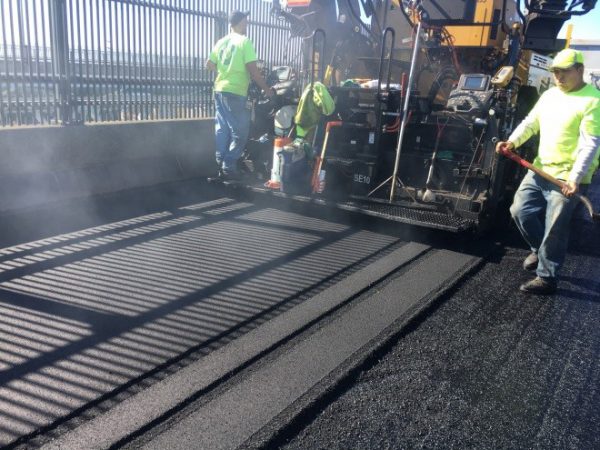
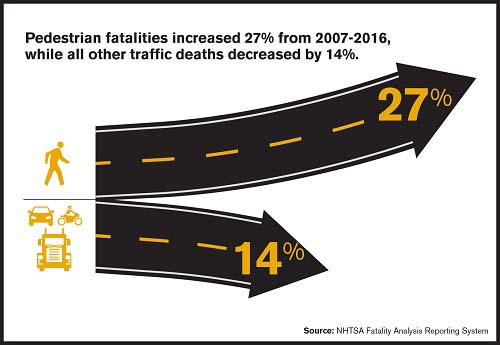
The total number of multimedia messages sent has more than tripled since 2010.  The report also suggests a possible link with marijuana use.  According to the report, the seven states (Alaska, Colorado, Maine, Massachusetts, Nevada, Oregon, Washington) and  DC that legalized recreational use of marijuana between 2012 and 2016 reported a collective 16.4 percent increase in pedestrian fatalities for the first six months of 2017 versus the first six months of 2016, whereas all other states reported a collective 5.8 percent decrease in pedestrian fatalities.

One example cited is Washington state, where marijuana was legalized in late 2012 and the first dispensaries opened in mid-2014.  According to data from the Traffic Safety Commission, Governing reported, Washington state saw an increase in 2015 and 2016 in fatal crashes where THC, the primary psychoactive chemical in marijuana, was present in blood tests of either the pedestrian or driver.

It was noted, however, that the totals, while higher, still remain relatively small. THC levels can be detected days or even weeks after marijuana use, and Washington state’s data also indicates that between 70 and 80 percent of drivers found to have THC also tested positive for alcohol or other drugs, according to that report.

The federal report also indicates that Connecticut DOT recently completed a statewide overhaul to replace old signage, including signs for pedestrian safety. "These are new, bright signs that are up to code," the report explained.  "The Highway Safety Office also launched an outreach and advertising campaign titled 'Watch for Me CT' which focuses primarily on pedestrian safety but also includes bicyclists."  Law enforcement training for this issue is currently being developed, the report said.

Nationally, there were 4,457 pedestrian fatalities in 2011 and 5,987 in 2016.  The data for the first half of 2017 is considered preliminary, and may rise higher as some state records are updated with additional data, the report indicated.

Hartford Region Coalition Embarks on Development of Economic Strategy

A coalition of prominent business, transportation and community development organizations in the Hartford Metropolitan Region has begun the process of taking a fresh look at its position in the global economy, with an eye toward taking advantage of economic opportunity. In announcing the initiative, the organizations noted that the region and the state have struggled to recover from the 2008 recession and that global, national, and local trends are reshaping the region’s economy. The state and many of the region’s 38 municipalities face increasingly difficult fiscal situations that hamper their ability to pursue projects that will lead to growth, officials said.

Recognizing that these trends, if left unaddressed, can dramatically impact the region, the organizations – the Capitol Region Council of Governments (CRCOG), Hartford Foundation for Public Giving (HFPG) and MetroHartford Alliance - will be working as an advisory committee to develop a new Comprehensive Economic Development Strategy (CEDS) for the Hartford Metropolitan Region. The most recent strategy was developed in 2012, and a previous effort took place in 2006.

“This strategy will take a hard look at the region and identify and prioritize the most promising opportunities for creating lasting economic growth. This region is a leader in insurance, finance, and advanced manufacturing; we need to build on these strengths to encourage the kind of growth that will lead to lasting fiscal stability,” said Jim Scannell, Senior Vice President, Administrative Services, at Travelers and co-chair of the CEDS Advisory Committee.

The effort gets underway with new leadership at the helm at a number of the organizations, which may impact the perspective along the way, if not the final results.  Led by the CRCOG, and longtime Executive Director Lyle Wray, the initiative is in partnership with the Hartford Foundation, where President Jay Williams, a former Assistant Secretary of Commerce for Economic Development and mayor of Youngstown, OH relocated to the region last year, and the MetroHartford Alliance, which hired David Griggs, mostly recently leading economic development efforts in Minneapolis-St.Paul as its new President and CEO.  Williams joins Scannell as co-chair of the CEDS Advisory Committee.

The consulting firm of Fourth Economy Consulting has been hired to help the region complete a situational assessment and develop “game changer” initiatives to serve as the core of a new economic development strategy. Fourth Economy, based in Pittsburgh, recently worked with the 100 Resilient Cities initiative to help cities around the world become more resilient to economic changes.

The process will be led by an advisory committee comprised of representatives of businesses, governments, educational institutions and non-profits throughout the region. A smaller working group, comprised of partner organizations like the New Britain Chamber of Commerce, will work closely with the consulting team and the advisory committee to develop a regional vision and turn it into an actionable plan.

Four primary tasks have been identified for the initiative:

  • Goal-Setting: Build consensus around the need for accelerating inclusive/equitable economic growth; that is raising incomes across the income distribution with particular attention to opportunities for engaging those who have often been left behind.
  • Situational Analysis: Do a clear-eyed assessment of our situation: who, what, where to identify opportunities that we should be pursuing as a metropolitan region (i.e., SWOT with an emphasis on context and opportunities).
  • Strategic Planning: Formulate a limited number of “game changer” strategies that will move the trajectory of inclusive economic growth in the right direction.
  • Capacity-Building: Identify organizational forms and collaborations that we will need to implement and sustain the strategies over time.

During this process the Advisory Committee will also identify potential partner organizations and set up an organizational structure to implement the initiatives.  A final strategy report is due next winter.  CRCOG has set up a website that already includes key resources, and will be updated as the work proceeds during the year.

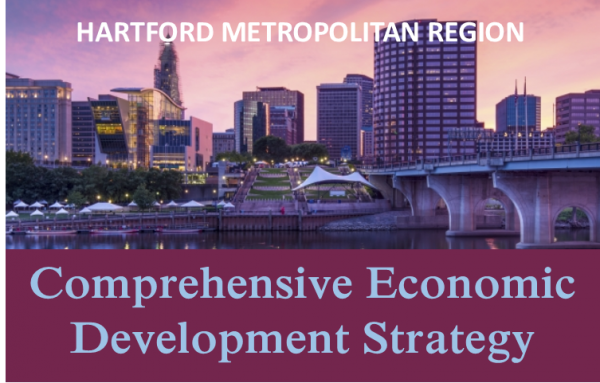
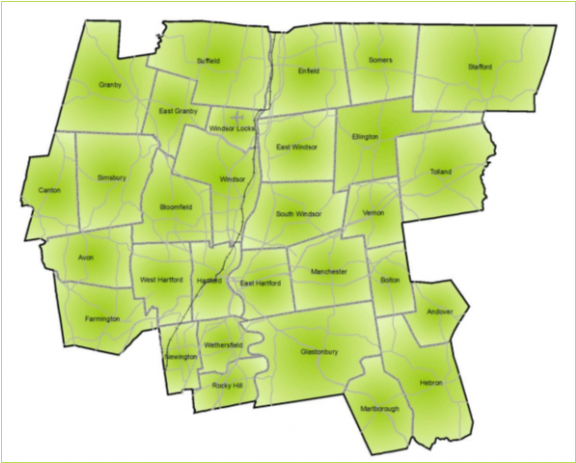
“There is only one way our region will achieve equitable and sustainable economic growth.  We must eschew the past squabbles and divisions that have kept us mired in anemic progress,” said Jay Williams, president of the Hartford Foundation and co-chair of the CEDS Advisory Committee.  “If we commit to a bold, collaborative, and pragmatic approach, we can develop a roadmap to capitalize on the enormous talent and multiple assets our region possesses.  I’ve seen the success of this approach in other parts of the country and there is absolutely no reason it can’t occur here, unless we lack the collective will to make it happen.”

Similar efforts occur throughout the state led by various economic development regions. The WestCOG Region’s first Comprehensive Economic Development Strategy (CEDS) was developed throughout 2017.  WestCOG includes 18 towns in the Stamford - Norwalk - Danbury region of the state.  Public comment on the draft plan was solicited last fall.

The state’s South Central Connecticut region, centered around New Haven, undertook a similar effort in 2013, which has been updated annually. The Strategic Planning Committee and sector subcommittees have been established for 2018, and are currently gathering data and input from community stakeholders, according to the website for that region’s economic strategy planning initiative. It is led by Economic Development Corporation of New Haven,  a private, non-profit organization, dedicated to business and economic development within the city of New Haven and REX Development, which was formed as the economic development entity for the fifteen towns served by the South Central Regional Council of Governments (SCRCOG).

Of the Hartford region’s CEDS initiative, East Hartford Mayor Marcia Leclerc, the Chair of the CRCOG Policy Board said “Our metropolitan region needs to competitively position itself for the future in relation to other regions in the country, as well as globally. To do that we need to take a hard look at our current situation and our opportunities.”


Transportation Officials Announce "Stunning" Findings in I-95 Congestion Study

“For years, the accepted thinking was that the only way to relieve congestion on I-95 was to add a lane in each direction from border to border. After a detailed study of alternatives, we have determined that strategic, directional widening on I-95 between New Haven and New York can significantly reduce congestion and can be built within existing right of way.” Those comments, from Connecticut Department of Transportation (CTDOT) Commissioner James P. Redeker , accompanied the release of a study on the impact of widening and improving both the western and eastern portions of Interstate 95 in Connecticut, and which also outlined “the consequences of failing to act.” The report indicated that “limited,  directional and strategic widening yields major benefits.”

Redeker added that “Similar strategic, localized investments can also reduce congestion between New Haven and Rhode Island. These findings indicate that we can achieve congestion relief through strategic and much less costly investments far sooner than previously thought. In addition, the return on these investments would far exceed the cost of the projects.”

Currently, peak morning and evening congestion on the highway accounts for 54 million hours of delay and costs $1.2 billion in lost time annually. Key areas studied were Fairfield to Bridgeport Northbound (6.3 miles), Stamford to New York Southbound (9.3 miles) and Stamford to Fairfield Northbound (11.1 miles).  The report noted that safety, as well as travel time, was a key element in the recommendations.  For example, from Branford to the Rhode Island border, it was indicated that there were 3,380 crashes during 2014-2016, including 997 injuries and 23 fatalities.

The I-95 widening projects were included in the $4.3 billion in projects canceled or suspended by the CTDOT last month because of what the Governor’s office described as “long-term failure to adequately fund the Special Transportation Fund.”  The Governor’s revenue proposal – which includes a seven-cent increase in the gas tax over four years and the implementation of electronic tolling – would allow for these investments to go forward, the Office said.

“CTDOT is excited to announce that after a detailed study of options for relieving congestion on I-95, we are able to report a stunning set of findings,” Commissioner Redeker said in releasing the report.

Among other findings, the report notes that just one of the projects proposed – adding one northbound lane between exits 19 and 28 – would reduce travel time from the New York border to Bridgeport from 63 minutes – if no improvements are made – to 41 minutes during weekday afternoon peak times. .Short-term, mid-range and long-range options were presented for I-95, including exists 54 to 55, 88 to 90, 80-74 80-82A, and the I-95/Route 32 interchange.  Long-range improvements from exit 54 to 69 “requires further study” the report said.  It also called for “strategic improvement” Northbound from Exit 19 to 28 to “remove bottleneck.”

In announcing the report’s findings, Governor Malloy warned that without legislative action this session to shore up the Special Transportation Fund (STF), this type of investment will be impossible.

“These improvements shouldn’t be seen as optional,” Malloy said. “But without new revenue to stabilize the Special Transportation Fund, critical projects like the I-95 widening will not be possible. I put forward a reasonable proposal last month, and I look forward to working with the legislature this year to find real, long-term transportation solutions.”

“Connecticut deserves this rational, sensible and cost-effective investment to support our economic growth,” Redeker added. The DOT first announced a study of the I-95 corridor in October 2016.

Connecticut Bridges Falling Down? One-Third Are Deficient; State’s Highways Ranked 5th Worst for Cost and Condition

Seven states – including Connecticut – report that more than one-third of their bridges are deficient.  The other six are neighboring Rhode Island, Massachusetts and New York, as well as  Hawaii, West Virginia, and Pennsylvania.  Overall, only four states have state highway systems deemed worse than Connecticut, which ranks 46th in the nation, according to a new nationwide analysis of cost and condition. 
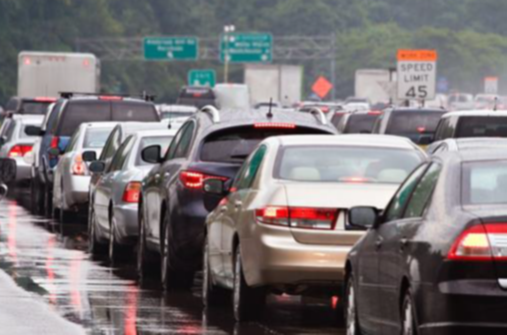
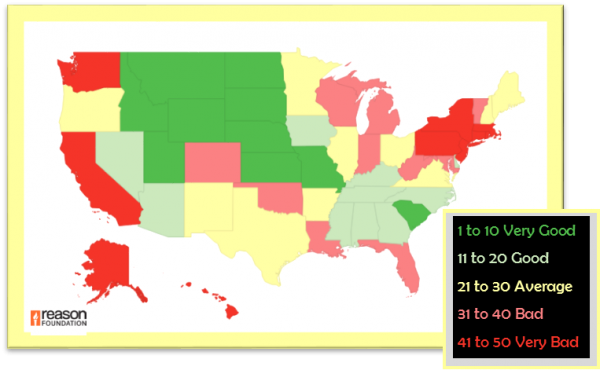
Reason Foundation’s Annual Highway Report ranks the performance of state highway systems in 11 categories, including spending per mile, pavement conditions, deficient bridges, traffic congestion, and fatality rates.  At the bottom were New Jersey, Rhode Island, Alaska, Hawaii and Connecticut.  Topping the list were North Dakota, Kansas, South Dakota, Nebraska, South Carolina and Montana.  New York and Massachusetts were also in the bottom ten, ranked just above Connecticut.

The report indicates that federal law mandates the uniform inspection of all bridges for structural and functional adequacy at least every two years; bridges rated “deficient” are eligible for federal repair dollars. Of the 603,366 highway bridges reported nationwide, 130,623 (about 21.65%) were rated deficient.  In Connecticut, it was 34 percent.  The states with the highest percentage of deficient bridges are all located in the Northeast or along the eastern seaboard.

In the overall rankings, New Jersey ranked last in overall performance and cost-effectiveness due to having the worst urban traffic congestion and spending the most per mile — $2 million per mile of state-controlled highway, more than double what Florida, the next highest state, spent per mile.

The report also considered costs related to state roads and bridges.

In maintenance disbursements, the costs to perform routine upkeep, such as filling in potholes and repaving roads, Connecticut ranked 31st.  On a per-mile basis, maintenance disbursements averaged about $28,020 per state; there has been an upward trend nationally over the past decade, the report points out.

Connecticut ranked on the far end of the spectrum among the states in administrative disbursements for state-owned roads.  On a per-mile basis, administrative disbursements averaged $10,864 per state, ranging from a low of $1,043 in Kentucky to a high of $99,417 in Connecticut.

The report, released this month, is based on spending and performance data that state highway agencies submitted to the federal government for the year 2015, the most recent year with complete data available.  New Jersey ranked last, 50th, in overall performance and cost-effectiveness due to having the worst urban traffic congestion and spending the most per mile — $2 million per mile of state-controlled highway, more than double what Florida, the next highest state, spent per mile.


Hartford Rail Line May Bring Jobs, Opportunity for Key Populations, Study of Public Transit Suggests

As Connecticut moves closer to a significant increase in rail service connecting communities from New Haven to Springfield, MA, with the introduction of the Hartford line, anticipated in May, a report by Demos underscores the potential impact on economic opportunity and segments of the state’s population. The report, “To Move is to Thrive:  Public Transit and Economic Opportunity for People of Color,” which looked at public transportation in metropolitan areas across the country, presents a series of findings on the use of public transit by people of color and on the potential jobs benefits that people of color can gain from investments in public transit.

Its key findings on the use of public transit are:

  • Racial, ethnic, and class inequities in the access to and funding of public transit continue today.
  • Latino and Asian-American workers are twice as likely as white workers not to have a vehicle at home. African American workers are three times as likely. These disparities are heightened in certain metropolitan areas; Latino and black workers lack a private vehicle at as much as six times the rate of white workers in some areas.
  • Asian-American and African-American workers commute by public transit at nearly four times the rate of white workers. Latino workers commute by public transit at nearly three times the white rate.
  • Workers of color are overrepresented among public transit commuters with “long commutes”—one-way commutes of 60 minutes or longer.

The key findings on the jobs benefits from investment in public transit are:

  • America’s employment rates are still low relative to 2000, and there is a strong racial hierarchy in employment rates.
  • The majority of the jobs created from infrastructure investments can be non-construction jobs.
  • All racial and ethnic groups gain jobs from large infrastructure investments and, generally, the larger the investment, the more jobs for each group.
  • Investments in public transit show good returns in terms of the shares of the total jobs going to workers of color.

The report also noted that “growing numbers of Americans rely on public transit in their daily lives. In 2015, passengers took 10.5 billion trips on transit systems, up 33 percent from 20 years ago. Public transit ridership has grown faster than the population. But our public transit infrastructure, like much of our infrastructure generally, is old and decrepit. And many of our transit systems were not designed to handle such heavy use.”

While Connecticut’s cities are not as large as many of the nation’s largest metropolitan areas, they do have populations with larger numbers of people of color than mnay surrounding suburbs.  Providing greater ease of mobility to station stops along the Hartford line could offer impacts suggested by the study.

The Hartford line, which is focused on increasing the frequency of station stops from Springfield to New Haven, will also see additional stations constructed in the coming years.  When the CTrail Hartford Line service launches in May, it will consist of both expanded Amtrak service and new regional trains operated by the Connecticut Department of Transportation and will offer more frequent, convenient and faster passenger rail service between New Haven, Hartford and Springfield.

Plans call for an increase in the number of round trip trains from six daily Amtrak intercity and regional trains to a total of 17 round trip trains a day to Hartford, and 12 trains per day to Springfield. In addition, trains will operate at speeds up to 110 mph, reducing travel time between Springfield and New Haven. Stops are to include rail stations in Windsor Locks, Windsor, Hartford, Berlin, Meriden, Wallingford and New Haven.   New stations are to be added, refurbished or relocated in North Haven, Newington, West Hartford, Windsor, Windsor Locks and Enfield by 2020.

Projections include more than 4,500 construction related jobs and over 8,000 total jobs, including both direct and indirect jobs.  Transit-oriented development, including housing is also anticipated along the route. Recently, plans to convert a long-vacant factory into housing was announced in Windsor Locks.

The national data indicates that workers of color are roughly 2 to 3 times as likely as white workers not to have a private vehicle at home: only 2.8 percent of white workers do not have a vehicle at home, but 6.9 percent of Asian-American workers, 7 percent of Latino workers, and 9.5 percent of African-American workers do not have a vehicle at home.

Nationally, 3.1 percent of white workers use public transit, while 7.8 percent of Latino workers, 11 percent of Asian-American workers, and 11.1 percent of African-American workers commute using public transit. In other words, Latino workers are almost 3 times as likely, and Asian-American and African-American workers are almost 4 times as likely as white workers to commute by public transit, the report indicated.

Based in New York, Boston and Washington D.C., Demos is a public policy organization “working for an America where we all have an equal say in our democracy and an equal chance in our economy.”