CT Unemployment Rate in Construction Industry Improving, But Remains Among Highest in US

Connecticut’s unemployment rate in the construction industry remained among the highest in the U.S., ranked 39th among the 50 states in October, although the year-over-year change was the 12th best in the country.  Connecticut’s October unemployment rate in the industry was 6.7 percent, higher than the U.S. average of 5.7 percent, according to data released by the Associated Builders and Contractors (ABC). construction The state’s construction industry unemployment rate nudged downward from 7.1 percent in September, but was 6.4 percent in July 2016.  In recent years, the rate ballooned to 18.1 percent in October 2010, at the height of the recession, from a low of 5.8 percent in October of 2008.

Overall, the U.S. construction industry added 19,000 net new jobs in November and has now added jobs for three consecutive months, according to analysis of U.S. Bureau of Labor Statistics data compiled by Associated Builders and Contractors. rates

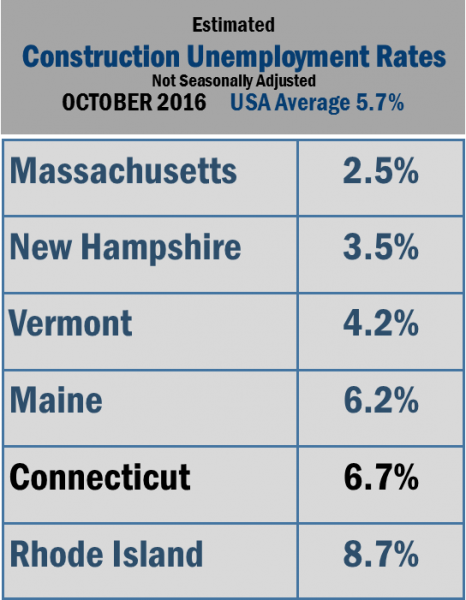
Industry employment is up by 2.4 percent on a year-over-year basis, considerably faster than the overall economy’s 1.6 percent job growth rate. Construction industry employment growth would likely be much sharper if more suitably skilled or trainable workers were available to fill available job openings, according to the ABC.

The data indicate that skilled labor shortage nationally appears to be impacting nonresidential activity more than residential. The nonresidential sector added 1,100 net new jobs in November, while the residential sector added 19,600 positions. Heavy and civil engineering lost 2,100 jobs for the month.

“The demand for construction talent was strong before the election, and the outcome has improved the near-term outlook for private and public construction activity,” said ABC Chief Economist Anirban Basu.  “The implication is that demand for construction workers is positioned to remain high, which will translate into gradual reduction in industry unemployment and significant wage pressures.statece

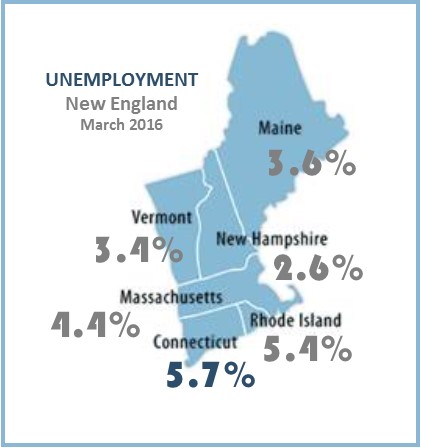
In the state-by-state numbers, calculated for October, the states with the lowest estimated not-seasonally-adjusted construction unemployment rates were North Dakota, Massachusetts, Colorado, Utah, New Hampshire and South Dakota. October not seasonally adjusted (NSA) construction unemployment rates were down in 33 states, including Connecticut, on a year-over-year basis.  Connecticut's October 2015 unemployment rate in the construction industry was 8.0 percent.

North Dakota’s unemployment rate in the industry was 2.4 percent, with Massachusetts at 2.5 percent.  New Hampshire’s construction industry unemployment rate was 3.6 percent.  Elsewhere in New England, Rhode Island’s unemployment rate in the construction industry was fourth highest in the nation, at 8.7 percent in October.

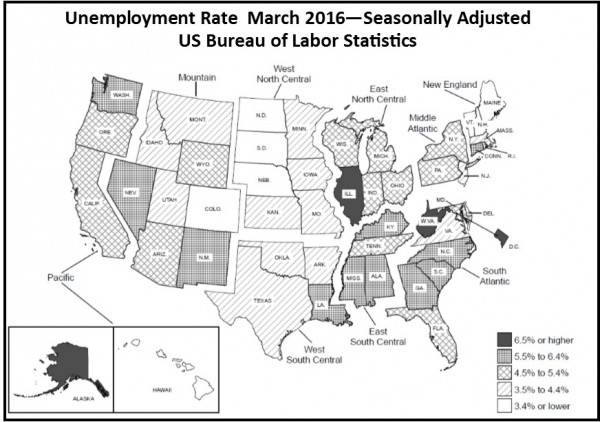
The unemployment rate for all U.S. industries fell to 4.6 percent in November, the lowest rate since mid-2007 and 0.3 percentage points below October’s rate. The labor force lost 226,000 persons for the month, but is still more than 2 million people larger than at the same time one year ago, officials pointed out.

CT Unemployment Rate Highest in New England, Higher Since Year Began

Unemployment in Connecticut nudged upwards in March from a month earlier, but remained slightly below a year ago.  The state’s jobless rate of 5.7 was higher than the national rate of 5.0 percent and the highest in New England. Nationwide, the regional and state unemployment rates were generally little changed in March, according to the U.S. Bureau of Labor Statistics:

  • 21 states had unemployment rate decreases from February,
  • 15 states including Connecticut had increases, and
  • 14 states and the District of Columbia had no change,

new england
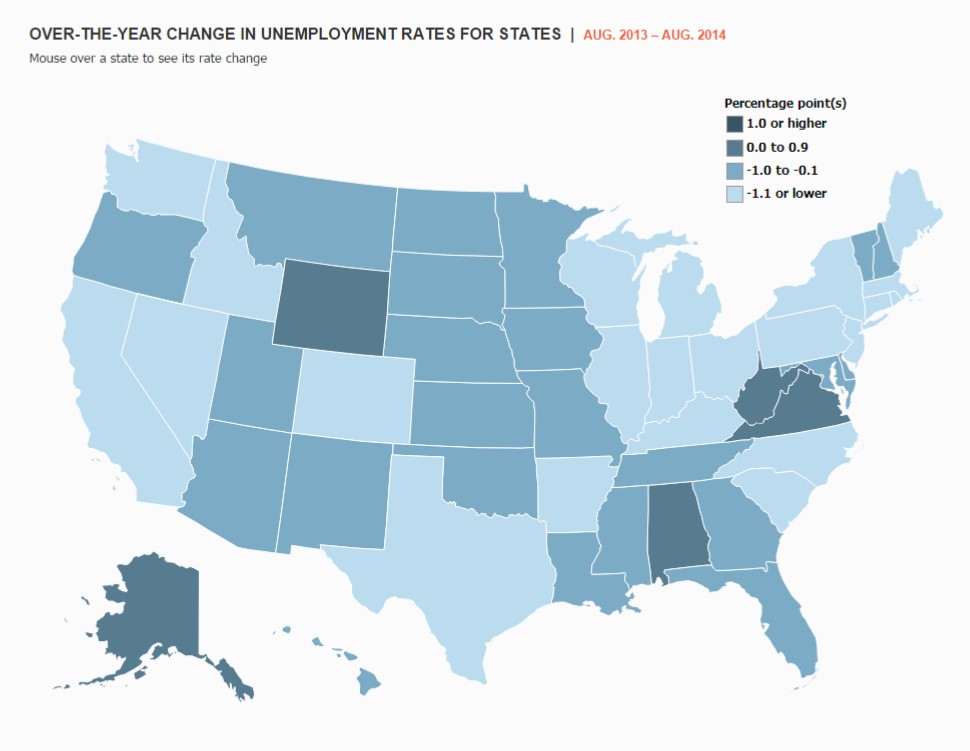
Thirty-six states including Connecticut (and the District of Columbia) had unemployment rate decreases from a year earlier, 12 states had increases, and 2 states had no change.

The national jobless rate, 5.0 percent, was little changed from February and was 0.5 percentage point lower than in March 2015. Job growth occurred in retail trade, construction, and health care. Employment fell in manufacturing and mining.

Connecticut’s unemployment rate was 5.9 percent a year ago in March 2015, dropped to 5.5 percent by January and February of 2016, and climbed to 5.7 percent in March.

Overall in New England, the unemployment rate was 4.5 percent in March, compared with 5.2 percent in March 2015.  Across the region, the unemployment rate has steadily declined during the past year.  The rate was 4.6 percent in January and 4.5 percent in February, according to the BLS data.2000px-Bureau_of_labor_statistics_logo.svg

Last month, the unemployment rate in Rhode Island was 5.4 percent, in Massachusetts was 4.4 percent, in Maine 3.4 percent, in Vermont 3.3 percent and in New Hampshire 2.6 percent.

The highest unemployment rates in the nation last month were in Alaska (6.6%), West Virginia (6.5%), D.C. (6.5%), Illinois (6.5%), Alabama (6.2%), New Mexico (6.2%), and Louisiana (6.1%).

South Dakota and New Hampshire had the lowest jobless rates in March, 2.5 percent and 2.6 percent, respectively, followed by Colorado, 2.9 percent.

“We are still struggling to come to terms with a stubborn new economic reality,” said economist Pete Gioia of the Connecticut Business and Industry Association. “We are adding back low-wage jobs at a much higher rate than high-paying jobs.”

Connecticut has now recovered 77 percent of jobs lost during the recession, CBIA reported, while the U.S. has recovered 161 percent of jobs lost during that same time, according to DataCore Partners.

usa map


CT’s Unemployment Rate Drop During Past Year Ranks #17 in U.S.

Between August 2013 and August 2014, Connecticut’s unemployment rate dropped 1.2 percent, ranking the state #17 in the U.S. in the percentage reduction in unemployment during the year-long period.  The data, compiled by the U.S. Bureau of Labor Statistics (BLS), indicated that Connecticut’s unemployment rate, seasonally adjusted, dropped from 7.8 percent to 6.6 percent. Connecticut’s top 20 finish among the states outpaced the New England states of Maine, New Hampshire and Vermont, but was slightly behind Rhode Island and Massachusetts, as well as New York and New Jersey.

The largest reductions in unemployment during the 12-month period came in Illinois (2.5 percent decrease), Nevada (2.2 percent), Rhode Island (1.9 percent), Ohio (18 percent) Colorado and Indiana (1.7 perce298px-Bureau_of_labor_statistics_logo.svgnt), Michigan and Pennsylvania (1.6 percent).  Also faring slightly better than Connecticut in reducing their state unemployment rate over the year were California, Idaho, New Hersey, Arkansas, Massachusetts, Washington, Kentucky and New York.  North Carolina was tied with Connecticut.

In 45 states and the District of Columbia, the unemployment rate dropped between August 2013 and August 2014.  In three states, the unemployment rate climbed during the year – Alabama, West Virginia and Alaska - and in two states, the rate remained unchanged – Virginia and Wyoming.

Connecticut was also one of 27 states deemed to have "statistically significant" changes in their unemployment rate, according to the federal agency.  The BLS data was updated as of September 19, 2014 for the 12-month period, and subsequently made available on the agency's website.

Among Connecticut's neighboring states in the region, according to the data, the unemployment rate as of August 2014 is higher in Rhode Island (7.7 percent), the same as Connecticut in New Jersey (6.6 percent), and lower in New York (6.4 percent),  Massachusetts (5.8 percent), Maine (5.6 percent), New Hampshire (4.4 percent) and Vermont (4.1 percent).

The Bureau of Labor Statistics of the U.S. Department of Labor is the principal Federal agency responsible for measuring labor market activity, working conditions, and price changes in the economy. Its mission is to collect, analyze, and disseminate essential economic information to support public and private decision-making. As an independent statistical agency, BLS serves its diverse user communities by providing products and services that are objective, timely, accurate, and relevant, the agency's website explains.

map unemployment rate change

Nonprofit Density Impacts Unemployment Rate; CT Misses Top 10

Communities with better civic health have weathered the recent recession far better – and experienced considerably smaller increases in unemployment – than other communities that faced similar economic circumstances, according to a report by the National Conference on Citizenship (NCoC).  Counties across the nation that were rich in nonprofit organizations lost considerably fewer jobs than the low-nonprofit counties, the study revealed. A state-by-state analysis by the organization placed Connecticut in the second tier of states in both the density of nonprofit organizations, and social cohesion (interacting with friends and neighbors), the two measures used in the study, released in 2012.  Connecticut ranked between #11 and #20 in each category, just outside the first tier, top-10 states.

For individuals who held jobs in 2008, the odds of becoming unemployed were cut in half if they lived in a community with many nonprofit organizations rather than one with a few nonprofits, even if the two communities were otherwise similar, theNCoC study found.  Among the New England states, Maine, Rhode Island and Vermont placed in the top ten.

Overall, counties with more nonprofits per capita prior to the recession had lower unemployment in 2006. And while almost all of the counties lost jobs during the recession years, the counties with more nonprofits per capita lost fewer jobs between 2006 and 2009. Both patterns remain even when holding education, median income, housing prices, and other economic factors constant, according to the report.  Counties ranking in the top 10% in nonprofit density experienced an increase of only 2 percentage points in their unemployment rate between 2006 and 2009, compared with 5.1 percentage points for the counties in the bottom 10% in nonprofit density.

These results suggest – according to the report – that nonprofits may bring economic benefits by directly employing people and also by changing the economic climate of the whole community. Nonprofits support civic engagement and social cohesion; in turn, when citizens feel committed to their communities and connected to their fellow residents, they are more likely to make decisions that boost local employment.

The study used statistical models to investigate the relationship between civic health and unemployment in the 50 states, 942 metro areas, and more than 3,100 counties since 2006.  NCoC was chartered by Congress intop 10 1953 to harness the patriotic energy and national civic involvement surrounding World War II. In 2009, Congress  expanded the organization’s Civic Health Assessment to become the nation’s largest and most definitive measure of civic engagement.