Report Calls for Transition to Livable Communities Across Connecticut

In Connecticut, more than one-third of the population is over the age of 50, and that proportion continues to increase. Connecticut’s Legislative Commission on Aging has issued “Connecticut for Lireport covervable Communities,” a new report to the state legislature which outlines more than 50 recommendations for communities looking to enhance livability. The Commission has also launched a website which includes a list of communities that are responding to the call for more livable communities, and suggests a wide range of actions that communities can take.

Connecticut is undergoing a permanent and historic transformation in its demographics, the report points out. Between 2010 and 2040, Connecticut’s population of people age 65 and older is projected to grow by 57 pelivability chartrcent, with less than 2 percent growth for people age 20 to 64 during the same period.

Livable communities are vibrant, inter-generational places that are easy to get around, according to the report. “They include affordable, appropriate housing options, supportive community features and services, and adequate mobility options. They foster independence, engage residents in civic and social life, and allow people to age in place. Done well, they benefit community residents across the lifespan.”

The 50-page report indicates that residents born in Connecticut today can expect to live to be 80.8 years old - the third highest life expectancy in the nation. A lengthy series of recommendations are highlighted in seven different areas: community engagement, health and well-being, housing, planning and zoning, safety and preparedness, social and support services, and transportation.

The recommendations include promoting opportunities for intergenerational collaboration, promoting in-home programs that improve health outcomes, creating a balanced transportation system that connects residents with health care services, and adopting policies that encourage incorporation of accessible housing features into new construction. The recommendations also include a call for municipal plans of conservation and development that include planning for older adults and individuals with disabilities to remain in their homes and communities, and building compact, mixed-use development “to encourage walking and eyes on the street.”

Creating livability requires “robust partnerships, long-range planning and sustained commitment.” To support those efforts the Legislative Commission on Aging plans to be:

  • Providing educational opportunities on livable communities for community leaders and other partners in Connecticut;
  • Creating partnerships to support the multi-faceted, multi-disciplinary endeavor of creating livable communities;
  • Supporting, inspiring and incentivizing communities to enhance livability; and developing policies to support aging in place

To help communities implement the recommendations over time, the Commission plans to:

  • Recognize localities that have implemented livable communities initiatives, pursuant to Public Act 14-73 (which established the livable communities initiative)
  • Expand partnerships across multiple sectors to advance livability, logo
  • Continue to convene municipal leaders, legislators and other thought leaders for statewide and regional forums on creating livability;
  • Continue to identify funding opportunities for municipal leaders, seeking to implement or sustain livable communities initiatives;
  • Work with partners to conduct asset mapping across all Connecticut communities, with the goal of helping each community understand its facilitators and barriers to developing livable communities;
  • Continue to research models in other states, nationally and internationally;
  • Work with the Connecticut General Assembly to identify and advance policy solutions that incentivize and inspire the creation of livable communities;
  • Provide technical assistance to Connecticut communities seeking to enhance or promote livability; and
  • Create town-specific data profiles to enable towns to enhance livability in a targeted and strategic fashion.

Among the communities listed on the new website as having best practices in place in parts of their towns or cities are Branford, Guilford, Madison, Bridgeport, Danbury, Darien, Enfield, Hartford, Middletown, New Haven, New Canaan, Norwalk, Seymour, and Torrington.  The Commission plans to proceed with "asset mapping across all Connecticut communities" and "continue to identify innovations, ideas, and best practices for implementing livability in the state. "

Efforts to Connect Entrepreneurs Hit the Road Statewide

Some have suggested that the road back for Connecticut’s economy will be built one entrepreneur at a time. If that is the key to an economic rebound, an initiative by New Haven-based company Independent Software is looking to ramp up the process by gathering entrepreneurs in bunches. In fact, New Haven will be the next stop on eight-month Whiteboard Startup Roadshow tour across Connecticut, in the midst of the city’s celebrated International Festival of Arts and Ideas this week. Organizers indicate that cities like New Halogo whiteboardven are “overflowing with impossible ideas and the people who make them happen. We believe connecting to all three -- the place, the thinking, and the people -- can increase the probability of success for others who have impossible ideas.”

On Thursday June 26, from 2-5pm, The Whiteboard is bringing together New Haven area innovators and entrepreneurs for “a little history and to talk about the future.” The “Roadshow” stopped in Hartford last month, with a well-attended program at the reSET co-working space downtown.

Following the Arts and Ideas' "Innovation in the Ninth Square" walking tour of The Grove, SeeClickFix, and MakeHaven, individuals are asked to gather at Luck and Levity for an Open House and Entrepreneur Showcase beginning at 2 PM, followed at 4 PM by perspectives offered by:

  • Margaret Anne Tockarshewsky, New Haven Museum
  • Elon Boms, Launch Capital
  • Jim Gregory, Core Informatics

The Whiteboard - and the The Whiteboard Start-Up Roadshow – is operated by Independent Software, which runs from The Grove co-working space in New Haven, and is supported by CT Next.

Following a kickoff event in New Haven on April 1, the tour moved on to Stamford in April, then to Hartford in May, back to New Haven this week. In eight months’ time, organizers “expect to have a treasure trove of stories from each region and to see a larger, stronger, and more connected startup community state-wide.”  The list of cities to be visited for gatherings of local entrepreneurs is below.  whiteboard_logoheader1

Independent Software works with early-stage entrepreneurs “to develop the products, talent, and community they need to thrive.” The company also provides access to Connecticut’s vast startup community through The Whiteboard, which includes a diverse network of entrepreneurs, investors, and supporters.  The Whiteboard website outlines the Roadshow cities on the calendar:

  • July: Bridgeport-Fairfield: In the context of the city’s own summer arts festival, we’ll shine a light on the amazing progress Bridgeport’s entrepreneurial scene has made in recent years, working closely with the B:Hive, the Business Council of Fairfield County and others.
  • August: New London-Norwich: SECT Tech Center at Avery Point for bioscience startups and a robust arts scene makes the shoreline a unique place to start a business. Along with the New London-Groton area, Norwich is new territory for us so this area will be true exploration.
  • September: Storrs-Windham: From incubators to partnerships with UTC and others, UConn Storrs is a hub of activity for a myriad of innovation startups. Windham’s history, arts and social entrepreneurship adds to the mix for this not-so-quiet corner of the state.
  • October: Danbury-Waterbury: The Danbury Hacker Space is launching this year, and it’s just the beginning of activity for their entrepreneurs. As one of Connecticut’s many factory towns, Waterbury is looking to leverage its buildings to help launch small businesses.
  • November: Middletown-Meriden: As a connection point between the shore and Hartford, this area has pockets of innovation that you wouldn’t suspect. We hear rumblings of a startup culture and look forward to unearthing what’s here.
  • December: Torrington: Litchfield County is known for its organic farming and getaways. Yet, Torrington’s Warner Theater and energetic young politicians are fighting hard to be heard. We look forward to bringing these hidden gems to you.


Credit Card Delinquency Rate Places Connecticut At #20 Among States, Better Than U.S. Average

The credit card delinquency rate among Connecticut residents puts the state in the middle of the pack, ranked at #20 nationally, but the percentage has more than doubled compared with 2000 and climbed since 2006, according to data compiled by the financial website bloomberg.com. The credit card delinquency rate among Connecticut residents is slightly better than the U.S. average, and slightly better than the median among the states. credit card rate

The lowest credit card delinquency rates are among residents of North Dakota at 7.4 percent, Alaska at 7.6 percent, Nebraska at 8.3 percent, Wisconsin at 8.6 percent, and South Dakota at 8.7 percent.

Connecticut’s delinquency rate of 11.2 percent falls between Colorado at 11.1 percent and North Carolina at 11.2 percent. At the other end of the spectrum are California (17.7 percent), Florida (20.8 percent) and Nevada (22.4 percent). The U.S. average is 11.7 percent.

Since the beginning of the century, the credit card delinquency rate among Connecticut residents has climbed – from 5.2 percent in January 2000, to 7.8 percent in January 2003, to 11.2 percent in January 2009, where it has remained.

The national comparison is based on 2013 data, and was compiled this year. Credit card debt delinquency is the percent of all credit cards that are delinquent more than 90 days, including revolving accounts for banks, bank card companies, national credit card companies, credit unions, and savings and loan associations, according to Bloomberg.ee6b669580c44f948af5696e4913356f

Among the other New England states, Massachusetts ranks #39, Rhode Island is #44, Vermont is #16 and New Hampshire is #26. In the tri-state region, New York is #43 and New Jersey is #28 in individual credit card delinquencies among state residents.

Data on delinquent debt balances were collected as part of the Federal Reserve Bank of New York Consumer Credit Panel, a quarterly national survey of all individuals with a Social Security number and a credit report (usually aged 19 and over). It draws from a nationally representative 5 percent random sample from a database of about 40 million individuals’ detailed Equifax credit reports. The data is updated annually by the Federal Reserve Bank of New York, according to Bloomberg.

New Haven is Number One - Best Foodie City in America

New Haven is the number one “foodie city” in America, according to a new analysis published on the website Livability.com The site reports that “New Haven residents spend more on eating out than most Americans. Many frequent neighborhood bistros and cafes that get their ingredients from nearby farms. The city's farmers markets make it easy for home cooks to prepare fresh meals.”foodie

The Elm City outpaced cities including Boston in New York in the newly announced top 10 list, with New Haven praised for supporting local farmers, showcasing regional cuisine and providing residents with “bountiful opportunities to discover new flavors, textures, cooking techniques and healthy foods.”

To determine the top 10 “foodie” cities, editors analyzed data from Esri about how frequently families eat at locally owned restaurants and how much the average resident spends eating out. They also examined the accessibility residents of each city have to healthy foods like fruits, vegetables and quality meat with data from the Robert Wood Johnson Foundation.pepes

Also taken into account were cities with established farmers markets and restaurants that use locally grown ingredients, as well as critically acclaimed restaurants, successful chefs and winners of James Beard Foundation Awards.

“There’s a real foodie renaissance going on in U.S. cities,” says Livability.com Editor Matt Carmichael. “You’re seeing that coast to coast, but these cities really stand out as great places to live and eat.”

The site’s write-up of New Haven’s foodie choices noted that “restaurants cover the gamut of food genres. From Louis' Lunch to Frank Pepe Pizzeria Napoletana to Claire's Corner Copia, it’s no wonder New Haven residents spend more on eating out than most Americans.” Also among the New Haven restaurants mentioned in the profile of New Haven’s eateries are Sandra’s Next Generaclaire'stion, Mamoun’s, Prime 16, Skappo, Bella’s Care and Da Legna.

The 2014 list is quite different from a year ago. In 2013, the top city was Decatur, Georgia. Also reaching the top ten were Hoboken, New Jersey; Bloomington, Indiana; Berkeley, California; Madison, Wisconsin; Lafayette, Louisiana; Chapel Hill, North Carolina; Sante Fe, New Mexico; Alexandria, Virginia; and Burlington, Vermont. The only cities to reach the top 10 in both years were Berkeley and Burlington.  The 2014 list is the third annual developed by Livability.com.

Top 10 Foodie Cities, 2014louis lunch 1

  1. New Haven, CT
  2. Scottsdale, AZ
  3. Boston, MA
  4. Asheville, NC
  5. Traverse City, MI
  6. Berkeley, CA
  7. Boulder, CO
  8. Burlington, VT
  9. Omaha, NE
  10. Washington, D.C.


Aging Bridges, Considerable Disrepair Are Significant Challenge in CT, Nationwide

It was in 1983 that three people died in Connecticut when a section of the Mianus River Bridge on Interstate-95 collapsed into the water below, and unsuspecting drivers drove off the end of the road in the middle of the Greenwich night. That tragedy launched a multi-million dollar infrastructure investment program in Connecticut, but now, three decades later, the age and condition of the state’s bridges is front and center again, as a poorly functioning, 118-year-old railroad bridge has disrupted commuter service on the nation’s busiest rail corridor by repeatedly refusing to close. Mianus River Bridge I95

The extent of the nation’s bridge-related challenge is daunting, and yet represents only a portion of the overall infrastructure needs. Less than a year ago, a study released by the American Society of Civil Engineers determined that:

  • over two hundred million trips are taken daily across deficient bridges in the nation’s 102 largest metropolitan regions
  • one in nine of the nation’s bridges are rated as structurally deficient,
  • the average age of the nation’s 607,380 bridges is currently 42 years.

The report also pointed out that “it is of growing concern that the bridges in our nation’s metropolitan areas, which are an indispensable link for both millions of commuters and freight on a daily basis, are decaying more rapidly than our rural bridges.”

bridgesCTOnce every four years, America’s civil engineers provide a comprehensive assessment of the nation’s major infrastructure categories in ASCE’s Report Card for America’s Infrastructure (Report Card). The most recent report was issued in 2013.

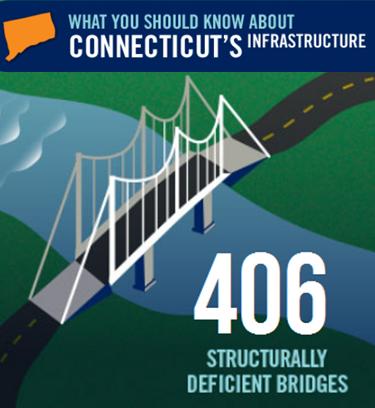
Connecticut, according to the data, has 406 of the state’s 4,208 bridges classified as structurally deficient and another 1,070 are considered to be functionally obsolete. The report also noted that Connecticut has 21,407 public road miles, and 73 percent of the state’s major roads are considered to be in poor or mediocre condition.

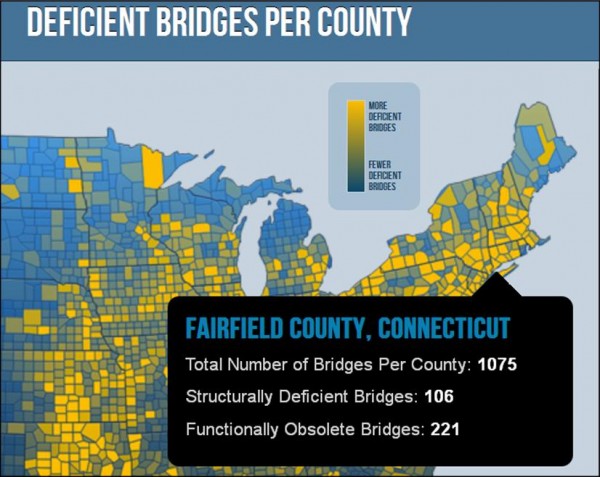
By county, the 406 structurally deficient bridges were: 106 in Fairfield County, 71 in Hartford County, 58 in New Haven County, 45 in New London County and Litchfield County, 27 in Middlesex County, 24 in Windham County and 14 in Tolland County. In addition, the report indicated that Connecticut had 1,023 functionally obsolete bridges in the state.

Structurally deficient bridges “require significant maintenance, rehabilitation, or replacement. These bridges, according to the report, “must be inspected at least every year since critical load-carrying elements were found to be in poor condition due to deterioration or damage.” Functionally obsolete bridges are those that “no longer meet the current standards that are used today. Examples are narrow lanes or low load-carrying capacity.” fairfield bridges

The Federal Highway Administration (FHWA) estimates that to eliminate the nation’s bridge deficient backlog by 2028, an investment of $20.5 billion annually would be needed, according to the report, while only $12.8 billion is being spent currently. The report stated that “the challenge for federal, state, and local governments is to increase bridge investments by $8 billion annually to address the identified $76 billion in needs for deficient bridges across the United States.”

The report indicated that 22 states have a higher percentage of structurally deficient bridges than the national average, while five states have more than 20% of their bridges defined as structurally deficient. Pennsylvania tops the list with 24.4%, while Iowa and Oklahoma are not far behind, each having just over 21% of their bridges classified as structurally deficient.

Overall, the nation’s grade for the condition of its bridges was C+, which was described as “mediocre” and in need of attention. “Some elements exhibit significant deficiencies in conditions and functionality, with increasing vulnerability to risk.” The 32-member Advisory Committee did not include any engineers from Connecticut, but did include two from Massachusetts and one from Maine, among the New England states.

Time magazine reported this week that the I-95 bridge over Delaware’s Christina River was quickly closed to all traffic on May 29, after “an engineer who happened to be working nearby noticed two of the span’s support pillars tilting.“ Officials hope to have the structure stabilized and reopened by Labor Day. The bridge had routinely handled about 90,000 vehicles per day.

The I-35W bridge over the Mississippi in Minneapolis collapsed during rush hour on August 1, 2007, plunging dozens of cars and their occupants into the river, killing 13 people and injuring 145. The bridge was Minnesota's fifth busiest, carrying 140,000 vehicles daily.asce-logo

The American Society of Civil Engineers, founded in 1852, is the country’s oldest national civil engineering organization. It represents more than 140,000 civil engineers in private practice, government, industry, and academia who are dedicated to advancing the science and profession of civil engineering. The first Report Card for America’s Infrastructure was issued in 1988.

Connecticut's Small Business Friendliness Grade Drops to "D"

A new survey of small business friendliness in the nation’s states has dropped Connecticut’s overall grade from D+ to D, and given the state a failing grade in seven of eleven small business friendliness categories.  The grades dropped as compared with last year's survey. Thumbtack.com, in partnership with the Ewing Marion Kauffman Foundation, released the third annual Small Business Friendliness Survey showing that small business owners in Utah, Idaho, Texas, Virginia and Louisiana gave their states the highest rating for friendliness to small business. In contrast, small business owners gave California, Rhode Island and Illinois an "F," while New Jersey joined Connecticut in earning a "D" grade. grade D

More than 12,000 entrepreneurs nationwide participated in this year's survey - the largest of its kind and  the only survey to obtain data from an extensive, nationwide sample of small business owners to determine the most business-friendly locations.

The survey ranked states on specific categories, including: the ease of starting a business, ease of hiring, state and local business regulations, health & safety regulations, employment, labor & hiring regulations, tax code and tax-related regulations, licensing forms, requirements and fees, environmental regulations, zoning and land use regulations, and the availability of training & network programs for small business owners.thumb logos

Connecticut received a B in two categories: ease of hiring and training & network programs, and a D in one: ease of starting a business. In all other categories, Connecticut received an F for small business friendliness.

Some of the key findings for Connecticut, according to the survey of small business owners:

  • Connecticut received a D for its friendliness towards small business, one of the worst grades in the country.
  • Connecticut received the worst grade in the nation for its regulatory friendliness.
  • The state rated in last place for its health and safety, licensing, environmental regulations, and zoning laws.
  • Small businesses in Connecticut had the second worst outlook for the national economy of any state.
  • Female entrepreneurs in Connecticut rated the friendliness of their state government 9 percent higher than their male counterparts.

connecticutIn last year’s survey, Connecticut did not receive a single grade of “F.” The state’s overall grade was D+, and included an A in training & networking,  B in ease of hiring, and  B- in health & safety regulations. Other grades were D+, C- and C. In the first survey conducted, in 2012, Connecticut’s overall grade was D, and the state was not graded F any category.

"Creating a business climate that is welcoming to small, dynamic businesses is more important than ever, but rarely does anyone ask small business owners themselves about what makes for a pro-entrepreneur environment," says Jon Lieber, chief economist of Thumbtack.com. "Thousands of small business owners across the country told us that the keys to a pro-growth environment are ease of compliance with tax and regulatory systems and helpful training programs."

Some of the survey's key findings include:

  • Small businesses in Texas, Utah and Idaho have rated their states in the top five every year this survey has run, while California and Rhode Island have been rated in the bottom five every year.
  • The friendliness of professional licensing requirements was the most important regulatory issue in determining a state's overall friendliness to small businesses. Closely following licensing requirements was the ease of filing taxes.
  • Once again, tax rates were a less important factor than the ease of regulatory compliance in determining the overall friendliness score of a jurisdiction. Two-thirds of respondents said they paid their "fair share" of taxes – that is, they felt like they were neither under-paying nor over-paying.
  • Small business owners who were aware of training programs offered by their government were significantly more likely to say their government was friendly to small business than those who weren't.


Connecticut’s Taxpayer Burden Among Nation’s Highest, Report Finds

The states with low tax burdens are experiencing net immigration, and states with high tax burdens are experiencing high net outmigration, according to an analysis by Governing magazine of data from the Tax Foundation. Connecticut, which the publication lists as having among the nation’s highest taxpayer burdens, is seeing more residents leaving than arriving, the data indicates. The 15 states with high “Tax Burdens and Taxpayer Burdens” are, ranked from highest to lowest, Connecticut, New Jersey, New York, California, Illinois, Massachusetts, Maryland, Hawaii, Rhode Island, Delaware, Vermont, Kentucky, Michigan, Pennsylvania and West Virginia.

Here’s how Governing described the Tax Foundation’s latest annual study: “Across the 50 states, the share of revenue coming from local and state taxes varies significantly, as does the mix of property, sales and income taxes. When measuring the burden imposed on a given state’s residents by all state and local taxes, one cannot merely look to collections figures for the governments located within state borders. There is a significant amount of tax shifting across state lines, and this shifting is not uniform. Further, this shifting should not be ignored when attempting to understand the burden faced by taxpayers within a state.”tax burden map

That is especially true in Connecticut, where significant numbers of residents work in New York, Massachusetts and Rhode Island. Addressing these issues, the Tax Foundation estimates the total state and local tax burdens arising from all sources as a share of state income. The Tax Foundation calls this statistic the "State-Local Tax Burden." In the Tax Foundation's most recent study, covering fiscal 2011, the "State-Local Tax Burden" ranged from a low of 6.9 percent (Wyoming) to a high of 12.6 percent (New York).

According to the report, “New York residents experienced the highest burden at 12.6 percent of income. Next were New Jersey and Connecticut, where residents paid 12.3 and 11.9 percent, respectively. Rounding out the top ten in highest state-local burdens are California, Wisconsin, Minnesota, Maryland, Rhode Island, Vermont, and Pennsylvania. Connecticut taxpayers’ burden has risen 0.8 percentage points from 11.1 percent in 1977 to 11.9 percent in 2011, putting the state in third place.

New York, New Jersey, and Connecticut have occupied the top three spots on the list since 2005. The report notes that “this may be partially attributed to high levels of expenditures which must be sustained by high levels of revenue. Further, in the case of Connecticut and New Jersey, relatively high tax payments to out-of-state governments add to already high in-state payments. This is likely related to the fact that these are high income states that pay high levels of capital gains. High levels of capital gains will result in residents paying an increased share of other states’ business taxes.”

The report also indicates that “Maine and Vermont have the largest shares of vacation homes in the country, and they collect a sizeable fraction of their property tax revenue on those properties, mostly from residents of Connecticut, Massachusetts, and other New England states.”

The organization Truth in Accounting calculates "Taxpayer Burden" -- the per-taxpayer share of the money needed (or available) to pay bills. In fiscal 2011 (the same year as the latest Tax Foundation results), the "Taxpayer Burden" ranged from a low of minus-$34,100 (a surplus, in Alaska) to a high of $50,900 (in Connecticut).

tax burdenAdded Bill Bergman, the director of research for Truth in Accounting, a Chicago-based nonprofit working to “promote truthful, timely and transparent government financial reporting”: “States that rank high on both Tax Burden and Taxpayer Burden face another challenge. The third whammy is that citizens in these states are leaving for other states, taking their taxable spending, property and income with them. It seems reasonable to suspect that their choice to leave may be directly or indirectly related to state fiscal conditions.”

Nationally, state and local tax burdens dropped in 2011 as compared with 2010, largely attributable to incomes rising that year for the first time since 2008, Governing reported. The study methodology noted that “when Connecticut residents work in New York City and pay income tax to both the state and the city, the Census Bureau will count those amounts as New York tax collections, but we count them as part of the tax burden of Connecticut’s residents.”

Since 1937, the Tax Foundation’s “research, insightful analysis, and engaged experts have informed smarter tax policy at the federal, state, and local levels” the organization’s website explains.

With Hockey History, North Carolina and Connecticut Look to Baseball, Attendance Growth

North Carolina and Connecticut – two states forever linked in the cross-currents of sports by the Hartford Whalers relocation to the Tarheel State in 1997, are both using 2014 to heighten their professional baseball credentials. The City of Hartford has announced that the Double A franchise currently in New Britain will be moving to the Capitol City in 2016 in a soon-to-be-built $60 million, nearly 10,000 seat stadium. Just two months ago, the Triple A Charlotte Knights opened their newly constructed 10,200 seat $55 million downtown stadium. The Knights are an affiliate of the Chicago White Sox. Ground was broken on the new stadium in September 2012, about an 18 month construction schedule.

BB_T_Ballpark_media_7suaxdjb_lv2jd5cuThe first Knights game took place on April 11, 2014. (photo at left) The stadium features a two-level club with skyline views as well as a VIP, climate-controlled club with full service bar. In addition to corporate suites, there are 987 club seats at the new Charlotte stadium. Of those, 170 on the upper level sell for $41.50 per game, or nearly $3,000 per season. The remaining 817 club seats, at $21 per game, sell for about $1,500 annually.  All of the club seats were sold out 10 months prior to the season opener, according to the Knights website.  Season tickets require either a two- or four-year commitment. Naming rights to the stadium were sold to BB&T Corporation in 2012. Published reports also indicate that multiple new hotels are expected to open in the area around the stadium in the coming years, along with restaurants and retail.

The Charlotte team’s website reports that “National ballpark consultants conservatively estimate that in its first year BB&T Ballpark should draw at least 600,000 fans just for baseball.” In addition to obtaining corporate sponsorships, among the fundraising initiatives along the way in Charlotte were commemorative bricks sold to be placed in the stadium’s entrance, at a cost of between $90 to $195, containing individual messages determined by purchasers. A portion of the sales went to local charities in Charlotte.

Comparing Attendance Numbers, Possibilities

The Rock Cats drew more than 307,000 fans to their 6,100-seat stadium in New Britain last year, ranking sixth in the 12-team Eastern League. The Knights were last in attendance in the Class AAA International League last year, with an average of 3,803 per game, down from a high of 4,736 in 2006, according to the Charlotte News Observer. In 2013, the New Britain Rock Cats averaged 4,653 fans per game, which ranked 59th among baseball’s minor league teams. Charlotte ranked 80th. The top team in the league - and in minor league baseball - the Columbus Clippers, drew 9,212 per game.

Knights website

The AAA Pawtucket Red Sox average attendance in 2013 was 7,827, ranked #10 in minor league baseball. The Double-A Portland Sea Dogs, also a Red Sox affiliate, ranked 47th, drawing an average of 5,096 per game. Among Double-A teams, Portland ranks tenth.

The top minor league teams, based on average attendance in 2013, are in Columbus, Lehigh Valley, Indianapolis, Sacramento, Dayton, Buffalo, Louisville, Round Rock (Texas) and Albuquerque. The top Double-A teams are in Frisco, TX (7,057); Richmond, VA (6,689); Reading, PA (6,321); Tulsa, OK (5,704); Birmingham, AL (5,669); Corpus Christi, TX (5,498); Trenton, NJ (5,373) and New Hampshire (5,125).

On July 12, 2008, the Rock Cats established a franchise record for single game attendance, with a crowd of 8,115 at New Britain Stadium. The record was broken on June 27, 2009, with a crowd of 8,212. The Rock Cats reached the 8,000 mark once again on May 31, 2014 with a crowd of 8,079.

For those who wonder if there is a Triple A future for a Hartford baseball stadium, the history of Pawtucket may be of interest. The first team to be named the Pawtucket Red Sox debuted in 1970 as a member of the Double-A Eastern League, according to Wikipedia. After three seasons as a Double-A Red Sox affiliate, Pawtucket's Eastern League franchise moved to Bristol, CT in 1973 to make room for the new Triple-A PawSox. And as most Connecticut sports fans recall, the Bristol franchise then moved to New Britain in 1983, first as a Red Sox Double-A affiliate (through 1994) and then as the farm team of the Minnesota Twins.IMG_6669

And might the presence of a stadium in Hartford, rather than New Britain, cause the Red Sox to return with an affiliate in Connecticut? Apparently not any time soon. The Sox appear set in Pawtucket and Portland.

In January 2013, the Portland Sea Dogs announced an extension of their affiliation with the Boston Red Sox as the Double A minor league team. Their contract was set to end after the 2014 season but the extension through the 2018 season was announced during the Portland Sea Dogs Hot Stove Banquet by Red Sox director of player development Mike Hazen and Sea Dogs president Charlie Eshbach. Eshbach served as Eastern League President for 11 years and is the league's longest serving active member  – dating back to his tenure as general manager of the Bristol Red Sox in Connecticut, not too many years after attending college at UConn.

“We are delighted to extend our relationship with the Portland Sea Dogs for an additional two seasons,” said Hazen at the time. “We are extremely fortunate to work with some of the best people in minor league baseball in Portland. The Burke family, Charlie Eshbach, and the entire Sea Dogs organization always go above and beyond to provide support to our players and staff. With the Sea Dogs, our minor leaguers experience the ideal environment to succeed and grow.”

The Sea Dogs are now in their 21st season at Hadlock Field, their 12th as an affiliate of the Boston Red Sox. The Red Sox originally entered into an agreement with the Sea Dogs following the 2002 season, when Portland changed affiliations from the Florida Marlins.

 (photo credit: Rob Kavaler)

rankings

Connecticut Ranked 2nd in Nation in Percentage of Workforce in Financial Industries

Connecticut ranks second in the nation in the percentage of its workforce in the financial industry, just behind Delaware and ahead of New York, Arizona and Nebraska, according to data compiled last month by the U.S. Bureau of Labor Statistics. In Connecticut, 7.9 percent of the workforce is employed in financial industries, which includes finance, insurance and real estate. The data is collected as part of the Current Employment Statistics (CES) program, a monfinancial imagethly survey of about 141,000 businesses and government agencies which provides detailed industry data on employment, hours and earnings of workers on nonfarm payrolls.
Delaware’s 10.3 percent tops the list of states, ahead of Connecticut’s 7.9 percent. The state’s percentage stayed between 8 percent and 9 percent for much of the past decade, dropping below 8 percent for the first time in May 2013. It has been at either 7.9 percent or 8 percent since then in the monthly reports. Between May 2010 and May 2014, Connecticut’s had the second largest decline among states in the percentage of workforce in the financial industry, with a reduction of 0.4 percent, exceeded only by Oregon’s 0.5 percent.

The states with the smallest percentage of workforce in the financial industries are Alaska, Vermont, Mississippi, Wyoming, West Virginia and Arkansas. Washington D.C. also has among the lowest percentages of population employed in the financial industries.

The U.S. average is 5.5 percent.

In terms of growth of the financial industry sector within a state’s workforce, the leading states are New Mexico, Montana,, West Virginia, and Delaware, among the13 states where there was an increase between May 2013 and May 2014. Connecticut was among 21 states were the percentage was virtually identical this year as compared with a year ago.

Higher Percentage of Part-time Workers in CT Than New York, New Jersey, Lower Than New England

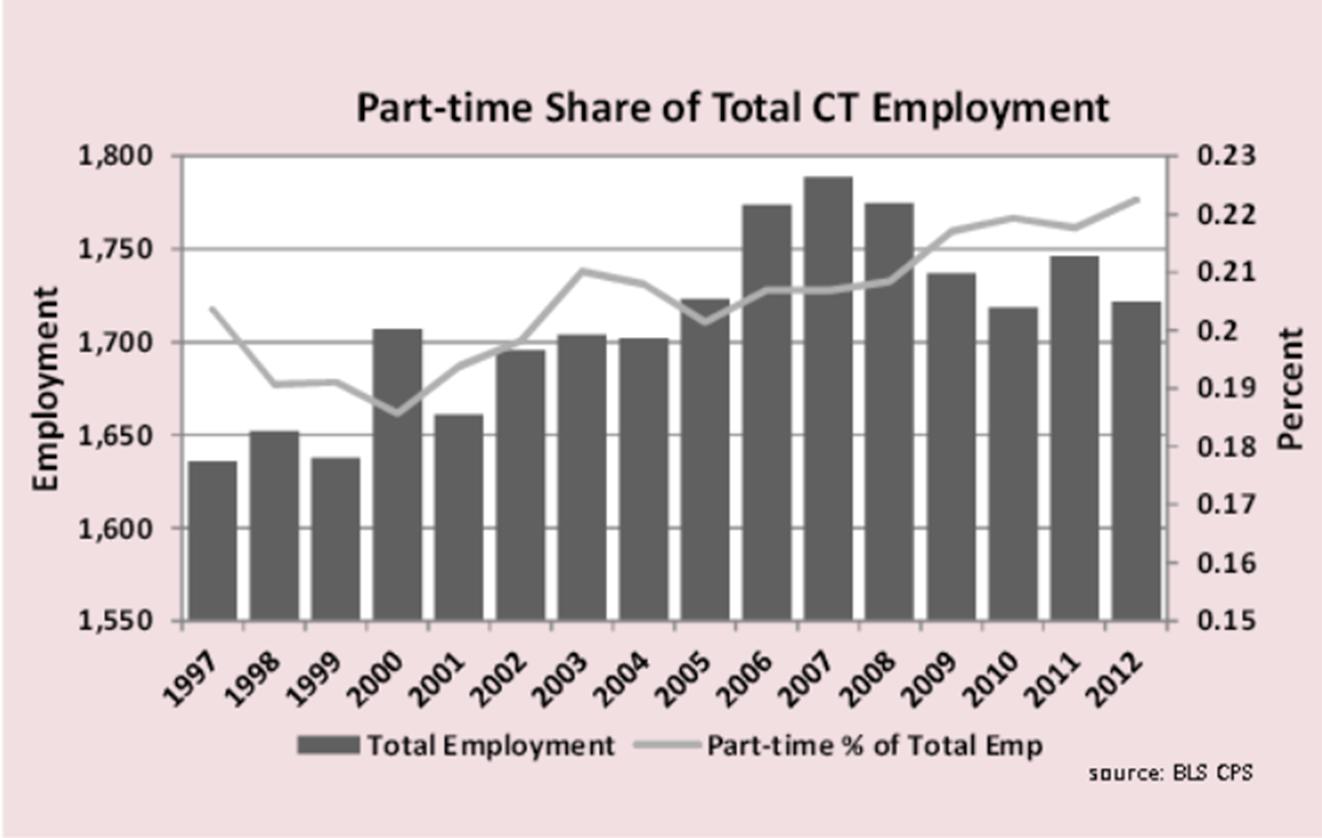
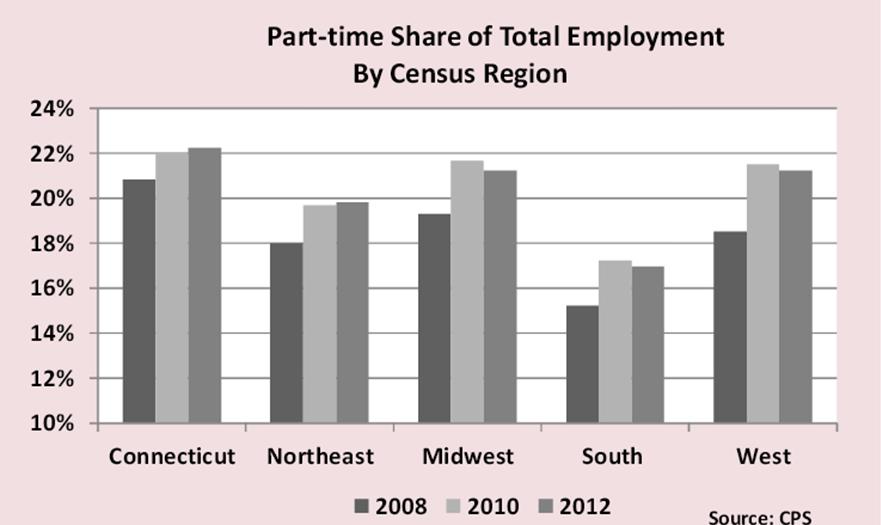
Connecticut's percentage of part-time workers (22.2 percent) outpaces much of the Northeast, South, Midwest and West, according to the latest Connecticut Economic Digest (CED), produced by the state Department of Labor and Department of Economic and Community Development. In the first examination of part-time employment in more than a decade, the publication noted that part-time employment in Connecticut numbered 383,000 - 69.5 percent of which (266,000) was women. This statewide share is among the highest in the country, which had a 50-state average of 64 percent.

part time chartConnecticut’s part-time employment share of 22.2 percent is the lowest in New England but considerably greater than neighboring states in the tri-state area, which have employment shares respectively of 17.6 percent (New York) and 17.9 percent (New Jersey), the analysis by the state Department of Labor indicated.

Part-time employment is all employment that amounts to less than 35 hours per week. Since 1997 it has averaged about 20 percent of total employment in Connecticut and fell to 18.6 percent in 2000, according to the CED, before climbing.

In recent years it has gradually trended upward and was 22.2 percent of employment in 2012, the most recent year of annual average datCEDa and the basis for the analysis. The breakdown of hours worked shows that Connecticut has less under 35 hours per week employment than other New England states but more than the Northeast region overall. Part-time employment was 23.3% of all New England employment in 2012, higher than any other census division in the country. The other eight census divisions averaged 19.3% with the West- South Central division lowest at 16.4%.
While those choosing to work part time remain the bulk of part-time workers, the number of those working less than full time has grown since 2005 as more workers have their hours cut by employers or were unable to find full-time jobs during or after the recession. From 2009 to 2011, the number of workers who wanted full-time employment but could only find part-time jobs rose 37.5 percent to 33,000 from 24,000, Hartford Business Journal reported. part time 2

The report points out, however, that a majority of part-time employment in Connecticut is due to voluntary reasons, and not a result of prevailing economic conditions. In 2012, voluntary part-time employment in Connecticut was 76.4 percent of all part-time employment, in line with the 50-state average of 76.8 percent.

The industries with the lowest average weekly hours worked are leisure and hospitality, other services, and education and health services. In 2013, these industries averaged 25.8, 30.9, and 31.2 work hours per week, according to the Connecticut Economic Digest report issued in May.