Legislatures Consider Changes in Transportation Safety in CT, Nationwide

The National Conference of State Legislatures (NCSL), in cooperation with the National Highway Traffic Safety Administration, is tracking legislation on a range of traffic safety subjects that have been introduced in the 50 states and the District of Columbia – and is providing updates on the organization’s website.  The site reflects 14 proposed bills in Connecticut, being considered in the General Assembly session that began last month.   Traffic safety topics being tracked nationwide include: Aggressive Driving, Automated Enforcement/Photo Monitoring, Child Passenger Protection, Distracted Driving, Driver’s Licensing, Impaired Driving, Motorcycle Safety, Pedestrian and Bicycle Safety, School Bus Safety, Seatbelts and Occupant Protection, Senior Drivers Issues, Slow-Medium speed vehicles, Speed Limits, and Teen Driver Issues.

Among the proposals being considered in Connecticut is one that would require three-point seat safety belts for school buses and require passengers of a school bus to wear seat safety belts.  A similar proposal would require three-point seat safety belts for school buses that are model year 2019 or newer.  NCSL reports that 20 state legislatures are considering a variety of school bus safety proposals. 

Three proposals would increase fines for distracted driving offenses, including texting or using a hand-held mobile telephone while driving, and one calls for additional funds to be appropriated to the state Department of Emergency Services and Public Protection to “combat distracted driving.”  Connecticut is one of 14 states that have seen distracted driving bills suggested. 

Legislative proposals also include one that would mandate the use of helmets by motorcycle operators and passengers, and another that would regulate the operation of high-speed and low-speed electric bicycles in the state. Twenty-six states in addition to Connecticut have motorcycle safely proposals under consideration.

Members of the legislature’s Planning and Development Committee will consider proposals that call for modifications to urban street design guidelines, in order to “improve the safety, economic life and vibrancy of urban streets.”

Among the nation’s states, the largest number of legislative proposals relate to impaired driving, followed by motorcycle safety, pedestrian and bike safety, drivers licensing, drivers licensing, and school bus safety.

Forty-seven states have begun their 2017 legislative sessions.

40 Years Ago, Transportation and Fiscal Austerity Highlighted Inauguration Day

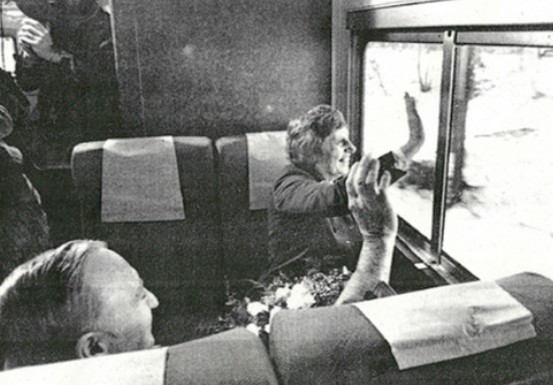
On  inauguration day, Connecticut’s incoming Governor would be “commuting by train to the Capitol for the inauguration to dramatize the need for more mass transit,” local news media reported. The Governor-elect was Ella Grasso, and the year was 1975.  She took the train from her hometown of Windsor Locks into Hartford.

Four decades later, transportation will once again be center-stage on inauguration day, as Governor Dannel Malloy has indicated in the weeks prior to taking the oath of office for a second time that transportation will be a leading issue of his second term. ella train

The Wall Street Journal has reported that a White House economic analysis from July 2014 found that 41 percent of the state’s roads were in poor condition, noting that Connecticut was tied with Rhode Island with the highest percentage of poor roads.  The state is also in the midst of improving the New Haven - Springfield rail corridor, poised to launch a revitalized "Hartford line."

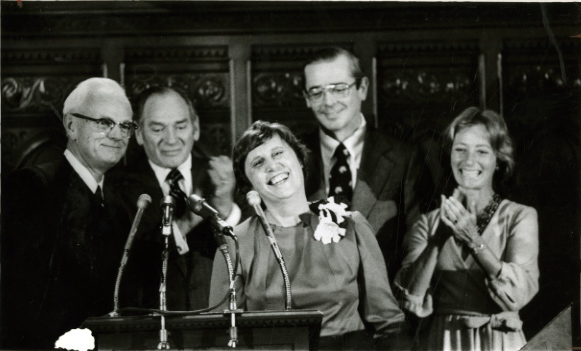
Grasso, according to news reports of the day, also took the opportunity “to emphasize the need for fiscal authority in the face of projected money pr1000px-seal_of_the_governor_of_connecticut.svgoblems for the state.”

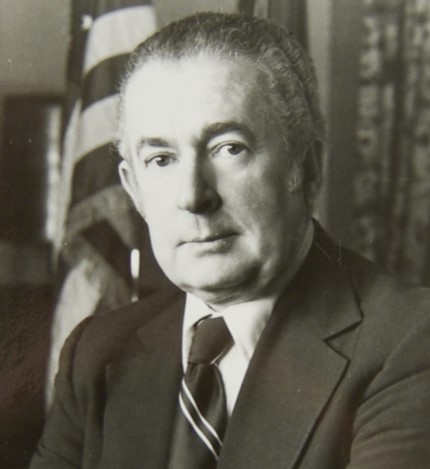
Dollars and sense were also central to the first inaugural address of Governor William A. O’Neill on January 7, 1981.

Published reports indicated “that he favored cutting spending rather than increasing taxes to eliminate a deficit in this year's budget. But he said that balancing spending with existing revenues would be even harder for the fiscal year beginning July 1.”

Speaking before a joint session of the State House of Representatives and Senate, The New York Times reported that Mr. O'Neill said: ''Government at all levels faces increasingly tough decisions, finding itself forced to do more with less. It seems we have only one choice: Curb spending and control taxation.''

O’Neill, who had succeeded to the office just a week earlier upon Grasso’s resignation due to ill health, said 'To maintain a budget balance, we can raise taxes or cut spending even further,'' he said. ''I do not want to raise taxes.''

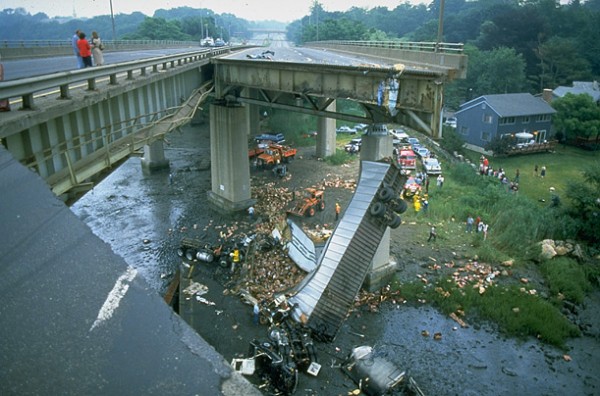
Later in his term, O’Neill would respond to the collapse of the Mianus River Bridge on I-95 in Greenwich on June 28, 19oneill83, which exposed a poor record of road and bridge maintenance in the state, with creation of a Special Transportation Fund to set aside money to maintain and repair the state's bridges.

That same year, the legislature agreed to eliminate tolls from Connecticut roads, in part due to a horrific accident in January at the Stratford tograssoll station that killed seven people and galvanized public opinion.  The state had collected tolls at 14 locations - eight on the Connecticut Turnpike between Greenwich and Plainfield, three on the Merritt and Wilbur Cross Parkways, and at three bridges in the Hartford area. The tollbooths generated $66 million a year, The New York Times reported that year.

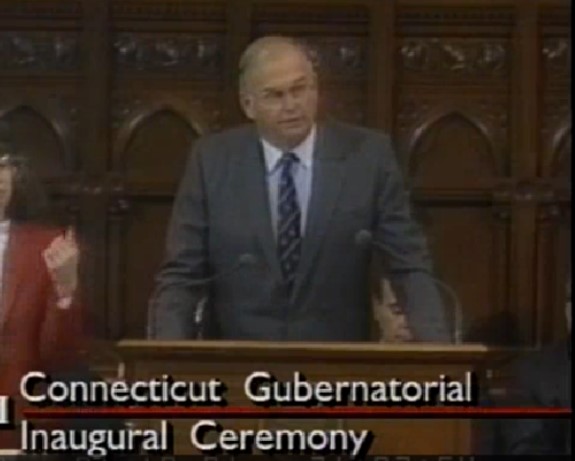
On January 9, 1991, former U.S. Senator and newly elected Governor Lowell P. Weicker said in his inaugural address that “The people of Connecticut have sent us here to do the right thing: to face up squarely to the facts of a state in fiscal trouble.'' Describing the state as ''rudderless,'' he said ''A deficit has taken control of our lives, coloring all else as it climbs beyond comprehension, sapping our confidence, humbling our visions. The past is not worth the best of our courage and creativity. That belongs to the future. 'So let's get this deficit business done, and fast.''weicker

Although he did not propose it on day one, he would soon recommend imposition of a state income tax in Connecticut, which was approved in August 1991 by a reluctant state legislature and signed into law.  Just a few weeks later, Gov. Weicker signed legislation increasing transportation fees by $6 million, clearing the way for dozens of stalled road and bridge projects.  The New York Times reported that the $6 million” will raise the state transportation fund to $63 million” and “insure enough money to pay for road projects for the next six years.”


CT Ranked #20 in U.S. in Commuters Driving Alone; Average Commute is 25 Minutes

In Connecticut, 78.6 percent of commuters drove alone in their own car, truck or van, ranking the state #20 in the nation.  Data compiled by the Bureau of Transportation Statistics of the U.S. Department of Transportation also indicated that 8.2 percent carpooled, 3 percent of the state’s commuters walk to work, 4.8 percent use public transportation, and 4.1 percent worked from home.dot logo The Bureau of Transportation Statistics (BTS) included the data in State Transportation Statistics 2014, a statistical profile of transportation in the 50 states. The data was included in the 12th annual edition of the report, a companion document to the National Transportation Statistics (NTS), which is updated quarterly on the BTS website.

Nationally, in comparison, 76.3 percent of Americans drove alone; 9.7 percent carpooled; 5 percent rode transit; 2.8 percent walked; 4.4 percent worked at home; and 1.8 percent used other modes.

The daily commute to work takes 24.8 minutes on average, for Connecticut residents.  The national average was 25.7 minutes using data compiled in 2012, the most recent year available. transreport

The smallest percentage driving along in their vehicle?  Alaska (66.2%), Hawaii (65.2%), Oregon (71.2%), Massachusetts (71.9%), and Washington (72.2%).  The highest?  Alabama (85.3%), Tennessee (83.6%), Mississippi (83.5%), Ohio (83.3%), South Carolina (82.9%), and Kentucky (82.7%).

Only seven states had a mean travel time to work of less than 20 minutes:  Alaska, Iowa, Kansas, Montana, Nebraska, South Dakota and Wyoming.  South Dakota’s 16.7 minutes was the quickest commute.


bridge hartford


New Haven Leads the Way in Major Transportation Infrastructure Projects Underway

There’s a decidedly New Haven bend to the state’s largest ongoing transportation infrastructure projects.  A listing of the largest Department of Transportation (DOT) projects indicates that of the top 20 projects, eight of them are in New Haven, including four of the top six. The largest project is the construction of the Pearl Harbor Memorial Bridge, better known ats the Q-bridge, which carries I-95 over the Quinnipiac River.  The $417 million project began in 2009 and is slated for completion in 2015.

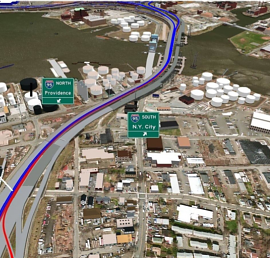
The second largest project is less than a stPearl Harbor Memorial Bridge Projectone’s throw away.  The reconstruction of the I-95/I-91/Route34 interchange in New Haven began in 2011 and is estimated to be completed in 2016, at a cost of $359.9 million.

Ranked as the third largest DOT infrastructure project now underway is the reconstruction of the Moses Wheeler Bridge, which brings I-95 over the Housatonic River in Stratford.

It’s back to New Haven for the fourth largest ongoing project, the facilities improvements to the New Haven Rail Yard, including construction of a component changeout shop.  The estimated cost is $160.9 million, with the project due to be completed next April.

The Hartford-New Britain area of central Connecticut has the fifth largest project, the construction of the CTfastrack bus corridor.  The I-95 West River Bridge replacement in New Haven is number six, followed by catenary replacement in Bridgeport (number 7) and New Haven (number 8).catenary

There are approximately 200 track miles of overhead catenary lines powering trains in Connecticut.  Officials have described the job of replacement those lines “while still operating the nation’s busiest commuter rail services, as a “monumental task.”  The original lines were put in place at the turn of the century – the 20th century – more than 100 years ago.

The full list of the top 20 projects currently underway in Connecticut was compiled by Hartford Business Journal with data provided by the state Department of Transportation.

Aging Bridges, Considerable Disrepair Are Significant Challenge in CT, Nationwide

It was in 1983 that three people died in Connecticut when a section of the Mianus River Bridge on Interstate-95 collapsed into the water below, and unsuspecting drivers drove off the end of the road in the middle of the Greenwich night. That tragedy launched a multi-million dollar infrastructure investment program in Connecticut, but now, three decades later, the age and condition of the state’s bridges is front and center again, as a poorly functioning, 118-year-old railroad bridge has disrupted commuter service on the nation’s busiest rail corridor by repeatedly refusing to close. Mianus River Bridge I95

The extent of the nation’s bridge-related challenge is daunting, and yet represents only a portion of the overall infrastructure needs. Less than a year ago, a study released by the American Society of Civil Engineers determined that:

  • over two hundred million trips are taken daily across deficient bridges in the nation’s 102 largest metropolitan regions
  • one in nine of the nation’s bridges are rated as structurally deficient,
  • the average age of the nation’s 607,380 bridges is currently 42 years.

The report also pointed out that “it is of growing concern that the bridges in our nation’s metropolitan areas, which are an indispensable link for both millions of commuters and freight on a daily basis, are decaying more rapidly than our rural bridges.”

bridgesCTOnce every four years, America’s civil engineers provide a comprehensive assessment of the nation’s major infrastructure categories in ASCE’s Report Card for America’s Infrastructure (Report Card). The most recent report was issued in 2013.

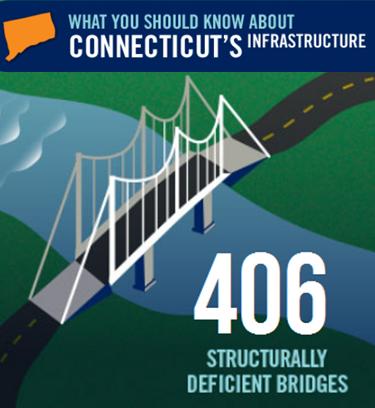
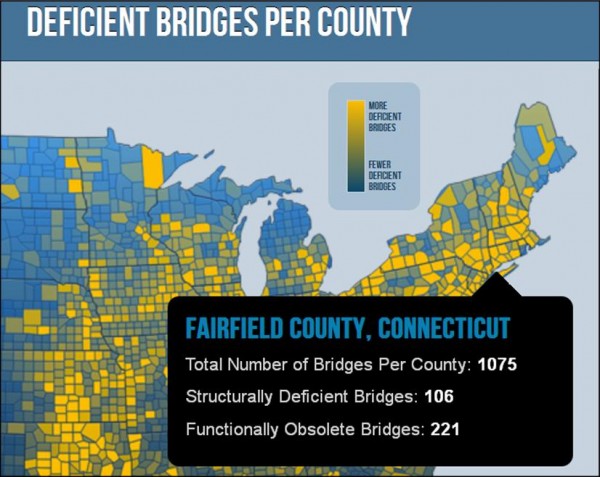
Connecticut, according to the data, has 406 of the state’s 4,208 bridges classified as structurally deficient and another 1,070 are considered to be functionally obsolete. The report also noted that Connecticut has 21,407 public road miles, and 73 percent of the state’s major roads are considered to be in poor or mediocre condition.

By county, the 406 structurally deficient bridges were: 106 in Fairfield County, 71 in Hartford County, 58 in New Haven County, 45 in New London County and Litchfield County, 27 in Middlesex County, 24 in Windham County and 14 in Tolland County. In addition, the report indicated that Connecticut had 1,023 functionally obsolete bridges in the state.

Structurally deficient bridges “require significant maintenance, rehabilitation, or replacement. These bridges, according to the report, “must be inspected at least every year since critical load-carrying elements were found to be in poor condition due to deterioration or damage.” Functionally obsolete bridges are those that “no longer meet the current standards that are used today. Examples are narrow lanes or low load-carrying capacity.” fairfield bridges

The Federal Highway Administration (FHWA) estimates that to eliminate the nation’s bridge deficient backlog by 2028, an investment of $20.5 billion annually would be needed, according to the report, while only $12.8 billion is being spent currently. The report stated that “the challenge for federal, state, and local governments is to increase bridge investments by $8 billion annually to address the identified $76 billion in needs for deficient bridges across the United States.”

The report indicated that 22 states have a higher percentage of structurally deficient bridges than the national average, while five states have more than 20% of their bridges defined as structurally deficient. Pennsylvania tops the list with 24.4%, while Iowa and Oklahoma are not far behind, each having just over 21% of their bridges classified as structurally deficient.

Overall, the nation’s grade for the condition of its bridges was C+, which was described as “mediocre” and in need of attention. “Some elements exhibit significant deficiencies in conditions and functionality, with increasing vulnerability to risk.” The 32-member Advisory Committee did not include any engineers from Connecticut, but did include two from Massachusetts and one from Maine, among the New England states.

Time magazine reported this week that the I-95 bridge over Delaware’s Christina River was quickly closed to all traffic on May 29, after “an engineer who happened to be working nearby noticed two of the span’s support pillars tilting.“ Officials hope to have the structure stabilized and reopened by Labor Day. The bridge had routinely handled about 90,000 vehicles per day.

The I-35W bridge over the Mississippi in Minneapolis collapsed during rush hour on August 1, 2007, plunging dozens of cars and their occupants into the river, killing 13 people and injuring 145. The bridge was Minnesota's fifth busiest, carrying 140,000 vehicles daily.asce-logo

The American Society of Civil Engineers, founded in 1852, is the country’s oldest national civil engineering organization. It represents more than 140,000 civil engineers in private practice, government, industry, and academia who are dedicated to advancing the science and profession of civil engineering. The first Report Card for America’s Infrastructure was issued in 1988.

CT Residents Are Driving Less, Reflecting National Trend

Connecticut residents have cut their per-person driving miles by 3.45 percent since 2005, while the nation’s long term driving boom appears to have ended, according to a report by the ConnPIRG Education Fund. The decline in driving is a national trend, with 46 states including Connecticut having reduced per-person driving since the middle of the last decade.

The 31-page report, “Moving Off the Road: A State-by-State Analysis of the National Decline in Driving,” is based on the most current available government data. The average number of miles driven by Americans is in its eight consecutive year of decline, led Moving Off the Road Thumbnailby declines among Millennials. Connecticut has had the slowest decline in driving in New England, but has the second lowest vehicle miles traveled per person in region, behind Rhode Island. The national trend in driving peaked in 2005.

“It’s time for policy makers to recognize that the driving boom is over. We need to reconsider expensive highway expansions and focus on alternatives such as public transportation and biking—which people increasingly use to get around,” said Abe Scarr, Director of the ConnPIRG Education Fund.

“The Millennial generation is leading the decrease in driving and will be using and paying for our transportation system for years to come.  It is critical that Connecticut plans a system that reflects how people are getting around and want to get around,” said Scarr.  The report noted that “the evidence suggests that the nation’s per-capita decline in driving cannot be dismissed as a temporary side effect of the recession.”

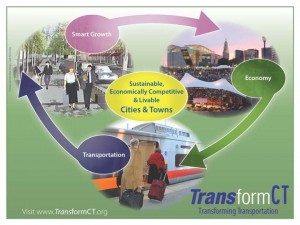
Earlier this year, Governor Malloy and Department of Transportation Commissioner James Redeker launched a multi-year strategic planning process, Transform CT, which aims to “improve economic growth and competitiveness, build sustainability, and provide a blueprint for a world-class transportation system.”  TransformCT_published_Cycle_Small

Transform CT has established an interactive website to gather public input which has collected nearly 300 comments, suggestions or ideas to date, and will be updated with topics and polls regularly as the strategic plan is developed over 18-20 months. In addition, a series of events will be held throughout the fall to engage the public on the future of transportation in Connecticut.

 “Connecticut’s investment in critical transit projects like CTfastrak and the New Haven-Springfield commuter rail line show that transportation decisions better reflect changing travel preferences of residents,” said Ryan Lynch, associate director for the Tri-State Transportation Campaign, a non-profit policy organization.

The Tri-State Transportation Camcars on hwaypaign, a 501(c)(3) non-profit organization dedicated to reducing car dependency in New York, New Jersey, and Connecticut, celebrates its 20th anniversary with a fundraising benefit in New York City on November 7.  The Campaign was formed in the early nineties as a response to the mounting economic and environmental costs of automobile and truck dependence and promising reforms in federal transportation policy. Among the organization’s board members is Norman Garrick, Director of the Center for Transportation and Urban Planning at the University of Connecticut.

North Dakota, Nevada, Louisiana and Alabama are the only states in the nation where driving miles per capita in 2011 were above their 2004 or 2005 peaks, the ConnPIRG report found.  Meanwhile, since 2005, double-digit percent reductions occurred in a diverse group of states: Alaska, Delaware, Oregon, Georgia, Wyoming, South Carolina, the District of Columbia, Pennsylvania, Indiana and Florida.

The states with the biggest reductions in driving miles generally were not the states hit hardest by the economic downturn, according to the ConnPIRG report. The majority—almost three-quarters—of the states where per-person driving miles declined more quickly than the national average actually saw smaller increases in unemployment compared to the rest of the nation, according to the report.

Mathematics and Transportation of Cities Draws New Research Analysis

UConn researchers have collaborated to develop a new index that will measure the sustainability of complex urban transportation systems.  The index will allow policymakers, scientists and the public to understand not just how congested cities’ transportation systems are, but the economic, social, and environmental impacts of the system as a whole.

A team of researchers in UConn’s departments of geography and civil and environmental engineering developed The Transportation Index for Sustainable Places, or TISP.  The new approach is part of the July themed issue of the journal Research in Transportation Business & Management, edited by  Carol Atkinson-Palombo, assistant professor of geography, Norman Garrick, associate professor of civil and environmental engineering, and Wesley Marshall, a former graduate student of Garrick’s who is now a faculty member at the University of Colorado, Denver. TISP

“Policy in developed countries and in the U.S. in particular has tended to focus on relieving congestion and has largely ignored social and environmental impacts associated with expanding freeways,” says Carol Atkinson-Palombo. “This index takes a more holistic approach, which gives a comprehensive sense of the effects of the system.”

The TISP takes into account environmental factors like land use efficiency, minimizing natural resource consumption, and reducing greenhouse gas emissions. Social factors are also measured, such as meeting access needs, incorporating public health and safety and maintaining a community in areas served by transportation. These factors combine with economic measures, such as affordability, self-sufficiency, and efficiency, to create a comprehensive metric, UConn Today reported.

Garrick says that many people only think about transportation in terms of traffic. These so-called congestion indices, he says, are misleading because they are not necessarily about making the city better, but simply moving cars more efficiently.

“In many cities, only 40 percenNewHavenRoute34aftert of the people commuting are in cars,” he points out. “The majority of the people aren’t affected by the congestion index, yet this is the only measure of the impact of the transportation system that is ever discussed in the media.”
Mathematics of Cities

In another initiative aimed at taking a closer look at the function of cities, the view that cities are dissimilar and disordered systems has begun to change.  Patterns have emerged within the supposed chaos, and researchers in economics, physics, complexity theory and statistical mechanics have concluded that cities, mathematically speaking, might actually be basically the same. Though strikingly different in culture and layout, cities like London and Beijing, for example, share many properties with regard to infrastructure, social interactions and productivity.

The new conclusions – decades in the making - are part of a growing field dedicated to the science of cities, Science News, the magazine of the Society for Science & The Public, reports in its most recent edition.   Roughly 75 percent of people in the developed world now live in urban environments. While much of the research is in its early days, eventually it may serve as a powerful, widely used tool for urban planners and policymakers, the publication reports.

Physicist and complex systems scientist Luís Bettencourt of the Santa Fe Institute in New Mexico has developed a theory which captures the interplay between a city’s population, its area, the properties of its infrastructure and its social connectivity. His theory suggests that city planning should not involve grand, top-down projects, but perhaps well-considered smaller ones.

The mathematical work is rooted in and reinforces the view “that cities grow from the bottom up,” says Michael Batty, who trained as an architect, planner and geographer and went on to found the Centre for Advanced Spatial Analysis at University College London. “The diversity of life [in cities] offers greater opportunities for mixing ideas.”

The emerging mathematical theory of cities stands on four basic assumptions:

  1. Cities mix varied people together, allowing them to reach each other.
  2. Cities are networks that grow gradually and incrementally, connecting people.
  3. Human effort isn’t limitless and stays the same regardless of urban size.
  4.   Measures of the socioeconomic output of a city — things like the number of patents awarded or crime rate — are proportional to the number of social interactions.

 “In a nutshell, the city is the best way of creating a vast, open-ended social network that minimizes the cost of moving things in and around an environment,” Bettencourt says. “When people brush up against each other, that’s when the magic of the city happens — the social reactor begins to work.”

Cities Reshape Transportation Mix

At UConn, when the research team used the TISP index to look at transportation in the U.S., they found some not-so-surprising results: areas with higher rates of driving rather than public transportation have greater carbon emissions, and having more cars and highways increases traffic fatality risk.  But despite the prevailing perception, says Garceau, the researchers found that decityveloping varied transportation systems that include a combination of roads and public transportation are more cost-effective than simply building highways.
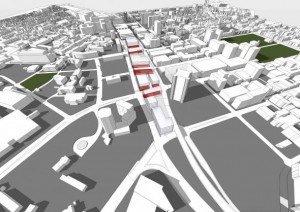
Many cities have already begun to adjust their transportation planning. Some have begun dismantling freeways that run through their downtowns to reconstruct a truly urban atmosphere. New Haven is in the midst of doing precisely that in Connecticut, eliminating the Route 34 connector and replacing it with an urban boulevard that will reconnect city neighborhoods cut off for decades.

Others cities are moving forward with light rail and bus rapid transit systems (such as CTfastrak between Hartford and New Britain, now under construction) and encouraging walking and bicycle use by building compact, mixed-use communities that focus on pedestrians rather than cars.  Garrick points to Cambridge, Mass., Portland, Ore., and New York City as U.S. cities that have taken strides toward sustainable transportation. On a smaller scale, he cites Storrs, the home of UConn’s main campus, for developing a walkable town center from scratch, and planning for greater bus access as the newly-minted downtown area unfolds.