CT Ranks 4th in Participation in Summer Meal Programs for Low-Income Children

Participation in Summer Meal Programs for low-income children increased in Connecticut in 2013 as compared with the previous summer, with 26.4 percent of low-income children receiving summer meals on an average day in July 2013. This represents an increase of 2.4 percent from the previous summer and ranks CT 4th in the nation for participation. summerfoodwebbutton2012
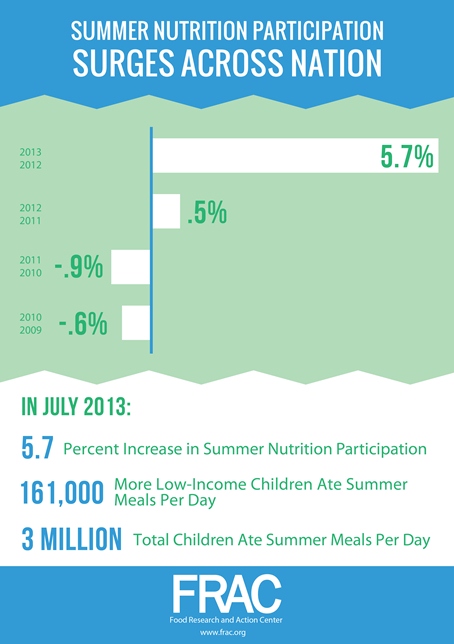
The numbers are increasing nationally as well as in Connecticut. In 2013, for the first time in a decade, the number of low-income children eating summer meals saw a substantial increase year-over-year, according to a report by the Food Research and Action Center (FRAC). Nearly three million children participated in the Summer Nutrition Programs in July 2013, an increase of 161,000 children, or 5.7 percent, from July 2012.

FRAC measures the success of Summer Nutrition Programs at the national and state levels by comparing the number of children receiving summer meals to the number of low-income children receiving school lunch during the regular school year. The programs grew to serve 15.1 children for every 100 low-income children who participated in school lunch during the 2012-2013 school year, a modest increase from the 14.3 per 100 served in the 2011-2012 school year.

Print

End Hunger Connecticut! noted that summer meals in Connecticut still only reached 26.4 students for every 100 low-income children who received regular school year school meals in the 2012-2013 school year. The number of sites increased slightly, from 217 to 236.

“When the school year ends, millions of low-income children lose access to school meals, including about 147,587 in Connecticut. It is in Connecticut’s best interest to ensure that such children have adequate nutrition during the summer so they stay healthy, active and return to school in the fall ready to learn,” Lucy Nolan, Executive Director, End Hunger Connecticut!, said. “While we are extremely proud of our place nationally, we still have a lot of work to do.”

Ranked just above Connecticut in participation were the District of Columbia, New Mexico and New York. Rounding out the top 10 were Vermont, Arkansas, Idaho, Delaware, Maine and Massachusetts.

To further increase the number of Connecticut children who participate in summer meals programs, End Hunger Connecticut! convened partners, community leaders and volunteers to distribute multilingual flyers, posters and other promotional materials at the start of the summer to promote Connecticut’s federally funded free summer meals program.

This year marks the third consecutive year that End Hunger Connecticut! has coordinated ‘blitz days’ in communities across the state to drive summer meals participation. Results of the initiative will be known later this year.

Increasing participation means more nutritious food for hungry children, but it also means more federal funding for communities, officials noted. If every state had reached the goal of 40 children participating in Summer Nutrition in July 2013 for every 100 receiving free or reduced-price lunch during the 2012-2013 school year, an additional 4.8 million children would have been fed each day, and states would have collected an additional $365 million in child nutrition funding in July alone, they point out.

FRAC reportThe Summer Nutrition Programs, which include the Summer Food Service Program and the National School Lunch Program, are designed to fill the food gap for the thousands of low-income Connecticut children who rely on school breakfast and lunch during the school year. These programs provide free meals at participating summer sites at schools, parks, other public agencies, and nonprofits for children under 18.

Connecticut families can find nearby summer meal sites at www.ctsummermeals.org, by calling toll free2-1-1 or by texting ‘CTMeals’ to 877-877.These tools are instrumental for families to find the closest free meals in their communities.

FRAC measures national summer participation during the month of July, when typically all children are out of school throughout the month and lose access to regular school year meals. The national report, including Connecticut data, is available online at www.frac.org

Celebrated DJ Who Started at WCCC Going Strong as Station's Rock Era Ends

There were two milestones in radio broadcasting during the past 12 months that connected to the career of on-air personality and Hartford native Rusty Potz. Last week, Potz’ former radio home, WCCC in Hartford, was sold to new owners who abruptly ended the station’s decades-long rock-n-roll format. It was in the early ‘70’s that Potz was a leading DJ at the Hartford station, which later that decade featured a DJ named Howard Stern. Potz was well known in Hartford, moving on, like Stern, to new opportunities. That’s where the other milestone draws attention. Potz didn’t move too far – to radio station WLNG in Sag Harbor on Long Island. And he has been there ever since – from 1975 though the station’s 50th anniversary celebration last year, and continues on the air six days a week.

As WCCC has slipped away, WLNG is going strong. The station’s oldies format, local news coverage, and community orientation has loyal listeners in high places, as was evident in March this year.

The Sag Harbor Exprrusty potzess reported this spring that WLNG was the prime topic of conversation on the Tonight Show with Jimmy Fallon. Mr. Fallon asked Mr. Joel to join him in crashing Sag Harbor’s oldies station WLNG 92.1 and the singer, a longtime resident of Sag Harbor, enthusiastically agreed, the newspaper reported. The celebrities plugged the small station in front of a nationwide audience—over four million— resulting in a flood of listeners and website traffic for WLNG.

“We’re a nostalgia station,” Potz told the Sag Harbor Express last year. He is the executive vice president and has been with the station for 38 years. “We’re a part of people’s lives… People like a station that’s familiar. They want to know what they can expect. The oldies we play, we have just about every hit that ever came out.”WCCC All Request Radio

Potz earned his degree from the University of Hartford, and has been in radio since 1963 - on 20 different radio stations, most of them in Hartford, New Haven, and Springfield, MA.  At one time, he worked at four stations simultaneously.

In 1967, at WPOP Rusty's show was the top rated evening show in Connecticut, his station biography reports.  In 1969 WAVZ in New Haven received the TV-RADIO MIRROR award for Rusty's show as the top show on the east coast. Rusty was the program director at WCCC in Hartford for many years, including the years when the station featured the "All Request Radio" format, and came to WLNG on September 1, 1975.

The history of WCCC counted numerous broadcasters who went on to enduring careers. Howard Stern is perhaps the best known nationally. But for listeners in Eastern Long Island, Rusty Potz remains a household name.

An additional Connecticut connection was apparent recently. One of Potz’ guests on his WLNG program last month was former Channel 8 newscaster and ESPN broadcaster George Grande. Both were quite prominent on the Connecticut broadcast scene in the ‘70’s. Grande hosted the first edition of SportsCenter on ESPN in 1979, going on to a sportscasting career in New York, Cincinnati and as host of the annual Baseball Hall of Fame induction ceremony for more than two decades.


Child Support Caseloads Climb; Distributions to Families, Children Drop - Opposite of National Trend

From fiscal year 2012 to fiscal year 2013, Connecticut’s child support caseload increased, administrative expenditures climbed, and collections distributed to children and families dropped, setting the state apart from national trends. During the FY2013, total child support collections nationwide increased by one percent from the previous year, to $31.9 billion. The amount distributed to children and families increased by 1.7 percent over FY2012, according to data compiled by the federal Office of Child Support Enforcement and reported by the National Conference of State Legislatures. child support chart

Connecticut’s caseload – 206,221 total cases – ranked the state 28th in the nation, the same position as a year ago. The previous year, Connecticut’s caseload was 202,736. Total distributed collections dropped to $242,343,350 in FY2013 from $245,369,851 in FY201child support wall2.

Nearly 95 percent of the amount collected was distributed to the family while just 5 percent was retained by the state as reimbursement for public assistance, according to the nationwide data. At the same time, caseloads and administrative expenditures decreased nationwide.

In Connecticut, however, the volume of cases increased by just under 3,500. Expenditures climbed from $69,637,919 to $73,001,269.

The largest caseloads in FY2013 were in Texas (1.42 million), California (1.29 million), Michigan (996,000), New York (918,000), Ohio (899,000), and Florida (855,000).

Each year, the federal Office of Child Support Enforcement (OCSE) releases a report detailing information about financial and statistical program achievements based on quarterly and annual data. OCSE compiles this information from status reports submitted by states and tribes detailing program performance.

The complete OCSE FY2013 Preliminary Report is available online.

Best Places for Home Ownership? Glastonbury, Enfield, Terryville Top List

The best places for home ownership in Connecticut are in Glastonbury, Enfield and Plymouth, according to an analysis that included home ownership rates, monthly homeowner costs, median household income, home value and population growth. Glastonbury Center, the Southwood Acres section of Enfield and the Terryville section of Plymouth were ranked as the top three slices of Connecticut for home ownership in the analysis by the website nerdwallet.com, which provides analysis on financial and consumer issues. Rounding out the top 10 were the Kensington section of Berlin, Simsbury Center, Cos Cob, Trumbull, Windsor Locks, Orange and North Haven.home map

NerdWallet looked at 60 communities in Connecticut with populations of at least 5,000 to determine what places were the best for homeownership. Overall, the pointed out that “although its median home value is substantially higher than the national average, Connecticut’s proximity to New York and Massachusetts, and its many commuting options, make the state a top destination for homeownership.”

Of the top three, the website pointed out:

  • With a two-year population growth of 6.95% and an unemployment rate of just 1.4%, Glastonbury Center has all the signs of a top home destination.
  • Up north, near the border with Massachusetts, Southwood Acres is within driving distance of Hartford and Springfield, Mass., and boasts the highest homeowner rate among our top 10.
  • Terryville is the largest village within the town of Plymouth. It has shown relatively strong population growth (2.57%), and is the most affordable median home value among our top 10.

The next ten on the list of best places for home owneership in Connecticut include: 11. Shelton (city), 12. Newington, 13. Stratford, 14. Wethersfield, 15. West Hartford, 16. Bethel, 17. Riverside section of Greenwich, 18. East Haven, 19. Milford (city), and 20. Winsted.

The analysis focused on three main questions:

Are homes available? They looked at the area’s homeownership rate to determine the availability of homes. Areas with a high homeownership rate led to a higher overall score. (A low homeownership rate was seen as indicating competitive inventory, more options for renters rather than buyers and expensive housing.)

Can you afford to live there? They looked at median household income, monthly homeowner costs and median home value to assess affordability and determine whether residents could live comfortably in the area. Monthly homeowner costs were used to measure cost of living. Areas with high median incomes and low cost of living scored higher.

Is the area growing? The website’s analysis measured population growth to determine if the area is attracting new residents and showing signs of solid growth. This was seen as a signal of a robust local economy - another attractive characteristic for homebuyers.

Homeownership rate and population change from 2010 to 2012 each made up 33.3% of the total score, using data from the U.S. Census American Community Survey 5-year estimates. Selected monthly owner costs as a percentage of median household income made up 16.7% of the total score, and median home value made up 16.7% of the total score.


top 20

Most Exciting in Connecticut? New Haven, New London, Hartford Lead the Way

Wondering where the most exciting places are in Connecticut? If New Haven is the first place that comes to mind, you’re right. New Haven was named the “Most Exciting Place in Connecticut,” followed by New London, Hartford, Stamford, and Manchester in an analysis by the real estate website Movoto. Described as “the most thrilling, the most rousing, and the most downright exciting,” the top 10 list for Connecticut includes five Fairfield County municipalities and many of the state's largest cities: TOP10

1. City of New Haven 2. City of New London 3. City of Hartford 4. City of Stamford (tie) 4. Town of Manchester (tie) 6. City of Bridgeport 7. City of Norwalk 8. Town of West Hartford 9. Town of Greenwich 10. Town of Westport

The website’s analysis pointed out that “New Haven had a ton of nightlife and music venues per capita” and was “much more densely populated than most other places in the state.” New London scored points in the website’s analysis for its “high percentage of young folks (just like New Haven, 36 percent between 18 and 34), and for its high number of nightlife options, music venues, and arts per capita.” New London ranked No. 1 in both nightlife and music venues, and No. 2 for its arts.

The highlights for Hartford noted that the Capitol City is “the second-most densely populated place in Connecticut; a good portion of that population is between the ages of 18 and 34- 31 percent, to be exact. With bars like Pourhouse and the Russian Lady, music venues like Webster Theatre, and so many museums, galleries, and festivals we can’t even name them all, Hartford is certainly way more exciting than just insurance.”

In order to come up with the list of 10, the website started out with a list of all the places in Connecticut with populations of 10,000 or more, according to the U.S. Census (2010), which provided 38 towns and cities. Then, they used the Census and business listings to assess:

  • Nightlife per capita (bars, clubs, comedy, etc.)
  • Live music venues per capita
  • Active life options per capita (parks, outdoor activities, etc.)
  • Arts and Entertainment per capita (movie theaters, festivals, galleries, theaters, etc.)
  • Fast Food restaurants per capita (the fewer the better)
  • Percentage of restaurants that are not fast food (the higher the better)
  • Percentage of young residents ages 18 to 34 (the higher the better)
  • Population density (the higher the better)

The municipalities were then ranked with scores from one to 38, where the lower the score, the more exciting the place.

Two Greater Hartford communities, in addition to the city, made the list – Manchester and West Hartford.

“Manchester also scored highly for its number of arts and entertainment options per capita, like the unique MCC on Main,” a program of Manchester Community College located on Main Street in the heart of the town. West Hartford, the website reported, “seemed to find its excitement, not in the nightlife … but in lots of healthy options,” including sports stores, gyms, galleries, theaters and “tons of restaurants.” Westport “really shined” in the number of yoga studios, sports stores, running clubs, parks, and places to get fit.”

Falling just outside the top 10 were West Haven, Stratford, Torrington, Middletown, Groton, New Britain, Storrs, Danbury, Derby and Wethersfield.

exciting

Jonathan's Dream Reimagined to Kick-Off Next Chapter

The original Jonathan's Dream playground, inspired by the Barzach family of West Hartford and built in 1996 as what would become the prototype for Boundless Playgrounds across the country, an inclusive, accessible play space for families and children of all abilities. It was a vibrant playground until 2013, when time and heavy usage of the wooden playground necessitated that it be taken down. But now, community leaders are back at it again, developing plans for what is described as “Jonathan's Dream Reimagined” – a new playground that will be accessible to children of all abilities - and include some new innovations for today's children.  Sunday, July 27, from 12 Noon to 3 PM,  will be the kick-off for the new effort, with free activities for children at the Mandell Jewish Community Center, site of the playground.

The new Jonathan's Dream will be designed to extend the original legacy with an engaging playground that keeps children of all ages and abilities active and moving. Leadership Greater Hartford (LGH) has convened a taskforce of alumni JD_NewLogo from its Quest and Third Age Initiative programs to help rebuild the new Jonathan's Dream, working with the Mandell JCC.. The project is also supported by Shane’s Inspiration and Jumpstart, along with a “Dream Team” of local agencies and individuals who have joined forces to advance the initiative.

Jonathan’s Dream Re-Imagined will be rebuilt three to six months after the needed funds are raised. Donations to help rebuild Jonathan’s Dream will be accepted at the July kick-off event. The project to rebuild Jonathan’s Dream is expected to cost $950,000 and, once funds are raised, will take three to six months to complete.JDEntrance

The original Jonathan’s Dream (photo at right), a wooden, wheelchair- accessible, inter-generational playground, was built by more than 1,000 volunteers in 1996 in memory of Jonathan Barzach, who died before his first birthday. Had Jonathan lived, he would have needed to use a wheelchair for his entire life. His family imagined that in Jonathan’s dreams, he would have wanted children of all abilities to be able to play and celebrate together.

Jonathan’s Dream was one of the first inclusive playgrounds in the country.  It led the way for the nonprofit organization Boundless Playgrounds, which coordinated the construction of similar playgrounds throughout the country.  Today, more than 100,000 children play on more than 200 Boundless Playgrounds in 31 states.

It began in Connecticut, with the inspirational leadership of Amy Barzach, Jonathan's mom. Back in 1994, she was at a playground with her two sons when she noticed a little girl in a wheelchair who could not join in the fun because the playground was not accessible to her.  A year later, she remembered that little girl when disability, then tragedy, reached her family, with Jonathan's passing.  With husband Peter and son Daniel, they began the effort to build an inclusive playground, and called it Jonathan's Dream.

To learn more about Jonathan’s Dream Reimagined please visit www.jonathansdreamreimagined.org.

CT Slips from #18 to #21 in State Bikeability Comparison

Connecticut has dropped from 18th to 21st in the rankings of the bicycle-friendliest states, according to the League of American Bicyclists 2014 survey. Every year, the League ranks all 50 states on their bikeability, based on a mutli-faceted Bicycle Friendly State℠ questionnaire. They look at five categories: Legislation & Enforcement, Policies & Programs, Infrastructure & Funding, Education & Encouragement, and Evaluation & Planning.

Overall, the state received 40 out of 100 points, slightly less that the 40.9 earned a year ago, when Connecticut ranked 18th.

On aBFA_SurveyButton_0 1 to 5 scale, with 5 being the highest grade, Connecticut received a 4 in legislation & enforcement, 3 in policies & programs, 3 in education & encouragement, and a 1 in infrastructure & funding.

The top-ranked states were Washington, Minnesota, Wisconsin, Delaware, Oregon, Colorado, Maryland, Utah and California.  Connecticut, ranked 21st, was between Idaho and Tennessee. The top state in New England for bicyclists was Massachusetts, ranked 10th, according to the survey.bike to work

The survey highlights "10 signs of success" in analyzing each of the states.  Connecticut currently has 6 of the 10 in place, according to the survey report:  an active state advocacy group, Complete Streets policy, state bicycle plan, bicycle safety emphasis in the strategic highway safety plan, bicycle education for police, and a safe passing/vulnerable user law.

The Bicycle Friendly State℠ program is designed to establish best practices in states across the program.  In the 2014 survey, the least bicycle-friendly states were Alabama, Montana, and Kentucky.

The League, established in 1880, represents bicyclists in the movement to create
 safer roads, stronger communities, and a bicycle-friendly America. Through information, advocacy and promotion, the organization works to celebrate and preserve the freedom cycling brings to members everywhere.


Connecticut Ranks #14 in Union Membership

Connecticut’s percentage of union members in its workforce – 13.5 percent - places the state at #14 in the nation for the percentage of union members. The top ten states are New York (24.4 percent), Alaska (23.1 percent), Hawaii (22.1 percent), Washington (18.9 percent), Rhode Island (16.9 percent), California (16.4 percent), Michigan (16.3 percent), New Jersey (16 percent), Illinois (15.8 percent), and Nevada (14.6 percent).

images

At the other end of the scale, the states with the smallest percentage of union members are Utah, Mississippi, South Carolina, Arkansas and North Carolina, all under 4 percent union members, according to data reported by Bloomberg.com.

Connecticut, ranked #14 just behind Massachusetts, has seen its percentage of union membership decline from 16.4 percent in 2000 to 14 percent at the start of 2012 to 13.5 percent at the start of 2013.

Nationwide, union membership has dropped from 20.1% of the workforce in 1983 to 11.2% last year, according to the website 24/7 Wall Street.

The union membership rate is defined as the percent of wage and salary workers that are members of a union. The data on union membership were collected as part of the Current Population Survey (CPS), a monthly sample survey of about 60,000 households that obtains employment information among the nation’s civilian non-institutional population aged 16 and over.

The union membership rate is updated annually by the U.S. Bureau of Labor Statistics. The data used was from 2012; the 2013 data is anticipated in September 2014.

Strong Freedom-of-Information Laws Reduce Government Corruption About 20 Percent, Study Finds

Freedom of Information (FOI) laws in states across the country have reduced the rate at which officials committed corrupt acts by about 20 percent, according to an analysis by Adriana S. Cordis of Winthrop University and Patrick L. Warren of Clemson University. In the immediate aftermath of implementation of strong FOI laws, corruption-conviction rates approximately doubled, suggesting that the regulations made it easier to detect malfeasance. Over time, conviction rates declined, suggesting that overall corruption diminished, the authors say. The changes are more pronounced in states with more intense media coverage, the study noted.

The paper states that “if we consider only state and local convictions per government employee, then the most corrupt states for the years 1986-2009 are Montana, Mississippi, North Dakota and New Jersey, and the least corrupt states are Iowa, Utah, Colorado, South Dakota and New Hampshire.”foi logo

Connecticut, which came to be referred to as “Corrupticut” in the wake of political scandals involving former Gov. John G. Rowland, former State Treasurer Paul Silvester, former Waterbury Mayor Philip Giordano and former Bridgeport Mayor Joe Ganci (among others), is not highlighted in the study. The state was among the first to adopt strong FIO laws in the 1970’s. In the aftermath of the killings at Sandy Hook in 2012, state officials have been revising some of those laws, raising concerns among FOI advocates.

The study indicates that 12 states switched from weak to strong FOIA during their two decade sample period: New Hampshire (1987), South Carolina journal of public economics(1988), Idaho (1991), Utah (1993), Washington (1993), West Virginia (1993), New Mexico (1994), Texas (1996), North Dakota (1998),Nebraska (2001), New Jersey (2002), and Pennsylvania (2003).

“Based on average scores, Connecticut, Indiana, Louisiana, Colorado, and Vermont are among the states with relatively stronger access laws, while South Dakota, Alabama, Arizona, Wyoming and Nevada are among the states with relatively weaker access laws,” the researchers stated.

The authors pointed out that “FOI laws provide clear guarantees regarding the rights of individuals and organizations to access information about government activities, and they make it easier for members of the press and members of the public at large to hold those in power accountable for their actions.”

They conclude that utilizing a variety of econometric specifications, that the short-run effect of a state moving from weaker to stronger FIO laws “is an approximate doubling in the probability that a corrupt act is detected and convicted.” They continue, “corruption conviction rates decline from this new elevated level as the time since the switch from weak to strong FOIA increases.” Cordis stressed to CT by the Numbers that the approximately 20 percent decline in the rate at which officials commit corrupt acts in response to a stronger FOI law is an estimate based on the research.

The paper was published this month in the Journal of Public Economics and has been featured this year on the Social Science Research Network and was highlighted by Harvard Business Review.

s200_adriana.s._cordisAdriana S. Cordis is an Assistant Professor of Accounting at Winthrop University in South Carolina. Her areas of teaching expertise include managerial and cost accounting, and her research focuses on capital-market and transfer-pricing issues. She also has a long-standing interest in corruption from a public policy perspective. Patrick L. Warren is an Assistant Professor in the Department of Economics at Clemson University. His research has focused on decision making in public sector organizations, auditing and political accountability.

Connecticut Energy Costs are Third Highest in the US, Analysis Finds

The only states in the nation with higher monthly energy bills for consumers are Mississippi and Hawaii. Connecticut is ranked as the 3rd most energy expensive state in the country, according to a new analysis by WalletHub, which used six key metrics to rank the swh-best-badges-150x150-2tates according to their tendency to produce the highest or lowest monthly energy bills. The analysis points out that “lower prices don’t always equate with lower costs, as consumption is a key determinant in the total amount of an energy bill.” Connecticut’s monthly energy cost for consumers, according to the analysis, is $404, ranking the state 49th out of 51 (the 50 states plus the District of Columbia). Mississippi’s total monthly cost paid by consumers averages $414, while Hawaii’s is $451.

In terms of specific energy sources, the state ranked 50th in monthly electric cost ($143) and 48th in the cost of natural gas ($94). Perhaps due to the size of Connecticut, the state ranked 14th in fuel cost, at $167 per month, despite the state’s gas tax being among electricity pricethe highest in the nation. (see breakdown below)

In the United States, 7.1 percent of the average consumer’s total income is spent on energy costs, including fuel, natural gas and electricity.

The states with the least expensive energy costs for consumers, taking consumption into account, are Colorado ($301), Washington State ($302), Montana ($305), Rhode Island ($307), Nebraska ($312), the District of Columbia ($314), Pennsylvania ($317), Arkansas ($319), Delaware ($319) and Iowa ($319).

The other New England States, in addition to Rhode Island landing towards the top and Connecticut near the bottom, were bunched in the middle: Massachusetts ranked #35, New Hampshire #26, Vermont #28, and Maine #32. natural gas

Breaking out prices from consumption, Connecticut’s energy picture for consumers as compared with other states, is:

  • 49th – Price of Electricity
  • 16th – Electricity Consumption per Consumer
  • 44th – Price of Natural Gas
  • 48th – Natural Gas Consumption per Consumer
  • 46th – Price of Fuel
  • 10th – Fuel Consumption per Driver

The analysis was released in July because it tends to be the hottest month of the year in the contiguous U.S., and as a result it has the highest energy consumption.wallethub map

If you’re wondering how all this was calculated, WalletHub provides the answer: (Average Monthly Consumption of Electricity x Average Retail Price of Electricity) + (Average Monthly Consumption of Natural Gas x Average Natural Gas Residential Prices) + [Average Fuel Price * (Average Monthly Vehicle Miles Traveled / Average Car Consumption / Number of Drivers)] = Average Monthly Energy Bill Consumers Pay in Each State

WalletHub, described as “the social network for your wallet,” provides data to help readers “make smart financial decisions.” The site points out that “during the summer, when many Americans undergo major life transitions such as relocating to start a new job or start a family, the difference in energy costs among states becomes an important financial consideration.”  Connecticut ranks #49.