Philanthropy 101?  CCSU to Offer Course, Capstone Project Aimed at Boosting Philanthropy

Throughout Connecticut, philanthropic organizations distribute more than a billion dollars every year and individuals donate nearly $4 billion more. Responding to both the State’s philanthropic needs and need for skilled philanthropy professionals, Central Connecticut State University is offering an innovative course in the practice of philanthropy beginning next semester. The ambitious 16-week course is to include 25 presenters from local nonprofit and philanthropic organizations, many based in New Britain, as is the CCSU campus.   As part of the course, students will study local needs, create a case study, and write a proposal following the American Savings Foundation grant-making guidelines.  Officials say that at the conclusion of the course, up to two of these projects may each be funded with a $5,000 grant from the American Savings Foundation.

Connecticut ranked 47th among the 50 states in philanthropic giving as a percentage of income, with a “giving ratio” of 2.4 percent, 25 percent lower than the national average, according to an analysis earlier this year by the Chronicle of Philanthropy. The giving ratio is the total of a locality’s charitable contributions as a share of its total adjusted gross income.

“They will learn more than just philosophy,” points out Professor Carol Shaw Austad, who will co-teach with former CCSU President Richard Judd. “This class is hands-on. Students will work in teams to design a philanthropic strategy. They will meet with New Britain nonprofits and evaluate impact, just like any foundation. We expect them to make a strong case statement for an organization or project.”

“There is so much to like about this course,” notes Maria Falvo, president of the American Savings Foundation.  “For one, many of these young people may go on to work at or volunteer with nonprofits. They may be fortunate enough to become donors themselves. This essential training lays the groundwork for a future in philanthropy,” Falvo says.

The giving percentage varied across the state, according to the Chronicle study:  the Fairfield County giving ratio was 2.8%, New Haven County and Litchfield counties 2.1%, Hartford County 1.9%, New London County 1.8%, Middlesex and Tolland Counties 1.7%, and Windham County 1.6%.

Donations from households earning $200,000 or more now total 52 percent of all itemized contributions. In the early 2000s, that number was consistently in the 30s, the Chronicle reported.  The report raises questions about the traditional habit of charitable donations among middle and low income individuals lessening, perhaps as a lingering after-effect of the recession. The Chronicle’s conclusion: “The number of households making room in their budgets for charitable giving is shrinking.”

CCSU President Dr. Zulma R. Toro said “I am especially pleased that this course engages our hometown of New Britain. This is a perfect example of what we mean by “CCSUConnected.” We are connecting to our communities in a mutually beneficial way by engaging our students academically in the life of our community. Our students learn skills and experiences that can prepare them for rewarding careers, and our communities can benefit from our students’ work focused on New Britain’s needs.”

“These community leaders are such a diverse and thoughtful group,” said Dr. Toro.  “Pastor Thomas Mills of Grace Church shares a session with New Britain Mayor (and CCSU alumna) Erin Stewart.  Dr. Ali Antar of the Berlin Mosque is on the agenda as is Dr. Claudia Thesing, formerly director of development at the New Britain Museum of American Art.  The speakers represent a real cross-section of the community.”

The course will run from January 17 to May 9, and is open to undergraduate students at CCSU.

Senior Citizens Less Diverse, Growing in Percentage of State’s Population

Over 575,000 Connecticut residents are age 65 and older, making up an estimated 16 percent of the state’s total population of 3.6 million, according to U.S. Census data updated through 2016.  Those numbers are expected to grow – steadily and rapidly – during the next two decades, experts anticipate. Among Connecticut’s eight counties, the largest percentage of seniors is in Litchfield County, 19.7 percent, followed by Middlesex County, 18.8 percent, and New London County, 17.1 percent.  New Haven (16.3%) and Hartford (16.2%) counties are next, followed by Fairfield and Tolland Counties, both at 14.8 percent.

The data, highlighted by the Connecticut Office of Legislative Research (OLR)  in a recent report, also shows that “Connecticut’s senior population is less ethnically and racially diverse than the state as a whole.”

Just over 89 percent of the state’s seniors (age 65+) are white, compared with 77 percent of the state’s population as a whole.  While 10 percent of the state’s population are Black or African American, that is true of only 6.4 percent of seniors.  The state’s Asian population is 4.2 percent of the total; among seniors, less than half that, only 2 percent, are of Asian heritage.

While the total state population is almost evenly split between male (49%) and female (51%) residents, the senior population has a larger percentage of females (57%) compared to males (43%), the analysis found.  Connecticut seniors are more likely to be veterans (20% vs. 7% of all residents) and more likely to have a disability (32% vs. 11% of residents).

According to a recent report by the state’s Commission on Women, Children and Seniors, Connecticut is the 7th oldest state in the nation.  Roughly one-third of the state’s population are baby boomers, born between 1946 and 1964.  The state also has nearly 1,000 people over the age of 100.  As has been previously projected, the number of Connecticut towns with at least 20 percent of residents age 65 or older will dramatically increase between 2010 and 2020 (see maps below).  The 65 and older population is expected to grow by 56 percent in Connecticut between 2010 and 2040, compared with  1.5 percent growth in the population between ages 20 and 64.

Approximately 7 percent of Connecticut seniors had incomes which fell below the census poverty level, with an additional 8 percent of seniors having incomes between 100 percent to 149 percent of the threshold, the OLR report indicated. The most common source of income for Connecticut seniors is Social Security, with an average benefit of $20,591 per year, as of 2015. An estimated 90 percent of senior homeowners and renters receive Social Security benefits. The second most common source (50.7%) is personal retirement income, averaging $27,240 per year in 2015.

Of the more than 330,000 senior households, an estimated 76 percent are homeowners and 24 percent are renters. This represents higher home ownership rates than the state as a whole (67% of 1.35 million households).

The most common source of income for Connecticut seniors, the report indicated, is Social Security, with an average benefit of $20,591 per year in 2015. An estimated 90 percent of senior homeowners and renters receive Social Security benefits. The second most common source (50.7%) is personal retirement income, averaging $27,240 per year in 2015.

The demographic characteristics of Connecticut’s senior population (e.g. residents age 65 years and older) used by OLR were largely based on the 2011-2015 American Community Survey 5-Year estimates from the U.S. Census Bureau.

Population Density in Three CT Cities Reaches Top 100 in USA, Data Shows

Bridgeport’s population density, 9,138 people per square mile, is among the top 60 nationally, according to data compiled by Governing magazine for jurisdictions with populations of at least 50,000.  Bridgeport, the state’s largest city, had a population of just over 145,000 living in 16 square miles, the data indicated, ranking at number 58.  It is one of three Connecticut cities in the top 100. The “dense” top ten:  Union City, New Jersey; West New York, New Jersey; Hoboken, New Jersey; New York, New York; Passaic, New Jersey; Somerville, Mass.; Huntington Park, CA.; San Francisco; Jersey City; Paterson, New Jersey and Cambridge, MA.   Boston ranks at #19; Providence is #54. 

Lower on the list of America’s most dense population centers is Hartford, 17 square miles and a population of 123,000, with a population density of 7,091 people per square mile; New Haven, just three notches below Hartford at 6,956, in a city of 130,000 covering 19 square miles.  Both were in the 100 most dense cities; Hartford at #97, New Haven at #100.

They are followed later by New Britain with a land area of 13 square miles at 5,419; West Haven, at 5,071 population density over 11 square miles, and Norwalk, with a population density of 3,869 in an area covering 23 square miles.  Waterbury, at 29 square miles, has a population density of 3,796; Stamford’s population density is 3,430 in a city of 38 square miles.

The data is based on the U.S. Census Bureau, Population Division, estimates current through July 1, 2016.  Governing notes that “jurisdictions with the highest population densities tend to be concentrated in northern regions, particularly the New York metropolitan area.”

According to the 2010 Census, Connecticut overall ranked sixth in the nation in population density, with a population of 3,574,097 and 738 people per square mile.  The state’s population has dropped since that Census, and is now estimated at 3,568,174.  The nation’s densest populations, as of 2010, were in the District of Columbia, New Jersey, Puerto Rico, Rhode Island, and Massachusetts.

CT Companies Praxair and Xerox Are Named to Top 100 Corporate Citizens

Two Connecticut-based companies have been named among America’s Best Corporate Citizens.  Danbury-based Praxair and Xerox, with headquarters in Norwalk, both reached The Just 100, published by Forbes magazine. Praxair, Inc., which ranked at #31 on the Just 100, is an industrial gas supplier in North and South America, with 26,000 employees in more than 50 countries.  It designs, engineers, manufactures and operates facilities that produce and distribute industrial gases. The North America segment operates production facilities in the U.S., Canada, and Mexico. The Europe segment has production facilities primarily in Italy, Spain, Germany, the Benelux region, Scandinavia, and Russia which include approximately 60 cryogenic air separation plants. The company was founded in 1907.

At #54 is Xerox, which provides business process and document management solutions. It provides document technology, services, software and supplies for graphic communication and office printing environments of any size. Xerox, founded in 1906, operates through three segments: Services, Document Technology, and Other. The Services segment is comprised of business process outsourcing and document outsourcing. The Business process outsourcing provides multi-industry offerings such as customer care, transaction processing, finance and accounting, and human resources, as well as industry focused offerings in areas such as healthcare, transportation, financial services, retail and telecommunications.

“The most admired companies understand their responsibilities are twofold – deliver a premium return on assets and make a positive impact on society,” Xerox CEO Jeff Jacobson wrote in the company’s Global Citizenship Report. “The way we see it, we have a responsibility that goes beyond our primary, economic role to helping the people living in our communities to grow and thrive.”

The top 10 were Intel, Texas Instruments, NVIDIA, Microsoft, IBM, Accenture, Cisco Systems, Alphabet, Salesforce.com, and Symantec.

According to a survey of 72,000 Americans, being a “just” company means producing quality goods, treating customers well, minimizing environmental impact, supporting the communities businesses operate in, committing to ethical (and diverse) leadership, and above all, treating workers well, Forbes explained.

With these seven metrics in mind, Forbes — in partnership with Just Capital —analyzed nearly 1,000 of the nation’s largest publicly-traded companies to determine which have the best and most just business behavior.  The result is the Just 100 rankings, which will be featured in the December 26, 2017 issue of Forbes magazine.

https://youtu.be/ambJ_O93Wro

https://youtu.be/F4_eJIoN2us

WRCH, WYBC, WEBE, WCTY Are Top-Rated Stations in CT's Local Radio Markets

The top-ranked radio stations in the Hartford-New Britain market area in November were WRCH-FM, WTIC-FM, and WHCN-FM (River 105.9), according to the latest Nielson Audiosurvey information. Grouped in a flat-footed tie for fourth are three stations:  WKSS-FM, WWYZ-FM and WZMX-FM. Public radio station WNPR-FM is next in the ratings, followed by WTIC-AM, the only AM station to break into the top ten.  The Hartford area is the 52nd largest radio market in the U.S., with a population of 1,081,300.  It is the largest radio market in Connecticut.

Twenty years ago, in 1997, the ratings were also led by WRCH (Lite 100.5), but the runner-up that year was WTIC-AM.  The two stations jockeyed for the ratings lead for the next few years, with WTIC-AM taking a short-lived lead in 2001.  By 2015, WTIC-AM had fallen to eighth, as the dominance of FM stations grew. 

In the New Haven market, the top ranked station in the most recent ratings is WYBC-FM, Yale University’s Urban Adult Contemporary station, followed by WPLR-FM, WKCI-FM, and WEZN-FM.  WYBC has led the ratings race in the nation’s #121 ranked radio market for the past two years.  The population of the New Haven market is 430,300, according to the most recent ratings.

Greater Bridgeport is the #124 ranked market, with a population of 421,100, and its top-rated station is WEBE-FM, playing an adult contemporary format.  Next in the rations are WEZN-FM, WPLR-FM and WICC-AM.

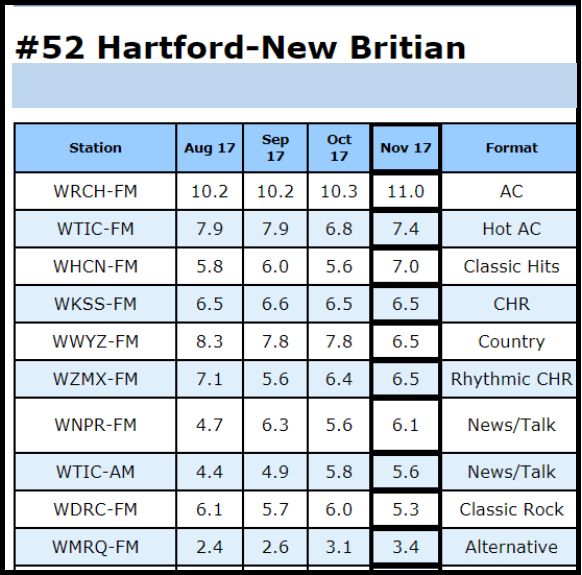
In the Stamford-Norwalk radio market, the dominance of New York based stations is apparent, after Bridgeport’s WEBE-FM, which tops the local ratings.  The two top runners-up are WCBS-AM, New York City’s all-news station, and WHTZ-FM (Z100), with a contemporary hits format.  WEZN-FM, New York sports station WFAN and Urban Adult Contemporary WBLS-FM rank next.  Stamford-Norwalk is the 148th ranked market in the Nielsen Audio reports, with a population of 323,400.

The New London market ratings are led by country station WCTY-FM, followed by WQGN-FM (Q105), WNLC-FM and WKNL-FM.  The market, ranked #178, has a population of 238,300.

According to the second-quarter 2017 Nielsen Total Audience Report, Americans spend 87 percent of their AM/FM radio listening tuning into their three favorite stations (based on the amount of time spent with each). Perhaps even more interesting is that 58 percent of all listening goes to just one station, the listener's favorite station.

Nationally, more than two-thirds of listening happens away from the home. According to the report, at least 65 percent of American adults listen to the radio away from the home between 6 a.m. and 7 p.m. during weekdays. And consumption peaks at 75 percent outside of the home during the afternoon drive time, between 3 p.m. and 7 p.m. during the week. 

CT is 5th Healthiest State in USA; MA Ranks 1st, New Data Shows

Connecticut is the fifth healthiest state in the nation, dropping from third a year ago, but remaining in the nation’s top 10, where it has been every year since 1993. Massachusetts, Hawaii, Vermont, Utah and Connecticut rank as the five healthiest states, while West Virginia, Alabama, Arkansas, Louisiana and Mississippi rank the least healthy.

The United Health Foundation ranked America's states based on a variety of health factors, such as rates of infectious diseases, obesity, physical inactivity, smoking and infant mortality, as well as air pollution levels and the availability of health care providers. The survey has been conducted annually for 28 years.

America’s Health Rankings was built upon the World Health Organization definition of health:“Health is a state of complete physical, mental, and social well-being and not merely the absence of disease or infirmity.”

The model reflects that determinants of health directly influence health outcomes. A health outcomes category and four categories of health determinants are included in the model: behaviors, community & environment, policy and clinical care.

This is the first time Massachusetts has been named the healthiest state, ending Hawaii's five-year ranking at number one. Connecticut’s highest ranking was second, in both 2006 and 2008.

By category, Connecticut ranked fourth in Behaviors, fourth in Clinical Care, sixth in Policy, tenth in Health Outcomes and 15th in Community & Environment.  Connecticut had the third lowest levels of infectious disease, fourth lowest prevalence of smoking and ninth lowest levels of obesity.

The Bay State won the honor in part due to having the lowest percentage of uninsured residents at just 2.7% of the population, plus a low prevalence of obesity and a high number of mental health providers.  Rhode Island moved from 14th to 11th; New York from 13th to 10th

This latest report shows that the nation's health overall is getting worse.  The nation's premature death rate -- the number of years of potential life lost before age 75 -- increased 3% since 2015.  That increase is driven in part by drug deaths, which increased 7% during that time, and cardiovascular deaths, which went up 2%.  Overall, the United States ranks 27th in terms of life expectancy in a comparison of 35 countries, according to the report. Long-term challenges remain — including infant mortality and low birthweight. Cardiovascular deaths and drug deaths also increased.

Connecticut’s strengths, according to the report, include the state’s low prevalence of smoking, low violent crime rate and low percentage of uninsured people.  The state’s greatest challenges include a high drug death rate, high levels of air pollution and a large disparity in health status by educational attainment.

The report also identified the following highlights:

  • In the past year, primary care physicians increased 6%, from 197.8 to 209.4 per 100,000 population
  • In the past two years, children in poverty increased 33%, from 12.3% to 16.3% of children
  • In the past five years, cancer deaths decreased 3% ,from 179.0 to 173.7 deaths per 100,000 population
  • In the past three years, drug deaths increased 67%, from 11.0 to 18.4 deaths per 100,000 population
  • In the past five years, the percentage uninsured decreased 44%, from 9.9% to 5.5% of the population

Health and Safety Among Top Concerns in Choosing Childcare, Survey Finds

When choosing a childcare or preschool, many parents try to gather information to make their decision. Yet only 54 percent of parents were very confident that they could tell if a childcare option would be safe and healthy for their child, according to a new national survey.  Beyond that challenge, 2 out of 3 parents said it’s hard to find childcare options with the characteristics they want. In selecting a childcare or preschool, parents consider a variety of health, safety, educational, or practical factors. Overall, 62 percent of parents agreed that it’s hard to find childcare options with the characteristics they want. The C.S. Mott Children’s Hospital National Poll on Children’s Health asked about these factors in a national sample of parents of children age 1-5 years who attend childcare or preschool.

Nearly half of parents reported their child currently attends preschool (48%), while the other half reported their child attends either a childcare center (25%) or in-home childcare (27%) for at least 5 hours per week.  Most parents (88%) felt that childcare centers and in-home childcare providers should have the same health and safety standards.  Parents selected up to 5 factors they would consider most important when choosing a childcare or preschool. The top 5 factors differed by the child’s current setting:

  • Preschool: staff background checks (45%), active play every day (40%), doors locked (38%), staff have early childhood training (30%), and safe outdoor play area (30%)
  • Childcare center: staff background checks (46%), staff have early childhood training (42%), doors locked (36%), cost (33%), and location/hours (32%)
  • Home childcare: healthy foods served (28%), active play every day (28%), books/educational toys (27%), kitchen area cleaned (26%), and staff background checks (24%)

Connecticut’s Office of Early Childhood provides information on its website, including a “Child Care Checklist for Parents,” to assist in choosing a child daycare program. It suggests asking if the program is licensed, ensuring that unannounced visits are permitted, that there is adequate staff and that the program is safe.  The website also includes an “online lookup tool” to determine licensing status for family child care home providers, group child care homes, child care centers, family child care home staff-substitutes and assistants and youth camps.

A report published last month by Connecticut Voices for Children indicated that for more than a decade, Connecticut has made expanding early care and education programs and wrap-around supports a priority. The state has increased funding for early childhood programs for low-income families and communities,"making a real, sustained effort to build a strong infrastructure to support the early childhood system. Increased spending has increased both the availability and the quality of care."  Those efforts, the study found, "have begun to pay off in terms of both access and quality of care." 

The 39-page report indicated that: • Almost four in every five four-year-olds enroll in preschool. As of 2016, nearly 80% of four-year-olds were enrolled in preschool, an increase of six percentage points since 2005. • Disparities in preschool access have narrowed. The gap in preschool experience rates between the large urban districts and the wealthiest suburban districts has narrowed from 40 percent in 2003 to just 26 percent in 2016. • State programs are serving more infants and toddlers. Head Start and Child Day Care Centers have shifted to address more of the state’s need for infant and toddler care. Combined, they serve almost 80% more infants and toddlers in 2016 than in 2005.

The report stressed, however, that as of 2016, center-based infant/toddler care is affordable to only 25 percent of Connecticut families with a young child. Child care for two young children is affordable to only seven percent of such families.  The need for infant/toddler care "continues to vastly outstrip statewide capacity,"  and community wealth "continues to predict both preschool access and later test scores."

In the national poll, parents identified deal-breakers in selecting childcare – characteristics that would eliminate a preschool or childcare from their consideration. Over half said location in a sketchy area or a gun on the premises would be a deal-breaker; others were: non-staff adults on the premises, unvaccinated children allowed to attend, and having a staff person who smoked.

Some factors rated as most important by the Mott Poll parents may be reflected in the policies of the facility. These include whether staff undergo background checks prior to hiring, whether staff have early childhood certification or training, and whether child and staff members must be vaccinated. For many preschools and childcare centers, this type of information can be found on the facility’s website; it may be more difficult to find such information for in-home childcare providers, the poll analysis pointed out.


Economic Impact of Travelers Championship Doubles in Past Six Years, Analysis Finds; 2017 Tournament is PGA Tour’s Best

The Travelers Championship has an annual economic impact on the state of $68.2 million, according to a recent study by Connecticut Economic Resource Center, Inc.(CERC)  – and the recognition of its success is not only local, but national.  The tournament has been selected by the PGA tour as recipient of the prestigious “Tournament of the Year” award for 2017. The Travelers Championship also won awards for “Most Fan-Friendly Event,” “Best Sales” and the inaugural “Players Choice.” 
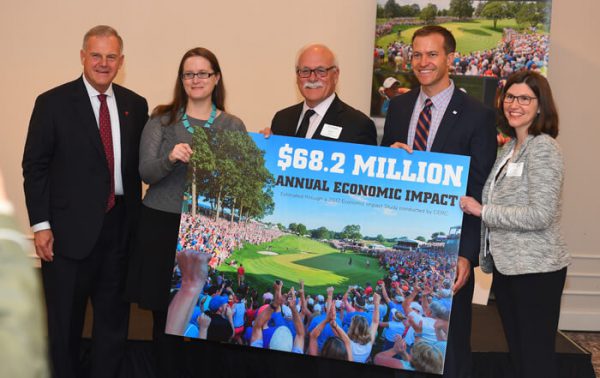
CERC first conducted an impact analysis of the tournament in 2011, and completed another impact analysis for the Travelers Championship in 2017.  The results were compared, to look at the changes over time and factors that may have influenced changes in the tournament’s economic effects.

The results: The economic impact had more than doubled between 2011 and 2017, due to two primary factors; a much larger total number of spectators, especially the increased number of individuals from outside the state, and increased spending by the tournament in preparing for and administering the increased number of events that occur during the tournament week.

“The Tournament activities and events, along with all of its associated events throughout the year has grown substantially over the past few years, which has resulted in a large increase in the number of spectators from Connecticut and beyond its borders,” said Alissa DeJonge, Vice President of Research, CERC. “Attendance increased dramatically, which increased spending at the event and among the local businesses.”

With record attendance, sales and fan engagement, the 2017 Travelers Championship raised the bar across the board through a strategic approach that focused on providing a first-class experience for fans, players, sponsors, volunteers and charity, officials pointed out. This marks the first time that the Travelers Championship has been recognized as “Tournament of the Year.”

The Travelers Championship, which donates 100 percent of its net proceeds to charity, announced last month that the 2017 tournament generated $1.72 million for more than 165 local charities, including The Hole in the Wall Gang Camp, the primary beneficiary of this summer’s tournament. With approximately 4,000 volunteers worked over 80,000 hours.

It is the largest core amount raised in the history of the tournament, officials pointed out. The record-setting 2017 total brings the total money generated to $14.7 million since Travelers became title sponsor in 2007. More than 750 charities have received funds from the tournament over that time.

“We’re proud of the partnerships we’ve built with local organizations that need help,” said Travelers Championship Tournament Director Nathan Grube. “Handing out these checks to so many worthy charities is the highlight of our year. We won’t forget the week we had at TPC River Highlands, with Jordan Spieth winning in such dramatic fashion and the celebration that ensued. But knowing that more than $1.7 million is being given to such a wide spectrum of nonprofits this year reminds us why we do this. It inspires us.”

As the “Most Fan-Friendly Event,” the tournament provided options for fans of all ages, including affordable access, more than 18 food and beverage locations, fan and kid zones and public on-site concerts. The tournament increased fan engagement by 441 percent through creative video and dynamic content, and following Spieth’s thrilling hole-out to win, the tournament handle trended on Twitter for nearly four hours and the video reached YouTube’s front page within 24 hours.

The tournament continued to enhance the player and caddie experience, providing a complimentary charter flight from the preceding event, healthy food options and a variety of special features including caddie appreciation day, a performance by Kevin Nealon and multiple off-site events. To determine the new “Players Choice” category, TOUR players were asked to vote for one event based on tournament services, hospitality, player and family amenities, community support and attendance.

“We work hard on making sure everyone who attends or participates in our event has a world-class experience, so no detail toward that goal is too small,” said Andy Bessette, Executive Vice President and Chief Administrative Officer of Travelers. “We are proud to associate our brand with the PGA Tour and this event, and are honored by this tremendous recognition. The best part is that any success we have means more money and attention raised for so many local charities that partner with the tournament.”

The 2018 Travelers Championship, will be held June 18-24 at TPC River Highlands in Cromwell.

Andy Bessette, Executive Vice President and Chief Administrative Officer of Travelers; Sarah Ficenec and Bob Santy, CERC; Nathan Grube, Tournament Director at Travelers Championship; and Alissa DeJonge, CERC

CT's Mattress Recycle Program Collecting 14,000 Per Month

Connecticut mattress recycling program collected more than 162,000 mattresses and diverted more than 2,300 tons of material from disposal during the 2016-17 fiscal year, according to a recently released report on the state's program. The mattress industry created the Mattress Recycling Council (MRC), a non-profit organization, in 2013 to develop and administer a recycling program, which was dubbed the Bye Bye Mattress Program.  It is  funded through a $9 fee collected from consumers on all mattress and box spring sales in the state.

The program officially began operating on May 1, 2015 in accordance with a new state law. It now averages recycling 14,000 mattresses a month. MRC collects mattresses from 125 communities and 169 public and private entities that dispose of large volumes of discarded mattresses.

On average, 70 percent of a mattress is recycled.  Officials are pushing to increase that percentage to 75 percent.  Program materials suggest that 80 percent of a mattress can be recycled.  In the program’s first two years, a total of 313,661 mattresses were collected for recycling.

Among the leading municipalities, according to the 54-page report:  Hartford - 336 tons, Bridgeport - 197 tons, Manchester - 138 tons, East Hartford - 84 tons, and Southington - 62 tons.

MRC’s education and outreach efforts are designed to inform consumers, mattress retailers, and other stakeholders about the Bye Bye Mattress Program, that the fee is mandated by state law, why the fee is needed, what the fee funds, how to recycle through the Program, and that some parties have obligations.

In addition to Connecticut, MRC operates programs in Rhode Island and California.

Among the many locations across making use of the program is the Naval Submarine Base in New London.  The Base used the program to assist with the recycling and transportation of 692 mattresses from barracks, submarines, and Navy hotel lodging facilities connected to the Base. MRC collected mattresses from the Base in New London three times during the fiscal year.

Despite the program’s achievements to date, one objective is not being met.  Based on MRC’s experience during the past two years, the report points out, it became clear that the healthcare facility goal was “impractical.”

Mattresses discarded by healthcare facilities are not recycled for two primary reasons: biological contamination and mattress residual value, according to the report. In addition, a strong secondary markets exist for specialty hospital mattresses discarded by healthcare facilities. As a result, discarded units are frequently resold domestically or exported, the report explained.

“Therefore, those units are not being landfilled or incinerated in Connecticut and are not available for recycling. Furthermore, healthcare mattresses with breached outer ticking or physical contamination may pose health risks, and are instead disposed of as solid or biological waste due to liability concerns,” the report points out.

https://youtu.be/L9QMPy4VT_Y


Best States for Aging? CT Ranks #18, Study Shows

Connecticut’ senior citizen population ranks 7th in the nation, but the state places at number 18 in an analysis of the nation’s “best states for aging.” As baby boomers move into their elder years, the nation's population – and Connecticut’s - is aging quickly. By 2050, the older adult population is expected to almost double to more than 87 million from 43 million in 2012, U.S. News points in an article highlighting the analysis, which was developed for the magazine by McKinsey & Company.

The Best States for Aging ranking determines which states are most effectively serving their senior citizens by keeping them healthy, financially secure and involved in their communities. States are scored relative to each other in 12 factors that average into one overall score.

The top 10 states were Colorado, Maine, Hawaii, iowa, South Dakota, Wisconsin, Minnesota, Vermont, New Hampshire and Florida.  Massachusetts ranked #12, and Rhode Island was #21.

Among the categories, Connecticut ranked first in "able-bodies", fourth in life expectancy and primary care, 44th in cost-of-living and 49th in cost of care.

Between 2010 and 2030, Connecticut's population of adults age 65 and older will increase by 57 percent, the state’s Legislative Commission on Aging testified in 2016. At least 20% of almost every town's population in Connecticut will be 65 years of age or older by 2025, with some towns exceeding. 40 percent, officials said.  The state has the 3rd longest-lived constituency and is home to more than 1 million baby boomers.

Data sources include: Centers for Disease Control and Prevention, Centers for Medicare and Medicaid, Genworth Cost of Care Survey, Kaiser Family Foundation, Missouri Economic Research and Information Center, U.S. Bureau of Labor Statistics, United Health Foundation.