

New CT Law Responds to Sudden Cardiac Arrest in Student Athletes As Debate Continues
/Research shows that an EKG exam, coupled with a complete medical history, and a thorough physical exam is the best way to prevent sudden cardiac arrest. That statement, on the home page of the organization “Screen Across America,” is followed by this statistic: Cardiac arrest is the #1 cause of death of student athletes.”
Screen Across America is a consortium of organizations that provide heart screenings to students. They have a presence in 26 states; Connecticut is not one of them. The organization “believes that this should be a standard of care because thousands of children die every year from sudden cardiac arrest.” New York, New Jersey, Massachusetts and Vermont are among the states with local organizations advocating for screening.
Connecticut does have a chapter in the Sudden Cardiac Arrest Association (SCAA). The Naugatuck-based chapter raises funds to place Automated External Defibrillators in Connecticut schools. 

A recent article in the Wall Street Journal highlighted the divided opinion among the medical community, as well as athletics departments, athletes and parents. The publication reported that “whether to screen young athletes’ hearts – as is done in nations such as Italy and Israel – represents one of the hottest debates in American cardiology.”
The article noted that opponents and proponents of screening each have medical studies backing up their positions, and that proponents were encouraged recently when the National Institutes of Health and the Centers for Disease Control and Prevention announced they would be creating a registry for studying sudden death among those 24 and younger.
Hartford Hospital’s chief of cardiology, Dr. Paul Thompson, told the WSJ that when a young athlete dies from hypertrophic cardiomyopathy (HCM), “it probably could hve been detected. But when a screen finds it in a young athlete without symptoms, we don’t know that it ever would have caused him problems. Meanwhile, he gest labeled a cardiac cripple for life.” 
The Screen Across America consortium does not have a particular organizational model across all locations. Each locale operates “independently of each other,” the website points out, with some being nonprofits and others for profits. “Some of us charge for heart screenings while others offer it free of charge. Our screening protocols may differ slightly. However, many of us have adopted the Seattle Criteria – a set of guidelines made by international experts in the field of sports cardiology,” the website explains.
Another organization advocating screening is “Parent Heart Watch,” which was founded in 2005, as was SCAA. It was started by four parents who each saw their child die from sudden cardiac arrest (SCA). The organization’s website says that “research has shown that SCA is the leading cause of death on school property with one student athlete falling victim to SCA every three to four days. Heart disease is the second leading cause of disease-related fatalities in youth according to the Centers for Disease Control and Prevention (CDC).” The organization also provides information on timely, effective medical responses to cardiac arrest.
According to the American Academy of Pediatrics, SCA takes the lives of thousands of children every year. The United States Centers for Disease Control and Prevention estimates at least 2,000 such deaths occur annually, according to the website of the Sudden Cardiac Arrest Foundation. During the 2014 Connecticut legislative session, a proposal that became Public Act 14-93 earlier this month was approved, which will direct the State Board of Education, in conjunction with health experts, to develop a sudden cardiac arrest awareness program for use by local boards of education. The program must include information on:
- SCA warning signs and symptoms, including fainting, difficulty breathing, chest pain, dizziness and abnormal racing heart rate
- Risks of continued athletic activity after exhibiting SCA symptoms
- Means of obtaining treatment for a suspected occurrence of SCA
- Proper methods for returning students who experience SCA to athletics.
It will also require school coaches to:
- Review the SCA awareness program each school year, beginning in 2015
- Immediately remove students from play who show symptoms of SCA
- Not permit students removed from play to return without the written clearance of a licensed healthcare professional.
 In addition, it calls for creation of a consent form for parents of student athletes to sign on the warning signs, symptoms and treatment of SCA and relevant school policies. Similar legislation has already been adopted in Pennsylvania, several other states are also considering SCA bills, according to the SCAF. The provisions of the new law take effect a year from now, with the school year that begins in the fall of 2015.
Connecticut’s legislation was inspired in part by the tragic story of Andy Peña, a Darien student athlete who died of sudden cardiac arrest in 2011, just one month away from turning 15. Andy’s parents, Victor and Giovanna, founded the Andy Smiles Forever Foundation in his memory, to educate the general public and support research on the causes and prevention of sudden cardiac death amongst youth, officials said.
http://www.youtube.com/watch?feature=player_embedded&v=hiheVyvFQiA
 Raising Expectations 2014: A State Scorecard on Long-Term Services and Supports for Older Adults, People with Physical Disabilities, and Family Caregivers – an update of the inaugural 2011 Scorecard –
  lex medical tasks – so that their loved ones don’t end up back in the hospital and can continue to live independently at home, according to AARP officials.
 “When it comes to helping older Connecticut residents live in the setting of their choice, this silent army of family caregivers assumes the lion’s share of responsibility,” explains Duncan. “Many juggle full-time jobs with their caregiving duties; others provide 24/7 care for their loved ones. With every task they undertake, these family caregivers save the state money by keeping their loved ones out of costly nursing homes – most often paid for by Medicaid. They have earned some basic support.”

 tion, Mamoun’s, Prime 16, Skappo, Bella’s Care and Da Legna.
 The first Knights game took place on April 11, 2014. (photo at left) The stadium features a two-level club with skyline views as well as a VIP, climate-controlled club with full service bar. In addition to corporate suites, there are 987 club seats at the new Charlotte stadium. Of those, 170 on the upper level sell for $41.50 per game, or nearly $3,000 per season. The remaining 817 club seats, at $21 per game, sell for about $1,500 annually. All of the club seats were sold out 10 months prior to the season opener, according to the Knights


 e rankings is the Washington, D.C., metro area with a score of 77.3, followed by Minneapolis-St. Paul, Portland, Denver, San Francisco, San Jose, Seattle, San Diego, Boston Sacramento and Salt Lake City.
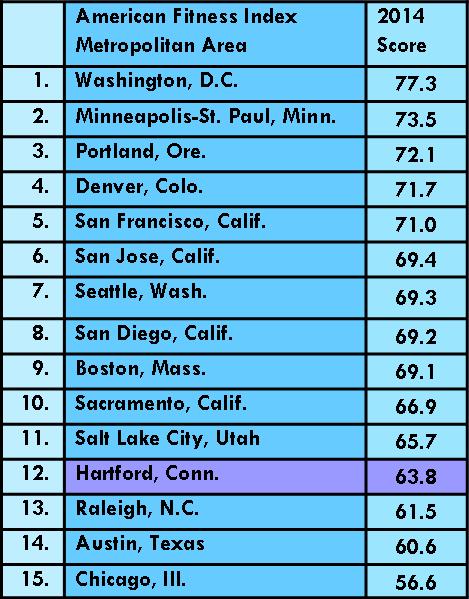 Hartford-East Hartford
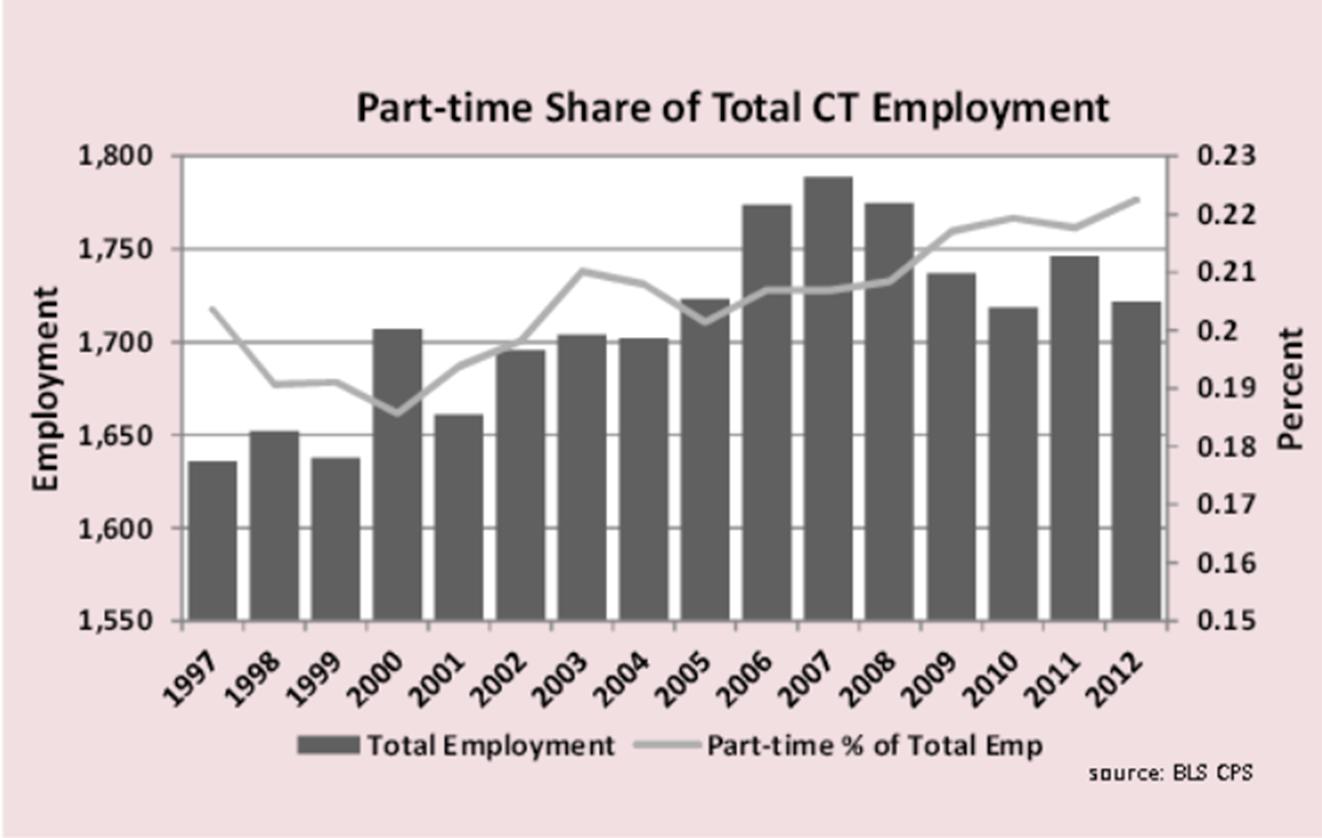
 a and the basis for the analysis. The breakdown of hours worked shows that Connecticut has less under 35 hours per week employment than other New England states but more than the Northeast region overall.
Part-time employment was 23.3% of all New England employment in 2012, higher than any other census division in the country. The other eight census divisions averaged 19.3% with the West- South Central division lowest at 16.4%.
a and the basis for the analysis. The breakdown of hours worked shows that Connecticut has less under 35 hours per week employment than other New England states but more than the Northeast region overall.
Part-time employment was 23.3% of all New England employment in 2012, higher than any other census division in the country. The other eight census divisions averaged 19.3% with the West- South Central division lowest at 16.4%.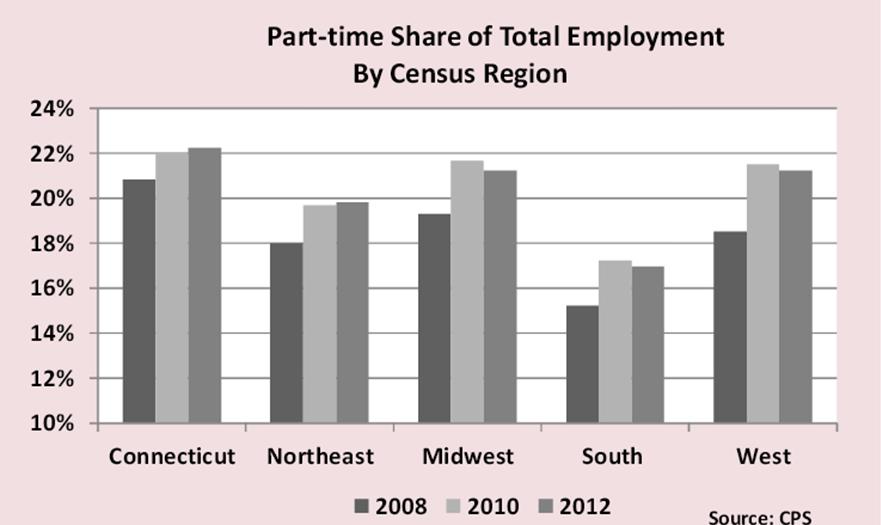
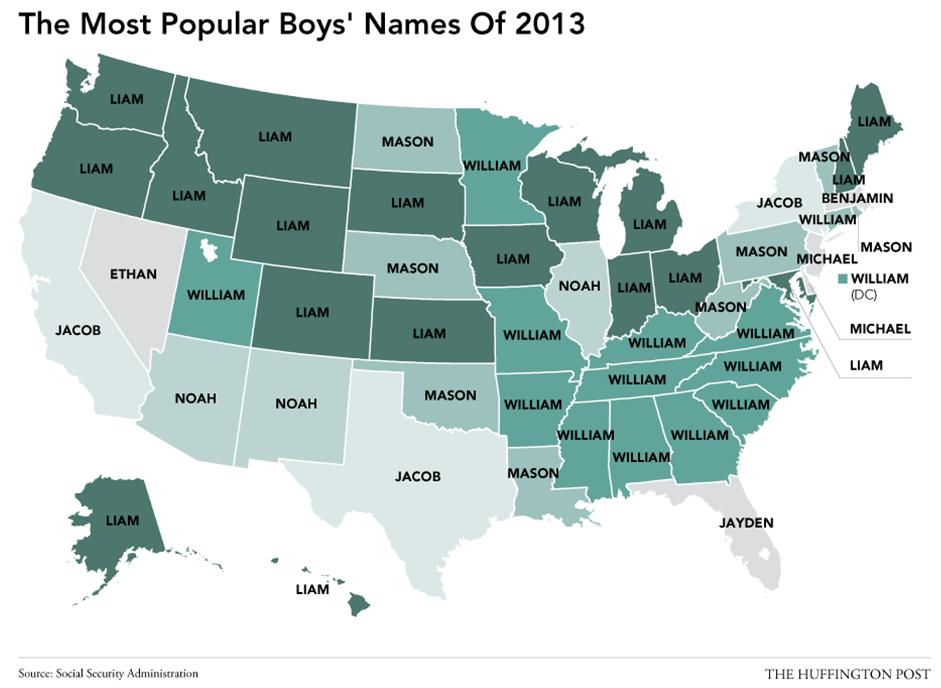
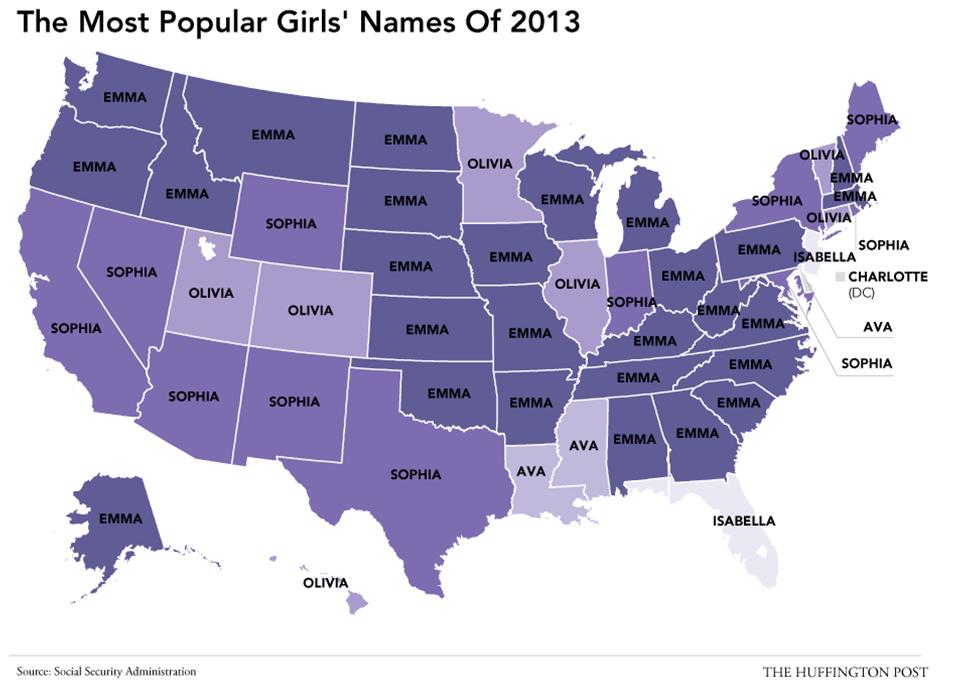
 The top names by state differ from the top national names overall, where Sophia and Noah take the top spots. For the first time since 1960, a new name unseated Michael or Jacob as the most popular for newborn boys, according to the
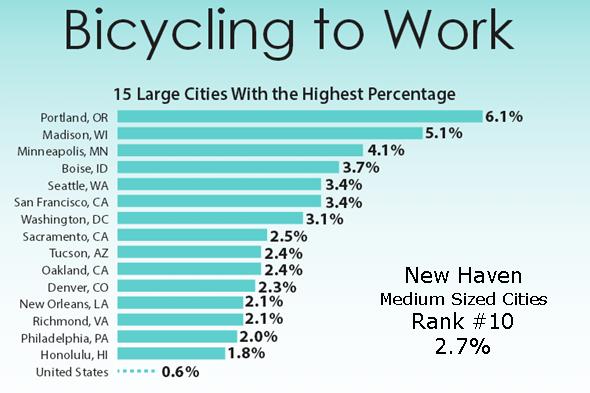 y bicycle remains low, according to the U.S. Census American Community Survey. In 1980, 0.5 percent of workers commuted by bicycle. This rate dropped to 0.4 percent in 1990, where it remained in 2000, before nudging upward in the latest survey.
 Among the nation’s medium sized-cities, (with p
 opulations between 100,000 and 199,999) New Haven ranks at #5 with 12.4 percent walking to work and at #10 with 2.7 percent of the population using bicycles to get to work. Hartford ranks at #10 among the top walk-to-work medium sized cities with 8.2 percent, and did not reach the top 15 in bicyclists.
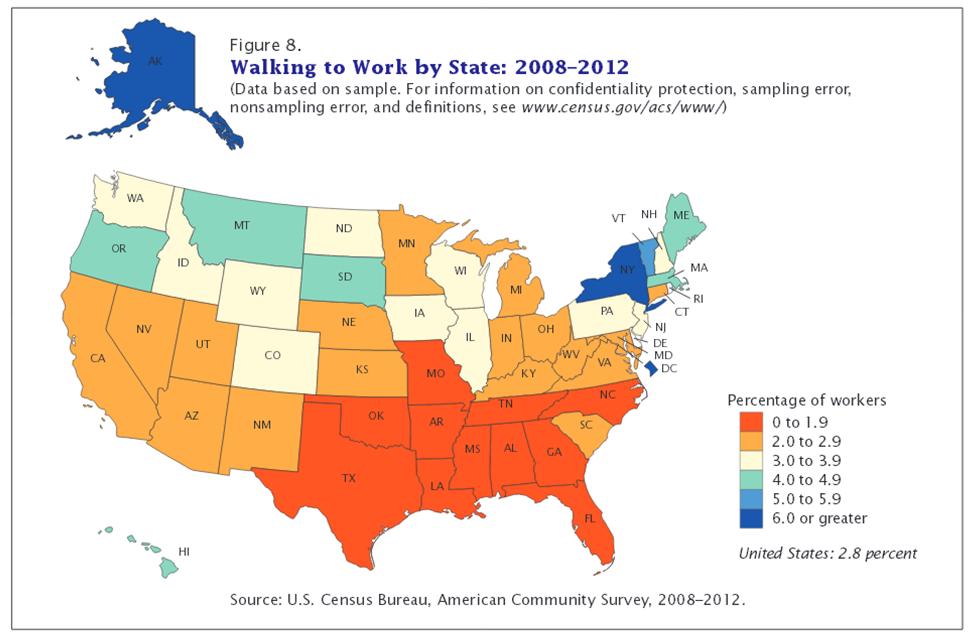 average commute to work in Connecticut is about 25 minutes, ranging from 28 minutes in Fairfield County, 27 minutes in Litchfield County, 26 minutes in Windham County, 25 minutes in Middlesex County and Tolland County, to 24 minutes in New Haven County, 23 minutes in New London County, and 22 minutes in Hartford County.


