Tough New Anti-Smoking Ads to Air in Connecticut, Nationwide

The Centers for Disease Control and Prevention is launching its 2015 “Tips From Former Smokers” campaign with a series of powerful new ads featuring former smokers who suffer from smoking-related illnesses, including vision loss and colorectal cancer. Ads also highlight the benefits of quitting for smokers’ loved ones, and the importance of quitting cigarettes completely, not just cutting down. Cigarette smoking kills more than 480,000 Americans each year and remains the leading cause of preventable death and disease in the United States. For every American who dies from a smoking-related disease, about 30 more suffer at least one serious illness from smoking.

Beginning March 30, the ads will run for 20 weeks on television, radio, billboards, online, and in theaters, magazines, and newspapers. Connecticut is included in the national ad buy, which includes cable TV, magazine, and digital media, according to CDC officials. smoking3

Data from the Centers for Disease Control and Prevention indicate that in 2013, 15.5 percent of Connecticut adults were smokers.  This was lower than the national average of 18.1 percent, and lower than the other New England states, which ranged from 16.2 percent (New Hampshire) to 20.2 percent (Maine).

CDC’s successful Tips national tobacco education campaign has helped prompt millions of smokers to try to quit since it began in 2012, officials said. It has also proven to be a “best buy” in public health by costing just $393 to save a year of life.

“These former smokers are helping save tens of thousands of lives by sharing their powerful stories of how smoking has affected them,” said CDC Director Tom Frieden, M.D., M.P.H.  “These new real-life ads will help smokers quit, adding years to their lives and life to their years.”

In 2014, Tips ads had an immediate and strong impact. When the ads were on the air, about 80 percent more people called the national quitline, CDC officials noted, for free help. Since 2012, Tips ads have generated more than 500,000 additional calls to the toll-free quitline number, 1-800-QUIT-NOW.CDC

Nationally, about 3 in 4 adult e-cigarette users also smoke cigarettes. If you only cut down the number of cigarettes you smoke by adding another tobacco product, like e-cigarettes, you still face serious health risks, according to CDC offcials. Smokers must quit smoking completely to fully protect their health -- even a few cigarettes a day are dangerous, they emphasize.

The agency website, www.cdc.gov/tips, includes personal stories from the campaign.  The website also includes detailed assistance developed by the National Cancer Institute to support smokers trying to quit.

Besides the human cost, smoking takes a devastating toll on the nation’s economy, CDC officials point out. Those costs exceed $300 billion a year—nearly $170 billion in direct medical care for adults and more than $156 billion in lost productivity.

The Tips campaign serves as an important counter to the more than $8.3 billion spent annually by the tobacco industry to make cigarettes more attractive and more affordable, particularly to young people, officials said.

https://youtu.be/GEWky9PEroU


Connecticut Ranks #39 Among States for Retirement; Lowest In New England

Connecticut, ranking 39th overall and lowest among the six New England states, came away with a mixed bag of results on a list of the “Best and Worst Places to Retire,” compiled by the financial data website bankrate.com and published this week. The good news:  Connecticut ranked #6 in crime rate, the state’s highest ranking among the six categories included in the survey, and just outside the top ten at #12 for health care quality.  Undeterred by the challenging February weather this year, Connecticut ranked #14 for weather among the nation’s 50 states.  Not so good – Connecticut ranked near the bottom, at #48, in cost of living, and at the middle-of-the-pack, at #24, for community well-being.

The survey of around 1,000 adults in the U.S. questioned what Americans' priorities are when it comes to retirement. Nearly a quarter of those surveyed said being close to family was the deciding factor. But when it came to climate, while around a quarter prefer being close to a beach, nearly 40 percent of people want access to the great outdoors, rivers and mountains, according to published reports highlighting the survey results.retrirement

The top 10 states were Wyoming, Colorado, Utah, Idaho, Virginia, Iowa, Montana, South Dakota, Arizona and Nebraska.  The highest ranked New England states were Maine at #12, Vermont at #15 and New Hampshire at #16.  Massachusetts came in at #18 on the list, and Rhode Island was just ahead of Connecticut at #38.

By category, Minnesota topped the list in health care quality, Hawaii was #1 in community well-being, New Mexico was #1 in weather, and Mississippi (which ranked #36 overall) had the lowest cost of living.   Vermont had the lowest crime rate and Wyoming the lowest tax rate.

Bankrate provided the following breakdown of the origin of the data used in compiling the rankings:  The cost-of-living data was provided by the Council for Community and Economic Research, a Virginia-based group that tracks retail prices in more than 300 communities around the country. Crime statistics include property and violent crimes reported by police departments to the FBI.senior man

Health care quality scores come from the Agency for Healthcare Research and Quality, a federal office that measures each state's performance on about 160 different health-related issues. The National Oceanic and Atmospheric Administration provided weather data, including readings on temperature, humidity and sunshine. The "well-being" scores for seniors were from Healthways, a research group that works with the Gallup polling service to survey the public about their happiness and general satisfaction with their surroundings.

There are worse places than Connecticut to retire, according to the survey.  Among them:  Oklahoma, Oregon, Missouri, Kentucky, Louisiana, West Virginia, Alaska, and Arkansas, as well as New York and New Jersey.  Hawaii also ranked in the bottom 10, largely due to its highest-in-the-nation cost of living.

As Competency-Based Education Gains Interest, Charter Oak State College Among Leaders

“Competency-based education has the potential to streamline the path to a college degree for a significant number of students, both working adults who can apply their skills and experiences to earn credit for what they already know and other students who prefer self-paced learning over the traditional time-based model of earning credits.” That is the conclusion of a new report analyzing the current status – and future potential – of competency-based education (CBE) in the United States, researched by the American Enterprise Institute’s Center on Higher Education Reform.

The study, “The Landscape of Competency-Based Education,” found that there are currently 34 colleges nationwide that have CBE programs, with at least 18 more colleges working on developing programs.  One of those 34 colleges is Connecticut’s Charter Oak State College, the state’s on-line degree-granting institution.  It is the only Connecticut college highlighted in the report. online-degree

For Charter Oak, the approach is wholly consistent with its mission, not a new concept, and growing in interest and popularity among potential students.

The report indicates that a growing number of colleges and universities are offering, or soon will offer, college credits in exchange for direct demonstrations of learning, NPR recently reported. “That's a big shift from credit hours — the currency of higher education for more than a century — which require students to spend an allotted amount of time with instructors.  A ‘competency’ might be a score on a standardized exam or a portfolio of work. The major argument in favor of competency-based programs is that they will offer nontraditional students a more direct, more affordable path to a degree,” the NPR story indicated.

Charter Oak State College has been very involved in the competency based education national movement for some time. The institution’s President and Provost are part of the steering committee of C-BEN, the Competency Based Education Network which is comprised of colleges who are interested in “pushing the traditional college delivery envelope.”  The initiative is funded by the Lumina Foundation, one of the nation’s most respected education foundations.CBE report

Charter Oak State College President Ed Klonoski participated in a panel of leading higher education innovators in Washington, D.C. to discuss new and emerging models of academic learning and assessment. The panel was moderated by Jamie Merisotis, Lumina Foundation President & CEO (and a Connecticut native), and took place in The Dirksen Senate Office Building nearly two years ago.

Klonoski pointed out that "at Charter Oak we have been offering competency based approaches to higher education since our founding in 1973,” adding that “these approaches are now being highlighted as ways to lower the cost of higher education and accelerate degree attainment."

Panelists addressed the growing importance of identifying and assessing learning outcomes and their impact on shortening the time toward degree completion, and shared insights about innovative and effective models in linking learning and degree attainment.

Also in 2014, the federal Department of Education sought proposals from institutions seeking status as experimental sites focused on competency-based education. Charter Oak submitted an individual college response and a joint response with C-BEN members.  By late last month, the federal agency designated Charter Oak as one of 11 CBEN institutions to participate.

cosc_color 2007-2008Charter Oak’s proposal would create an Experimental Site in financial aid that would offer aid to students for prior learning (established via portfolios and tests), with the aim of making a college degree more affordable and accessible.

The American Enterprise Institute report calls for more data to be gathered in rigorously examining the range of CBE programs being offered and developed, to better identify strengths and weaknesses of the various types of programs, and the students who would benefit most from particular programs.  The report was researched by Robert Kelchen, assistant professor of higher education at Seton Hall University, who noted of the evolving field, “there is still no consensus definition of CBE, even among the institutions that provide it.”  Programs fall into two main areas, according to the report:

  • Well-established prior learning assessments (PLA), which grant credits for content that a student has previously mastered; and
  • Newer competency-based coursework, where students progress toward a degree as they demonstrate mastery of new academic content.

The American Institute plans additional reports on additional aspects of CBE, as the field continues to “catch the attention of federal and state policymakers, foundations, and colleges.”

Women at Disadvantage in Seeking IPO Investments, Research Study Finds

A new study by academic researchers into decisions regarding the financing of Initial Public Offerings (IPO) of fledgling businesses has found "one significant and persistent effect on investor perceptions that did influence those evaluations—the gender of the CEO.” Even though women-owned firms represent almost half of U.S. new businesses, female founders and CEOs of start-ups fared poorly in an IPO simulation involving MBA students, the researchers found – a result of interest to Connecticut’s business start-up, venture capital, and entrepreneurial communities, at a minimum.IPO

The study found that the amount of money that participants recommended for investment in a fictionalized initial public offering for a cosmetic-surgery company was almost 4 times higher if the CEO was identified as male.  In fact, the anticipated share price of IPOs led by male CEOs was approximately 11 percent higher than those of female-led IPOs, suggesting that bias explains why successful female-led IPOs are an "extremely rare phenomenon," the researchers point out.

The paper,recently  published and now available through the Social Science Research Network, was conducted by Lyda S. Bigelow, Leif Lundmark and Robert Wuebker of the University of Utah and Judi McLean Parks of Washington University in St. Louis.McLean Parks, JudiLyda Bigelow

Skirting the Issues: Experimental Evidence of Gender Bias in IPO Prospectus Evaluations,” stresses that “given the impact of entrepreneurial activity around the world, the question of how entrepreneurs finance their ventures is a crucial question, as adequate capitalization for a new venture can make the difference between firm survival and failure. Whether a spin-off or start-up, firms that seek to grow beyond initial size at founding rely on the decisions of potential investors for the necessary financial resources.”

Given that women executives are present in the top management teams of IPO firms in increasing numbers, the lack of female-led IPO firms is a “curious fact, especially since women-owned private businesses represent almost half of the new businesses formed in the United States, with patterns of founding similar to male-owned businesses.”

In the study, using a sample of MBA students the researchers constructed a simulated initial public offering (IPO) manipulating the gender demographics of the top management team. Their results suggested that female CEOs “may be disproportionately disadvantaged in their ability to attract growth capital when all other factors are controlled.”

Despite identical personal qualifications and firm financials in the scenario, the study results indicated that:

  • firms led by females were seen as having a poorer strategic position than those led by males,
  • female Founder/CEOs were perceived as less capable than their male counterparts, and
  • IPOs led by female Founder/CEOs were considered less attractive investments.

“The disparity is significant, as is its potential economic and social impact,” the researchers state. “If companies led by females are disadvantaged in their ability to raise cash through the stock market, it can impact the viability and financial health of their companies, their ability to expand and compete in an increasingly global and competitive environment, and if they are unable to remain viable, their employees’ livelihoods.”

The 43-page research report also suggests that gender bias may extend beyond IPO’s to other disciplines within the financial world, and urge additional study.

Future research, they suggest, “could explore whether or not these findings extend to financial professionals such as bank loan officers or venture capital investors, and could investigate the role that prior experience plays in that process. This is an important question, as financial professionals, making investment decisions for individuals and institutions, control enormous amounts of money (for example, the combined assets of the nation’s mutual funds exceed $7.4 trillion, retirement funds exceed $2.7 trillion, closed end funds exceed $20 billion and exchange traded funds weigh in at $174 billion,” the research team pointed out.

Photos:  Judi Parks (left), Lyda Bigelow

Simsbury, Trumbull Are Best Communities for Young Families, Analysis Shows

Simsbury, Trumbull, Kensington, Glastonbury and Orange are the best communities for young families in Connecticut, according to a new analysis by a national financial website. “While parts of Connecticut have some of the highest housing costs in the country,” the website NerdWallet noted, their review of local data “found the communities in the Constitution State that offer young families the best combination of solid schools, great neighbors and affordability.”connecticut

The analysis highlighted three main takeaways:

  • Small towns are a good bet. Eight of the top 10 best cities for young families in Connecticut have populations of less than 30,000 residents.
  • Schools add value. Even though eight of the top 10 cities have median home prices that are above the state median, the excellent schools help families get a solid return on their housing investment.
  • Greater Hartford is a winner. Six of the 10 cities are near Hartford, the state’s capital.young families

The next five communities, following Orange, were Wethersfield, Newington, Winsted, Portland, and North Haven.  West Hartford ranked #11, followed by Terryville (Southington), Bethel, Pawcatuck, Oakville (Watertown) and Shelton.

Data used in the analysis were from the 2013 U.S. Census Bureau’s American Community Survey.  The factors that were considered include:

  • Home affordability – the survey looked at median home value and selected monthly homeowner costs to prioritize affordable communities.
  • Prosperity and growth - reviewing current and past family incomes, NerdWallet calculated the income of residents, as well as the projected long-term growth of each city.
  • Quality of education - the ratings at GreatSchools.org were used to determine the best schools.
  • Family friendliness - the percentage of families with school-age children and the poverty rate for young children. That measure was designed to help determine if an area is not only affordable for families, but if it is also a healthy one for children, NerdWallet explained.

NerdWallet analyzed the data for 47 places in Connecticut — cities, towns and census-designated places (such as Oakville and Terryville). Only places with over 5,000 residents were analyzed.  The data was weighted 30 percent each for home affordability and family friendliness, 20 percent each for prosperity and growth, and quality of education.best families

Simsbury topped the list “because it offers young families an outstanding combination of affordability and quality schools” and Trumbull earned the runner-up slot although it has “the most expensive housing in the top 10” because “young families get top value for their housing dollar.”

The website also pointed out that Wethersfield “has done exceptionally well economically in recent years: median family incomes have jumped 89% since 1999, the largest gain in the top 10” and  Glastonbury residents “experienced an 85% jump in median income since 1999.”

Last year’s top 10 included Westport, Wallingford, Milford, Darien, and West Hartford, which all dropped out of the top 10.  New to the top 10 this year were Winsted, Portland, Glastonbury, Kensington, and Simsbury.  The population cut-off for last year’s list was 10,000; this year it was lowered to 5,000.  Trumbull remained at #2 for the second consecutive year, while Orange slipped from #1 to #5. Simsbury, this year’s best town for young families, did not reach the top 10 a year ago, largely due to its population being under 10,000.

Fearful of Social Ridicule? Depends on Your Personality, Researchers Find

Your overall personality temperament may determine how reticent or fearful you are in approaching and handling new situations, academic researchers have found.  Individuals who are more likely to fear being judged harshly by others are also likely to avoid, rather than be open to, new experiences “because of increased risk of behaving in ways that produce social ridicule.” Of the five overarching personality temperaments - Extraversion, Agreeableness, Conscientiousness, Emotional Stability and Openness – two personality traits demonstrated particular sensitivity to reticence and “fear of negative evaluation,” according to the researchers at the University of Hartford and two other institutions who collaborated in the study.reticence

The researchers explored the interrelationships of reticence and fear of negative evaluation, or negative social judgment, finding that three of the personality dimensions—Openness, Conscientiousness and Agreeableness—were not significant predictors of either reticence or fear of negative evaluation.

Highly reticent individuals appear to give significant power to others to “define their social selves,” as indicated by the direct impact of fear of negative evaluation on reticence.

Extraversion was the only personality trait that directly and negatively predicted reticence, while Emotional Stability (i.e., Neuroticism) was a direct predictor of fear of negative evaluation. The research also confirmed a strong relationship between reticence and fear of negative evaluation.

Thus, if you understand your personality type, you may better understand your likelihood to respond with reticence, hesitance or fear when confronted with a new situation.

journalThe “dysfunctional thinking” and anxiety due to emotional instability or the lack of openness to new experience contributes to fear of negative evaluation, the study concluded. It is this fear of potential negative social judgment that is at the heart of reticence, in which individuals believe that ‘‘it is better to remain silent than to risk appearing foolish.’’

The study, conducted by communication professor Lynne Kelly of the University of Hartford, Michael Hazel of Gonzaga University and James Keaten of the University of Northern Colorado, was published recently in the journal Communication Research Reports.

To reduce reticence, what is needed in addition to communication skills training, is a focus on helping the individual develop more positive thoughts to counteract those that produce fear of negative evaluation, the researchers indicated.

“Rather than thinking ‘I might say or do the wrong thing,’ the person can be trained to think ‘I am well prepared for this meeting and have some good ideas to share,’” Kelly suggested. By helping people become better communicators and training them to replace anxiety-provoking thoughts with realistic yet confidence-boosting thoughts, they can begin to speak up in more situations.

The so-called “big five personality traits” as generally described in psychology and used in the study are:quote

  • Extroversion – Abundant energy, and the tendency to seek engagement and the company of others.
  • Agreeableness - A tendency to be compassionate and cooperative rather than suspicious and antagonistic towards others.
  • Conscientiousness - A tendency to show self-discipline, act dutifully, and aim for achievement.
  • Emotional Stability (neuroticism) - A tendency to easily experience unpleasant emotions such as anxiety, anger, or vulnerability.
  • Openness to Experience - A person who is high in openness to experience is creative, imaginative flexible, curious and adventurous.

Study participants were undergraduate students enrolled in communication or psychology courses at a private, moderately sized western university and local community college. The survey took about 15 minutes for students to complete.

Of the 336 students who responded, 40 percent were female. Ages ranged from 17 to 56, although 81 percent of the respondents were between 18 and 21 years old.  The demographic breakdown was 70 percent reported European American, 7 percent Asian Americans, 6 percent Hispanics, and 3 percent African Americans.  The researchers suggest that additional research would be warranted, with the full-length version of the “Big Five” personality measures, and a more diverse population demographic.


Connecticut Ranks #18 in Payroll to Population Ratio, Analysis Shows

Connecticut ranks #18 in the nation in a measure of Payroll to Population (P2P), based on an analysis of the nation’s 50 states by the Gallup organization. The P2P metric tracks the percentage of the adult population aged 18 and older who are employed full-time for an employer, for at least 30 hours per week.  The rankings cover calendar year 2014. North Dakota (54 percent) had the nation’s highest Payroll to Population employment rate. A cluster of states in the northern Great Plains and Rocky Mountain regions -- including Nebraska, Minnesota, Kansas, Wyoming, Utah, Colorado and Iowa -- all made the top 10 on this measure, according to Gallup. West Virginia (35.6 percent) had the lowest P2P rate of all the states for the second consecutive year.

Connecticut was tied with Vermont with a P2P level of 44.3 percent.  Among the New England states, Connecticut and Vermont ranked in the middle, with New Hampshire ranked at #10, Massachusetts at #15, Maine at #22, and Rhode Island at #34.mpa

The year-long results are based on Gallup daily tracking interviews throughout 2014 with 353,736 U.S. adults. The payroll-employed data does not include adults who are self-employed, work fewer than 30 hours per week, who are unemployed, or are out of the workforce.

The differences in P2P rates across states may reflect several factors, Gallup points out, including the overall employment situation and the population's demographic composition. States with large older and retired populations, for example, can be expected to have a lower percentage of adults working full time. Connecticut has the 7th oldest population in the nation, which may influence the state’s overall ranking. The two states with the lowest P2P in 2014, West Virginia and Florida, have two of the largest proportions of residents aged 65 and older, at 17.3 percent and 16.9 percent, respectively.

Regardless of the underlying reasogallupn, Gallup indicates that the P2P rate provides “a good reflection of a state's economic vitality.”  Gallup also notes that P2P shows a stronger relationship than do unemployment rates with other important economic indicators, such as state GDP per capita.

In the overall rankings, Washington, D.C., had the highest P2P rate of any area in the country, at 56.4 percent, but Gallup points out that “it is unique in being the only entirely urban region in the survey, heavily dominated by the presence of the federal government, and with one of the lowest percentages of residents aged 65 and older (12.3 percent).”


Local Election Officials Less Responsive If They Think You’re Latino, Study Finds

The answers vary, depending who is believed to be asking.  In an academic study, researchers have found that individuals thought to be Latino by local election officials receive less responsive and accurate answers to basic questions seeking information about voting.  It is described as the first large-scale field experiment investigating bureaucratic behavior that provides “causal evidence of discrimination on the basis of ethnicity or race by election officials.” The authors, Ariel R. White, Noah L. Nathan and Julie K. Faller, Ph.D. candidates at Harvard University, have published the results of their 2012 study, “What Do I Need to Vote? Bureaucratic Discretion and Discrimination by Local Election Officials,” in the February 2015 issues of American Political Science Review.  The graduate students contacted more than 7,000 elections officials in 48 states (Maine and Alaska were not included) – and asked two questions via email of the people who are responsible for both implementing voter-ID laws in many states and providing election-related information to voters.study

“We find that officials provide different information to potential voters of different putative ethnicities,” the authors explained.  “Emails sent from Latino aliases are significantly less likely to receive any response from local election officials than non-Latino white aliases and receive responses of lower quality. This raises concerns about the effect of voter ID laws on access to the franchise and about bias in the provision of services by local bureaucrats more generally.”

The field study, in which fundamental voting-related questions were emailed to election officials, was designed to “isolate the effect of ethnicity on real-world performance” of election officials.  It indicates that the officials are less likely to respond to informational inquiries from individuals thought to be Latino.  Emails from Latino names are roughly five percentage points less likely to receive a reply to a question about voter ID requirements than those from non-Latino whites, the Boston Globe reported.

The experiment was designed to determine if “street-level bureaucrats discriminate in the services they provide to constituents.”  The results provide “strong evidence” that they do.  The study concluded that “the responses that Latino emailers received to voter ID questions were less likely to be accurate and were more likely to be non-informative.”  The results “suggest that bias from street-level bureaucrats can occur even when there are not clear strategic reasons for officials to discriminate on the basis of ethnicity.”amerian political science review

The study, just prior to the 2012 election, also indicated that “we find no evidence that whether local officials are elected or appointed, partisan or nonpartisan, or members of specific political parties influences the extent of bias.”

Significantly, given recent court decisions that have rolled back oversight of elections in certain jurisdictions around the country, the study authors indicate that “consistent with the claim that enhanced monitoring reduces discrimination, we find no evidence of bias against Latinos in jurisdictions subject to federal regulation under the Voting Rights Act.”

“These findings have important implications for debates about voter ID laws, and indeed for any changes to voting requirements or election administration,” the authors emphasize in the study’s conclusion.  “Our results indicate that changes to existing voting regulations are likely to differentially increase information costs for Latino voters because public officials are less responsive to their requests for information.”

The 14-page study report also suggests that:

  • There is “some evidence that officials respond at lower rates to Latinos, even when asked a question”
  • “Public officials can be biased even in exceptionally low cost interactions” such as when only a single word answer (“No”) is necessary
  • “If minority voters are less able to acquire information about ID requirements and more likely to be asked for ID at the polls, this could manifest in lower voting rates. This may be greatest where officials are not monitored to prevent discrimination.”

The researchers suggest that future research could “expand the use of experimental methods to examine the presence of bias in service delivery in many other aspects of local administration in the United States” – from” trash collection and snow plowing to the management of welfare offices.”  They raise the question as to whether “similar ethnic or racial biases may affect the quality of services delivered in these other arenas.”

emails


Connecticut, New England Have Lowest Church Attendance, Survey Says

Connecticut residents rank #41 in the nation in regular church attendance, according to a new survey.  The state had plenty of company from New England neighbors at the bottom of the list.  The bottom four slots were occupied by New England states – Vermont at #50, New Hampshire at #49, Maine at #48 and Massachusetts at #47. Rhode Island ranked at #34. In the survey by the Gallup organization throughout 2014, slightly more than half of Utah residents say they attend religious services every week, more than any other state in the union. Residents in the four Southern states of Mississippi, Alabama, Louisiana and Arkansas are the next most likely to be frequent church attendees, with 45 percent to 47 percent reporting weekly attendance.framed church Lee, MA

At the other end of the spectrum is Vermont, where 17 percent of residents say they attend religious services every week.  In Connecticut, 25 percent say they attend religious services weekly.  In addition, 19 percent say they attend nearly weekly or monthly, and 54 percent say they seldom or never attend religious services.

The results are based on Gallup Daily tracking interviews throughout 2014 with 177,030 U.S. adults, and reflect those who say "at least once a week" when asked, "How often do you attend church, synagogue or mosque -- at least once a week, almost every week, about once a month, seldom or never?"

Church attendance self-reports are estimates, Gallup notes, and “may not reflect precise week in and week out attendance, but provide an important measure of the way in which Americans view their personal, underlying religiosity.”

Gallup concludes that “within the U.S. there religious services map
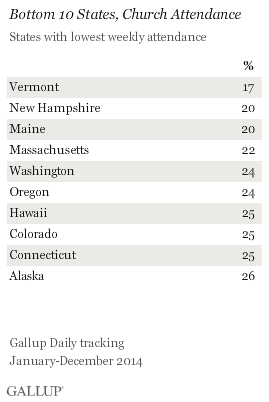
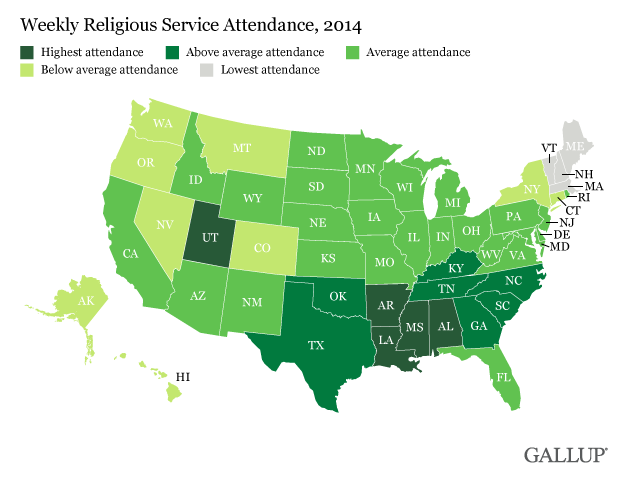
are stark geographic differences in religiosity. In some states of the union -- Utah and Southern states -- roughly half of residents report attending religious services weekly, while in others -- mostly in the Northeast and the West -- a fourth or less of residents attend weekly.”

Ten of the 12 states with the highest self-reported religious service attendance are in the South, along with Utah and Oklahoma, according to the Gallup survey. “The strong religious culture in the South reflects a variety of factors, including history, cultural norms and the fact that these states have high Protestant and black populations -- both of which are above average in their self-reported religious service attendance,” Gallup noted in an analysis of the data.zonvslpedusjhk_03s9f8g

Utah's No. 1 position on the list, Gallup indicated, “is a direct result of that state's 59% Mormon population, as Mormons have the highest religious service attendance of any major religious group in the U.S.”

In Vermont, 71 percent of respondents indicated they “seldom or never” go to religious services.  That percentage was 65 percent in Maine, 63 percent in New Hampshire, 59 percent in Massachusetts, 54 percent in Connecticut and 53 percent in Rhode Island.