Confidence in State Government Plummets in CT; Third Lowest in USA

In 2013, a majority of Connecticut residents expressed confidence in their state government.  Two years later, 6 in 10 residents, when asked if they had confidence in their state’s government, said no.no confidence In a survey of states nationwide, Illinois was at the bottom of the list, with only one in four Illinois residents indicating confidence in their state government, the lowest among the 50 states by a significant margin. Rhode Island (33%) and Connecticut (39%) join Illinois as states with less than 40 percent government confidence, according to data compiled by Gallup. North Dakota residents are the most trusting; 81 percent say they are confident in their state government.

Connecticut is joined among the states where residents expressed the least confidence in their government by New Jersey, Louisiana, Kansas, Pennsylvania, and New York.  Along with residents of North Dakota, people living in Wyoming, Nebraska, Montana, South Dakota, Utah and Minnesota expressed the most confidence in their state government.

In the Gallup survey in Connecticut, 39 percent of residents expressed confidence in state government, while 60 percent said they did not have confidence in state government.  The "no confidence" percentage has increased by 14 percentage points in two years.  The Gallup analysis noted that there is a strong relationship between residents' ratings of their state's economy and their confidence in state government. In addition to Illinois, Rhode Island, Connecticut, New Jersey and Kansas all rank among the states in which residents are the least positive about their state's economy.

The resul230px-Gallup_Corporate_logots are based on Gallup's 50-state poll, conducted March through December 2015. Gallup asked respondents whether they do or do not have confidence in their state's "government in general."

A similar poll by Gallup in 2013 brought very different results for Connecticut.  In that survey, a majority (52%) expressed a great deal or fair amount of confidence in state government.  That year, 46 percent expressed not very much confidence or none at all.

least confidence


Connecticut Among Five States with Highest Percentage of Foster Children in Group Homes, Report Says

The percentage of children in foster care in Connecticut who have not been placed with a foster family is among the highest in the nation, according to a report issued in 2015.  The report, from the Annie E. Casey Foundation, highlights the differing policies and practices among states, stressing that “kids should live with relatives or foster families when they have been removed from their own families, but one in seven nationally lies in a group placement.” In Connecticut there are 4,071 children in foster care, with 74 percent in family placement and 24 percent in non-family placement, exceeding the national average, according to the report.  That compares with 84 percent in family placement and 14 percent in non-family placement, nationally.  Only Colorado (35%), Rhode Island (28%) and West Virginia and Wyoming (27%), had a higher percentage of foster children than Connecticut in a non-family placement. states comparison

The state-by-state data from 2013, the most recent year available, shows use of group placements varies widely by state, ranging from 4 percent to 35 percent of children under the system’s care.  In Oregon, Kansas, Maine and Washington, only 4 to 5 percent of young people in out-of-home care are in group placements, the report points out.

The Foundation’s policy report, Every Kid Needs A Family, highlights “the urgent need to ensure, through sound policies and proven practices, that everything possible is being done to find loving, nurturing and supported families to children in foster care.” The report highlights the promising ways that state and local government leaders as well as policymakers, judges and private providers can work together as they strive to help these 57,000 children who are living in group placements – and overall, the more than 400,000 children in the care of child welfare systems.

The report goes on to recommend how communities can widen the array of services available to help parents and children under stress within their own homes, so that children have a better chance of reuniting with their birth families and retaining bonds important to their development. And it shows ways in which residential treatment — a vital option for the small percentage of young people who cannot safely live in any family during treatment — can help those young people return to families more quickly and prepare them to thrive there.7 to 10 times

“We have an obligation to help all of our kids succeed,” said Patrick McCarthy, president and CEO of the Casey Foundation. “If our children couldn’t live with us, we would want them to live with someone close to us - and if that couldn’t happen, with a caring foster family who could provide them with as normal a life as possible during a turbulent time. This report shows more kids can live safely in families and get the nurturing they need while under the care and protection of our child welfare systems.”

Among the report’s findings across the United States:

  • One in 7 children under the care of child welfare systems live in group placements, even though federal law requires that they live in families whenever possible.
  • Fortaecf-everykidneedsafamily-cover-2015
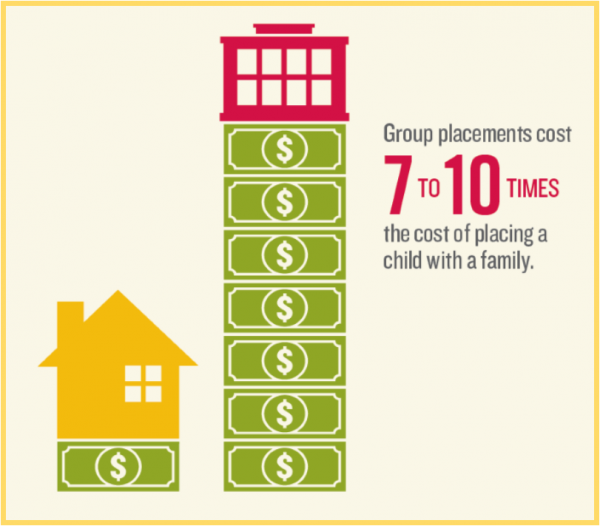
y percent of the children in group placements have no documented behavioral or medical need that would warrant placement in such a restrictive setting.
  • While research shows children who need residential treatment likely need to stay no longer than three to six months, young people are staying in group placements an average of eight months.
  • Group placements cost 7 to 10 times the cost of placing a child with a family.

The report also indicates that African American and Latino youth are more likely than white youth to be placed in group settings, and boys are more likely than girls to be in group placements.  Nationally, African American youth are 18 percent more likely than their white counterparts to be sent to group placements, and boys are 29 percent more likely than girls, according to data cited in the report.

4 in 10


Connecticut is Most Religious State in New England

Connecticut is the most religious state New England, ranked number 38 in the nation, according to a new Gallup poll.  The other New England states are all in the bottom ten, according to the survey, which covered the year 2015. New Hampshire is the least religious state in the nation, with 20 percent of residents considering themselves to be “very religious,” 24 percent “moderately religious” and 55 percent “non-religious.”  Just ahead of New Hampshire at the bottom of the list, are Vermont (22 percent very religious), Maine (26 percent very religious) and Massachusetts (27 percent very religious).  Rhode Island is ranked 43, with 32 percent of residents considering themselves to be very religious.CT religion

Connecticut, the only New England state ranked higher than the bottom ten, broke down this way:  33 percent very religious, 28 percent moderately religious, and 39 percent non-religious.

In the annual survey, Mississippi (63 percent) has extended its eight-year streak as the most religious state, followed closely by neighboring Alabama (57 percent), according to Gallup.  Rounding out the top ten “very religious” states were Utah, Louisiana, Tennessee, Arkansas, Georgia, South Carolina, North Carolina, Kentucky and Texas.

The state-by-state results are based on over 174,000 interviews conducted as part of Gallup Daily tracking in 2015, including more than 480 interviews in every state and more than 1,000 interviews in most states.  In Connecticut 1,919 interviews were conducted, according to Gallup.framed church Lee, MA

Gallup classifies Americans into three religious groups based on their responses to a question measuring religious service attendance and how important religion is in their daily life. Very religious Americans are those who say religion is important to them and who attend services every week or almost every week. Nonreligious Americans are those for whom religion is not important and who seldom or never attend religious services. Moderately religious Americans meet just one of the criteria, either saying religion is important or that they attend services almost every week or more.

Nationwide, the percentage classified as very religious on the basis of their attendance and view on the importance of religion has stayed remarkably stable since the survey began seven years ago. In 2008, 41% of Americans were very religious, 29% moderately religious and 30% nonreligious. In 2015, those same percentages are almost identical: 40%, 29% and 31%, respectively.

religion USA

Firsthand Accounts of Effects of Hunger in Connecticut On Display at State Capitol

Hunger in Connecticut is described as a pervasive problem: one in seven Connecticut residents struggle with hunger; 14.3 percent of Connecticut families do not have adequate resources to purchase enough food; 68 percent of Connecticut food pantry and soup kitchen clients at one point had to choose between food and medical care. Those stark statistics come alive through the firsthand accounts of individuals in Witnesses to Hunger CT, a photovoice exhibit showcasing firsthand accounts of hunger in Connecticut, which has opened in the lower level concourse of the Legislative Office Building in Hartford and will run through Thursday, February 11.stats

“Connecticut is one of the wealthiest states in the nation but there are many who struggle every day to put food on the table,” Lucy Nolan, Executive Director, End Hunger Connecticut!, said. “The Witnesses recruited to participate in this project have been faced with choices that are hard to fathom – whether to eat low cost foods that could be harmful to their medical conditions or not eat at all, whether to pay for prescriptions or put food on the table, and whether to feed themselves or give extra food to their children. We hope this exhibit can serve as a reminder that many among us, often hidden, need the state’s support.”

The 15 Witnesses to Hunger CT come from Connecticut’s cities, suburbs and rural communities. Kimberly’s picture told the story of her teenage son who while grateful to have something to eat wished there was meat on the plate. Randy from Westport had a good job until struck by cancer and now gets many meals from the soup kitchen and pantry. In his photo he holds a grocery bag in his hands and says while he is grateful for that safety net he wishes there were more fresh foods available. The photos tell a story of everyday choices that must be made to survive.

The project is a collaboration of Connecticut nonprofit organizations, anti-hunger and anti-poverty advocates, and state agencies inspired by Witnesses to Hunger, a project of the Center for Hunger Free Communities at the Drexel University Dornsife School of Public Health.  Advocates point out that limited access to food leads to poor health outcomes, including stress, obesity, and inability to succeed in work or school.hunger map

“There are four main themes that emerged from this project and tell me a compelling story,” said State Senator Marilyn Moore, Bridgeport. “The Witnesses to Hunger CT show everyday struggles with health and wellness, food and nutrition, transportation and adequate shelter. If we want people to succeed we need to make sure we support them. I appreciate their bravery in shining a light on these themes.”

Connecticut is the last in the nation for the number of schools with a school breakfast program, according to End Hunger Connecticut! officials. They point out that 64.6 percent of schools participate, and 45 percent students participate in free and reduced price breakfast for every 100 in lunch.  Connecticut would receive an additional $9.6 million federal dollars if the participation rate of school breakfast reached 70 percent.

Connecticut’s SNAP (formerly Food Stamps) participation rate is 72 percent and 53 percent of the eligible working poor participate in the SNAP program. Many go to food pantries instead for food, organization officials said. They indicated that for every $1 spent on WIC funding, Connecticut saves $1.77-$3.13 on future medical costs.

“The members of Witnesses to Hunger are the real experts on hunger and poverty,” said Dr. Mariana Chilton, an associate professor at Drexel University’s Dornsife School of Public Health and founder of Witnesses to Hunger. “Too many decisions today are made without consulting with the people that are affected most by policies made in Washington. We are thrilled to have families from Connecticut join in the national movement of families speaking from first hand experiences to inform policy makers and the public about the true realities of America’s struggles and how to solve them.”

They noted that 11.9 percent of Connecticut residents are food insecure and 4.7 percent are very food insecure — a slight increase from 2008.

“Data shows the food insecurity rate among those living with a severe mental illness is 475 percent higher than those who are not battling mental illness,” said Billy Bromhunger exhibitage, MSW, Director of Community Organizing, Yale Program for Recovery and Community Health. “We know that good nutrition plays a key role in mental health and that’s why the mental health community is here today to support the Witnesses.”

Witnesses to Hunger CT is the second exhibit of its kind in the state. The first took place in New Haven in 2014 and was championed by Congresswoman Rosa DeLauro.  Witnesses to Hunger CT is a collaboration of:  Advocacy Unlimited, Connecticut Association for Basic Human Needs (CABHN), Center for Hunger Free Communities at the Drexel University Dornsife School of Public Health, Connecticut State Department of Mental Health and Addiction Services (DMHAS), Connecticut Food Bank, End Hunger Connecticut!, Foodshare, Immanuel Congregational Church/UCC, Hispanic Health Council, New Haven Food Policy Council, and the Yale Program for Recovery and Community Health.

The exhibit will be in the lower concourse of the Legislative Office Building (LOB) through February 11th. A booklet prepared for the exhibit can be found at http://www.endhungerct.org. The LOB is located at 300 Capitol Avenue, Hartford and is open weekdays 8:00 am to 5:00 pm.  Free parking is available (first come first served) at the LOB Garage, which is located directly behind the LOB.

https://youtu.be/e-9M4byq90w


Safety Gap: Parents Impose Rules on Teen Drivers, Teens Don’t Think So

Teen drivers are at the highest risk for crashes and crash-related fatalities, and are particularly vulnerable to distractions while driving.  The results of a new nationwide survey of teens and their parents suggest a considerable disconnect between the limitations parents believe they are imposing on driving and the use of cell phones, and their teens’ view of limitations imposed by their parents. The gap in numerous instances is wide, and has raised concerns about the resulting risks to teen drivers.

In families where parents reported limitations on their teen drivers – such as restricting cell phone use, number of teen passengers and driving times and locations – teens themselves sometimes said they did not have those limitations, according to the C.S. Mott Children’s Hospital National Poll on Children’s Health, which indicated that parents play a key role in promoting the safety of their teens by setting expectations for driving.teen drive limits

“We found that the great majority of parents do have rules for their teen drivers; however, teens consistently perceive fewer limits on their driving than what their parents report. This signals an opportunity for parents and teens to have more conversations about safe driving habits,” says lead author Michelle L. Macy, M.D., M.S., an emergency medicine physician at the University of Michigan’s C.S. Mott Children’s Hospital.

Parents of teens 13-18 years old and teens themselves were asked about limits placed on driving circumstances that can increase a teen driver’s risk of a crash. About nine in 10 parents report they place at least one limit on their teen drivers while eight out of 10 teens report having at least one driving limit placed on them by their parents.

Among parents and teens who both responded, teens consistently say they have fewer limits on their driving than were reported by their parents.  Overall, 81 percent of teens report having at least one driving limit placed on them by their parents. In families where parents report limits on cell phone use, 13 percent of teens say they have no limits. In families where parents report limits on passengers or driving times/locations, 20 percent of teens say they have no such limits.logo

Limits on cell phone use and texting while driving are most commonly reported by parents and their teens. Fewer limits are set on passengers and driving times/locations. As many as one-quarter of parents report placing no limits on teen passengers or nighttime or highway driving, suggesting opportunities to increase teen driver safety by encouraging parents to place limits on these high-risk driving conditions, officials indicated.  Among the key limitations parents impose, according to the survey:

Limits on cell phone use include:quote

  • requiring teens to park to use their cell phones (86%)
  • forbidding texting while driving (73%)
  • having cell phone turned off or put away (62%)

Limits on passengers include:

  • allowing only 1-2 friends in the car (59%)
  • allowing only certain friends (54%)
  • no teen passengers allowed (40%)

Limits on driving times/locations include:

  • no driving after 10 p.m. (61%)
  • driving only to/from school, work, or activities (57%)
  • no highway driving (36%)

Parents who judge their teens’ driving ability as “above average” (32% of all parents) are less likely to place limits on passengers and driving times/locations. Sixty-seven percent of parents set limits on passengers for their “above-average” teen drivers, compared with 81percent of parents who perceive their teen drivers as “below average.” Similarly, 69 percent of parents set limits on driving times/locations for their above-average teen drivers, compared with 85 parents of parents who perceive their teen as below average. In contrast, parents do not adjust their restrictions on cell phone use in relation to their teens’ driving ability.

There was greater agreement between parents and teens on limits placed on cell phones than on passengers or driving times/locations, according to the national survey, conducted in September 2015 and released earlier this year.

“This may indicate that parents communicate to their teens more clearly their expectations around cell phone use while driving than for other driving situations. It is also possible that parents and teens have greater awareness of the risks of using cell phones while driving, due to media attention on cell phone distractions as a common cause of crashes,” the survey analysis points out.

The analysis also indicated that the higher degree of disagreement between teens and parents in relation to the limits set for passengers and driving times/locations suggests the need for more dialogue in families to ensure rules and expectations around driving are understood. Written parent-teen driving agreements are one way for parents to clearly communicate rules and expectations, officials indicated.

Connecticut’s Tim Hollister, author of two books about parenting and safe teen driving and the website From Reid’s Dad, recently developed a video for parents, with financial support from the Travelers, which underscores the influence of parents in teen driving.  Hollister will be speaking on the subject at the Easton Public Library on February 10 and the Newington Public Library on February 24.  Hollister, whose son Reid died as a result of a car accident at age 17, will share information parents should know regarding teen driving and discuss his most recent book, His Father Still.

https://youtu.be/QmCJKvyXhEQ

https://youtu.be/wccN8aqOWA4


Connecticut Leads the Nation in Preventative Health Care

Among the nation’s 34 most populous states, the rate of preventive health care visits was higher in Connecticut than any state in the nation.  Data released this month from the Centers for Disease Control and Prevention National Center for Health Statistics also found that the rate of preventive care visits to primary care physicians, among the 34 most populous states, exceeded the national rate in Connecticut more than elsewhere. Preventive care visits such as general medical examinations, prenatal visits, and well-baby visits give physicians and other health professionals the opportunity to screen for diseases or conditions, as well as to promote healthy behaviors that may delay or prevent these conditions and reduce subsequent use of emergency or inpatient care.nchs_fb_identifier

In this report, the rate of preventive care visits to office-based physicians is examined by state, patient demographics, and physician specialty. Estimates are based on data from the National Ambulatory Medical Care Survey (NAMCS), a nationally representative survey of visits to office-based physicians.

Overall, preventive care visit rates were higher for children under age 18 years (73.2 per 100 persons) and for those aged 65 and over (81.1 per 100 persons) than for adults aged 18–44 (53.2 per 100 persons) and 45–64 (51.8 per 100 persons).  The preventive care visit rates for women aged 18–44 (87.1 per 100 women) and 45–64 (60.5 per 100 women) exceeded the rates for men in those age groups (18.5 and 42.5 per 100 men, respectively).

doctor
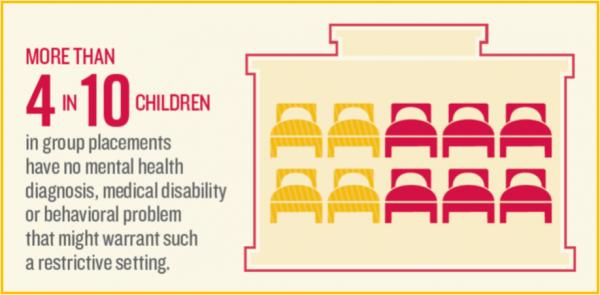
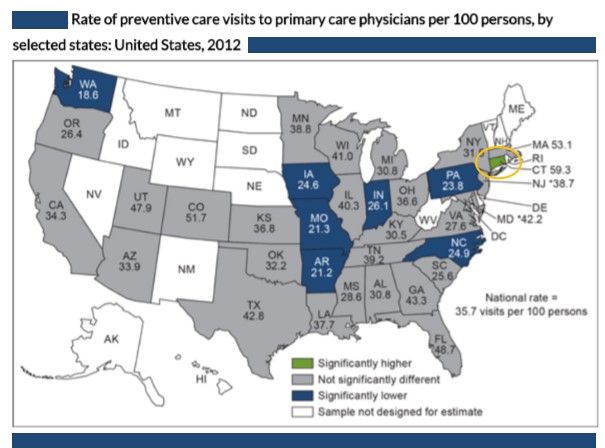
The rate of preventive care visits in the 34 most populous states ranged from 33.1 visits per 100 persons in Arkansas to 120 visits per 100 persons in Connecticut.  Among those 34 states, the rate of preventive care visits was lower than the national rate in 11 states (Arkansas, Indiana, Iowa, Michigan, Missouri, North Carolina, Oklahoma, Oregon, Pennsylvania, South Carolina, and Washington).  The national average was 61.4 visits per 100 persons.  The data is from 2012, the most recent year available from the National Ambulatory Medical Care Survey.

In 2012, 35.7 preventive care visits were made to primary care physicians for every 100 persons across the United States.  In Connecticut, primary care physician preventative care visits were made 59.3 times per 100 people, the highest percentage in the nation.  In Massachusetts, the rate was 53.1, in Colorado 51.7, in Florida 48.7 in Georgia 43.3, in Texas 42.8 and in Maryland 42.2.  Overall, 58.2 percent of preventive care visits were made to primary care physicians, according to the CDC data.  Primary care physicians include office-based physicians in the specialties of family or general medicine, internal medicine, and pediatrics.1u1-c15ecce858

The female rate (76.6 visits per 100 females) of preventative care visits exceeded the male rate (45.4 visits per 100 males) by 69 percent. The percentage of preventive care visits to primary care physicians, however, made by males (76.3%) exceeded those made by females (48.0%). The data suggests that women tend to make their preventative care visits to physicians other than their primary care physician, with the report’s summary suggestion. this “may be related to gynecological or obstetric care for women.”

In 2012, the NAMCS survey sample size was increased fivefold to allow for state-level estimates in the 34 most populous states for the first time.

preventative health map

New Casey Foundation Initiative Aims to Improve Job Prospects for Young Adults in Hartford

A total of up to $900,000 will be awarded over the next four years to a Hartford collaborative initiative to strengthen the next generation of workers and meet employer demand.  The Annie E. Casey Foundation has announced plans to award $6 million in grants to increase job opportunities for young adults from low income families in Hartford and four other communities - Cleveland, Indianapolis, Philadelphia, and Seattle. Hartford expects to receive up to $900,000 over the grant period for planning and implementation.cities

Through Generation Work, the Foundation aims to combine building relationships with businesses, factoring in their needs in the local economy, with youth development strategies to prepare young people for work, such as mentoring and on-the-job learning opportunities. Ultimately, the Casey Foundation hopes to help establish local networks of workforce development organizations that serve young job seekers and have strong connections with businesses.

The Hartford Generation Work initiative is led by United Way of Central and Northeastern Connecticut, working with five other community partners:

Hartford’s initiative will connect young adults, including those out-of-school or work or underemployed, with education, training and employment for careers in manufacturing and healthcare, officials said. The initiative also intends to improve coordination and collaboration among partners and youth initiatives.work

“The strength of our future workforce is one of our nation’s greatest assets and is critical to our ability to compete globally,” said Allison Gerber, a senior associate who oversees the Casey Foundation’s investments in improving job opportunities for low-income individuals and families. “The next generation is eager to work, but we must create more avenues for young adults to develop the knowledge and experience they need to succeed in the job market.”

While the Great Recession hit many hard, teens and young adults have experienced the most drastic drop in employment, data show. Millions of young people — particularly young people of color, justice-system involved, or aging out of foster care and from low-income families — face obstacles to employment or education, and the percentage of young people ages 18 to 29 in the job market nationwide has steadily declined in recent years. At the same time, employers often struggle to find workers with the right set of skills for available positions, Foundation officials point out.

Elder Abuse Prevention Recommendations Sent to State Legislature

Though precise definitions of elder abuse vary widely across jurisdictions, conceptually, elder abuse is any form of mistreatment that results in harm or loss to an older person. That, according to a report issued by Connecticut’s Legislative Commission on Aging, is at the core of a series of 15 recommendations being made to the state legislature and executive branch to respond to increasing concerns about the growing prevalence of elder abuse. The report explains that “it can be physical, financial, psychological, or include neglect or abandonment and it may take place in a home or institutional setting. Though often a hidden phenomenon, elder abuse is a significant human rights, public health and social justice issue that transcends race, ethnicity, religious affiliation, income and education levels.”report

Earlier this year, the legislature directed the Commission to conduct a study” concerning best practices for reporting and identification of the abuse, neglect, exploitation and abandonment of older adults.”  The report was submitted to the legislature, which convenes this week.

The Commission has also launched a new website focused on Financial Abuse & Exploitation, which includes a series video training videos and a range of resources.

Organized around the three areas of inquiry framed in Public Act 15-236, the report recommendations are:

To emulate national models for reporting abuse, neglect, exploitation or abandonment:

  1. Establish parameters for reasonable caseload standards for the Connecticut Department of Social Services Protective Services for the Elderly program (PSE);
  2. Establish an elder abuse resource prosecutor in the Office of the Chief State’s Attorney;
  3. Conduct a Connecticut-specific cost assessment to better understand the personal and state costs of financial exploitation; and
  4. Evaluate moving to an adult protective services model, for adults ages 18 and older, rather than a model only for adults ages 60 and older, balancing the import of retaining choice and control with ensuring that access to protective services is not restricted by age.

To advance standardization and uniformity in definitions, measurements and reporting mechanisms:

  1. Conduct a definitional crosswalk among and between state agencies and national guidelines and assess where legal, policy and practice changes can enhance alignment;
  2. Have Connecticut PSE develop a strategic plan to develop national voluntary consensus guidelines that have been developed nationally;
  3. Have Connecticut PSE modify its data collection process and explore predictive analytics modeling to improve outcomes and quality, to align with the dataset to be collected nationally, and to develop more targeted interventions; and in the interim, have PSE submit a more detailed report to the Connecticut General Assembly;
  4. Require Connecticut PSE to develop an online training module for mandated reports on the role of PSE, elder abuse red flags and reporting procedures to PSE; and
  5. Develop training and resources for law enforcement.

To promote and coordinate reporting communication among local and state government entities:

  1. Have Connecticut PSE formalize a system for consistent and uniform follow-up with all reporters of elder abuse;
  2. Enhance training for Connecticut PSE social workers and utilize consultants with specific subject matter expertise to provide guidance on investigation in certain highly specialized areas;
  3. Explore promising evidenced-based assessment tools and service models to make informed policy and practice decisions about how to direct and utilize limited resources on behalf of adults who need them most;
  4. Pursue federal funding for enhanced training and services to end abuse later in life program.
  5. Empower and support multidisciplinary teams (groups of regularly-meeting professionals to handle complex cases of elder abuse), as well as specialized teams such as financial abuse specialist teams, elder fatality review teams, and an elder abuse forensic center; and
  6. Support continued development of Connecticut’s criminal justice information system.

Connecticut’s Legislative Commission on Aging is a nonpartisan public policy and research office of the Connecticut General Assembly.  The report indicated that according to a study sponsored by the U.S. Department of Justice, 12.4 percent of adults age 60 and older reported at least one form of emotional, physical or sexual abuse or potential neglect and 11.7 percent reported financial exploitation by a family member or stranger.

Connecticut is the 7th oldest state in the nation, based on median age. It also has the third longest-lived constituency, with an average life expectancy of 80.8 years for residents born in Connecticut today. The report indicated that the “vast scope of elder abuse is especially concerning in light of the significant adverse health consequences for victims.”

More than one-third of Connecticut’s population is over the age of 50, and that proportion continues to rise. Between 2010 and 2040, Connecticut’s population of people age 65 and older is projected to grow by 57%, with less than 2% growth for people age 20 to 64 during the same period, according to the report.

https://youtu.be/b3Dr_sqJOYE

CT Ranks 20th in Dependence on Gun Industry, But 3rd in Firearms Output, 2nd in Industry Wages

Connecticut’s place in the ongoing national debate about guns is reflected in a new analysis which ranks the state 20th in the nation in overall dependence on the gun industry, but also ranks the state 3rd in total firearms industry output per capita and 2nd in highest average wages & benefits in the firearms industry. Picture8
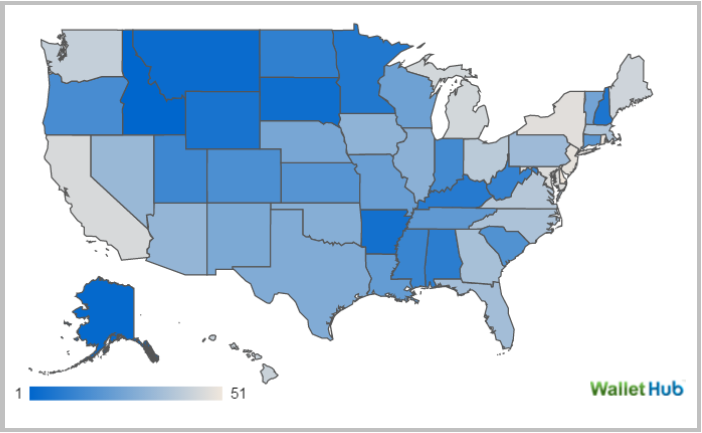
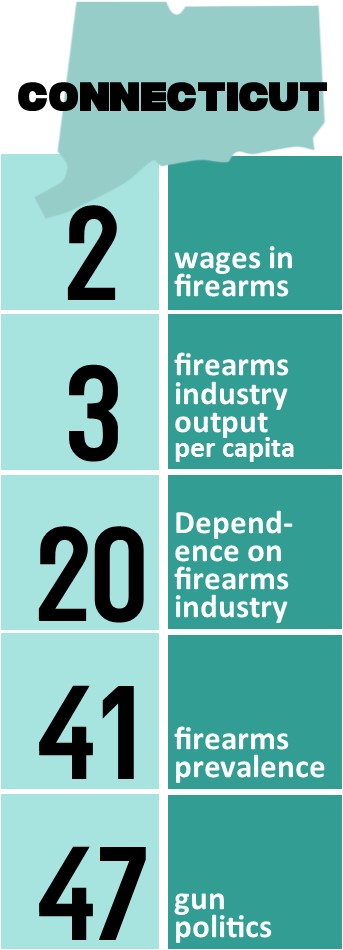
With the gun debate center-stage in the presidential primaries and in Washington, D.C., the website WalletHub analyzed which states depend most on the arms and ammunitions industry both directly for jobs and political contributions and indirectly through firearm ownership. WalletHub’s analysts compared the 50 states and the District of Columbia across three key dimensions: 1) Firearms Industry, 2) Gun Prevalence and 3) Gun Politics and eight metrics.

Connecticut also came in 41st in its "firearms prevalence rank" and 47th in "gun politics rank."

The states Most Dependent on the Gun Industry were Idaho, Alaska, Montana, South Dakota, Arkansas, Wyoming, New Hampshire, Minnesota, Kentucky and Alabama.gun stat chart

Officials point out that the gun industry plays an important role in the U.S. economy, and Connecticut is no exception. By one estimate, firearms and ammunitions contributed a total of nearly $43 billion to the national economy in 2014. That figure accounts for more than 263,000 jobs that paid $13.7 billion in total wages, according to the report from the Connecticut-based National Shooting Sports Foundation. In the same year, federal and state governments collected from the industry more than $5.79 billion in business taxes, plus an additional $863.7 million in federal excise duties, the WalletHub report indicated.

In the overall rankings, the states determined to be least dependent on the gun industry are Maryland, New York, New Jersey, Rhode Island and Delaware.

The analysis also found:

  • The number of firearms-industry jobs per capita is highest in New Hampshire, which is seven times greater than in the District of Columbia, where it is lowest.
  • The average wages & benefits in the firearms industry is highest in the District of Columbia, which is three times greater than in New Mexico, where it is lowest.
  • The total firearms industry output per capita is highest in New Hampshire, which is 18 times greater than in Hawaii, where it is lowest.
  • The total taxes paid by the firearms industry per capita is highest in Montana, which is six times greater than in Delaware, where it is lowest.
  • Gun ownership is highest in Alaska, which is 12 times greater than in Delaware, where it is lowest.

The eight relevant metrics utilized in the analysis and their corresponding weights were as follows:map

Firearms Industry – Total Points: 35

  • Number of Firearms-Industry Jobs per 10,000 Residents: (~14 Points)
  • Average Wages & Benefits in the Firearms Industry: (~7 Points)
  • Total Firearms Industry Output per Capita: (~7 Points)
  • Total Taxes Paid by the Firearms Industry per Capita: (~7 Points)

Gun Prevalence – Total Points: 35

  • Gun Ownership: (~17.5 Points)
  • Gun Sales per 1,000 Residents (approximated by using National Instant Criminal Background Check System data): (~17.5 Points)

Gun Politics – Total Points: 30

  • Gun-Control Contributions to Congressional Members per 100,000 Residents: (~15 Points)
  • Gun-Rights Contributions to Congressional Members per 100,000 Residents: (~15 Points)

Data used to create these rankings were collected from the U.S. Census Bureau, the National Shooting Sports Foundation, the Federal Bureau of Investigation, the BMJ Publishing Group and the Center for Responsive Politics, according to WalletHub.

Bullying Is Parents Top Concern, Depression Next

Across the country, parents with children under age 18 are most concerned about their child being bullied, with 6 in 10 expressing that concern.  The next most prevalent concern – expressed by a majority of those surveyed by the Pew Research Center – is that their child will struggle with anxiety or depression.  Fifty-four percent have that concern. Noting that comprehensive statistics on bullying are difficult to obtain, Pew referenced the 2013 Youth Risk Behavior Study (which covered only high-school students) finding that 19.6 percent had been bullied on school property in the previous 12 months, and 14.8 percent had been electronically bullied. In both cases, white teens and female teens were more likely to say they’d been bullied.FT_16.01.05_parentalConcerns

Connecticut’s statistics were higher than the national average in both categories.

In the 2012-13 school year, there were more than 1,400 incidents which an investigation was conducted and active bullying was concluded to have occurred, according to the state Department of Education.  The most recent data posted on the department’s website indicates that “21.9% of Connecticut students had been bullied on school property. Nationwide, the rate is 19.6%. In Connecticut, the prevalence of having been bullied on school property is significantly higher among females (26.1%) than among males (17.9%). The prevalence of having been bullied on school property is significantly higher in grade 11 among students in CT (22.8%) than in the US (16.8%).”

The Youth Risk Behavior Study also indicated that 17.5% of Connecticut students had been electronically bullied. Nationwide, the rate is 14.8%, according to the study report.youth risk report CT

Earlier this month, the parents of a high school freshman in Westport who died last month asked the local Superintendent of Schools to investigate reports that their son may have been the target of bullying and the nature of widespread social-media comments about his death among students.

In a letter to school officials, the parents wrote: “several current Staples High School students have reported observing bullying, humiliating or inappropriate behavior by one or more peer or peers toward others, and these students report that they do not know how to respond or intervene. They feel guilty and ashamed of their inaction and passive consent to the blatant behaviors. This is a critical area needed to stop these types of malevolent behaviors.”

Published reports indicate that police have found no evidence of bullying in the student's death.

The likelihood of their child facing anxiety and depression is also of great concern to parents, ranked second-highest in the survey.  About one-in-ten adolescents, or around 2.6 million, have experienced major depression in the past year, according to 2013 data reported by National Institute of Mental Health, the Pew report indicated; for 7.7 percent, their depression caused severe impairment.

Depression was three times as common among teen girls as teen boys (16.2% versus 5.3%). Available data suggest that a quarter of teens have experienced some sort of anxiety disorder (such as phobias, panic disorder or post-traumatic stress disorder) at some point in their lives, according to the National Institute of Mental Health.

The nationwide survey by the Pew Research Center survey also found that the nature of parental concerns varies considerably across demographic groups.  The research found, for example that:

  • low-income parents are more concerned about teen pregnancy and their kids getting in trouble with the law than are higher-income parents.
  • Black parents are more likely than white parents to worry about their children being shot, while white parents are more likely than black parents to worry tFT_15.12.21_parentalConcerns_shoot
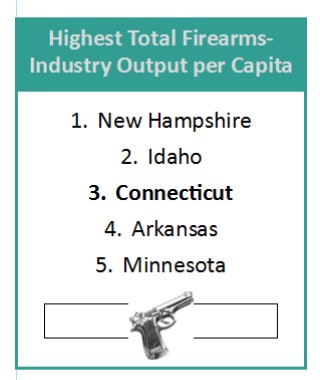
hat their children will struggle with anxiety or depression.
  • Hispanic parents worry more than black or white parents in all eight areas of concern, from being bullied to having problems with drugs or alcohol

Pew Research Center points out that in 2014, the rate of firearm deaths for black youths was 4.26 per 100,000, almost three times the rate for white youths and nearly four times the rate for Hispanic youths. Hospital emergency departments, from which the Centers for Disease Control and Prevention gathers its injury data, don’t always obtain information on race and ethnicity for their patients, the report noted. But based on the 80 percent or so of nonfatal firearm injury cases involving juveniles in 2013 for which race and ethnicity data are available, the disparity among different subpopulations was stark: 1.68 per 100,000 for white youths, 5.3 per 100,000 for Hispanic youths and 24.67 per 100,000 for black youths, the Pew report indicated.

The report also indicated that every state in the nation, as well as the District of Columbia, has a lower teen birthrate than it did in the early 1990s. The birthrate for 15- to 19-year-olds (the metric tracked by federal researchers) has been dropping for decades, Pew pointed out, and hit a record low in 2014. There were just 24.2 births per 1,000 teen females that year, compared with 61.8 per 1,000 in 1991 and 41.5 as recently as 2007.