Hartford Ranked #35, New Haven #39 in Income Inequality Among US Cities; Bridgeport-Stamford-Norwalk Is Nation's Most Disparate Region

A new analysis ranking the cities with the greatest income inequality includes Hartford and New Haven in the top 50.– and the Bridgeport-Stamford-Norwalk metropolitan area is the metro region with the largest income disparity in the nation.

The major cities with the most dramatic income inequality in their population are, ranked in order:  Atlanta, New Orleans, Miami, Jackson (Mississippi), Gainesville (Florida), Tampa, Cincinnati, Athens (Georgia), Providence, Berkeley and Boston.  Seven of the top 11 are cities in the Southern U.S.

Among New England cities, Providence ranked #9, Boston at #11, Cambridge at #12, Hartford at #35, and New Haven at #39.  Among other major cities, New York ranked #13 and Washington, D.C. ranked #15.

Bloomberg ranked 300 U.S. cities with populations of at least 100,000income-inequality-shutterstock_146836310 based on their level of income inequality and identified the 50 with the greatest inequality. The media outlet also ranked the top 20 metropolitan areas with the greatest income disparity.

On that list, Bridgeport-Stamford-Norwalk ranked as the metro area with the most income inequality in the nation.  Among the 20 regions with the greatest disparity, one-quarter are in Florida – including Naples-Marco Island at #2 and Gainesville at #3.  College-Station-Bryan (Texas) was #5 and New York-Northern New Jersey was #5 on the list of metro areas. 

They methodology for the analysis was use of the “Gini coefficient,” which is calculated by the U.S. Census from household income share by quintiles, used to measure distribution of wealth. It ranges from zero, which reflects absolute equality, to one, complete inequality.

Hartford’s Gini coefficient was 0.5176, New Haven’s was 0.5144.  By comparison, Atlanta’s was 0.5882, and Providence 0.5445.  New Haven’s income inequality improved slightly, by 5.4 percent, since 2008, while Hartford’s disparity grew slightly, by just over 1 percent, according to the data.

The Bridgeport-Stamford-Norwalk region had a Gini coefficient of 0.5459.

It was reported that in New Haven, 26.1 percent of the population was living in poverty; in Hartford the figure was 38 percent.  In Hartford, 54 percent of household income was in the highest quintile, while 2 percent was in the lowest quintile.  In New Haven, 38 percent was in the highest quintile while 2.5 percent placed in the lowest.

In the ranking of the 50 cities with the most income inequality, Hartford was between Lafayette, Louisiana and Cleveland, OH.  New Haven ranked between Charleston, S.C. and Tulsa, OK on the list.

The average score for the United States was 0.4757. In 2013, a person living alone making less than $11,490 was classified as in poverty. The threshold increased by $4,020 for each additional household member, Bloomberg reported.

Soda Tax Won't Hurt Job Prospects, Study Finds

As the Connecticut legislature considers a proposal to implement a 2 percent tax on sodas, proposed by Senate Majority Leader Martin Looney at the suggestion of New Haven Mayor and former state senator Toni Harp, two new academic studies challenge the beverage industry’s view that state and local taxes on sugary drinks will hurt employment, and offer suggestions to policy makers based on the tobacco tax experience. Harp has said the soda tax would discourage consumption of the sugary beverages – part of her campaign to combat obesity – and bring in public health logoan estimated $144 million in revenue for the state each year. It would tax all beverages “high in calories or sugar” by two percent, but does not specify how many calories or grams of sugar would trigger the tax.

The studies, appearing in the February and March issues of the American Journal of Public Health, argue, in one case, that claims of employment losses are off base because they focus only on the effects within the industry, ignoring the economic activity that comes with people substituting lower-priced goods for more expensive products as wellsoda as new spending from tax revenues.  The other study says that tobacco taxes offer a how-to road map for policy makers.

The study to be published in March, led by Jennifer L. Pomeranz, JD, MPH, while at the Yale Rudd Center for Food Policy and Obesity at Yale University, uses as its premise that “excise taxes on sugary beverages have been proposed as a method to replicate the public health success of tobacco control and to generate revenue.”

Sugary Beverage Tax Policy: Lessons Learned from Tobacco indicates that “as policymakers increase efforts to pass sugary beverage taxes, they can anticipate that manufacturers will emulate the strategies employed by tobacco companies in their attempts to counteract the impact of such taxes.”  Pomeranz suggests that “policymakers should therefore consider two complementary laws—minimum price laws and prohibitions on coupons and discounting—to accomplish the intended price increase.”

Researchers at the University of Illinois, in a just-published study in the February issue of American Journal of Public Health, found that a 20 percent increase on the price of sugar-sweetened beverages would have an overall positive impact on the labor market.

The American Beverage Association has traditionally argued that manufacturers, distributors and small business owners, particularly grocers and convenience store proprietors, would suffer were soda taxes to be imposed, but the study says that’s not likely.

In recent years, proposals to tax those beverages fell short in California, Vermont, Hawaii, Massachusetts, Mississippi, New York and Rhode Island, Governing magazine reported.  In Maine voters passed a soda tax of 42 cents per gallon in 2008 but repealed it two years later amid a major lobbying effort from the American Beverage Association. Voters in Washington state similarly reversed their legislature in 2010.  As of the end of state legislative sessions in 2011, Governing reported, only four states had taxes specifically targeting sugary beverages, including Arkansas, Tennessee, Virginia, and West Virginia, according to the Tax Foundation.

In the study publstrawished this month, researchers ran a simulation of the impact of 20-percent soda tax in Illinois and California—selected for regional differences—and found slight employment increases would occur, but the net effect would be close to nothing. They found that people choose to spend their money on other things, not to forego spending entirely, and that employment gains in other sectors of the economy far outweigh the job losses for soda makers, National Journal reported.

“We find there are losses in the beverage industry, but when you’re talking about the whole economy suffering job losses, you can’t just talk about your own industry,” Lisa Powell, health policy professor at the University of Illinois at Chicago and the study’s lead author, told National Journal. “Using job loss as a scare tactic for the economy overall is misleading.”

Public health advocates have warned of a link between added sugar and illnesses ranging  from Type 2 diabetes and obesity to heart disease and osteoporosis. The caloric intake of sugary beverages increased dramatically from 1988 to the mid 2000s, though consumption has dropped across all age groups in recent years, Governing reported, with some citing the increased public attraction to teas and other beverages.  Like Harp and Looney in Connecticut, some elected officials around the country have proposed raising taxes on sugary drinks in order to reduce consumption.  The New Haven Register reported that Harp has pointed out that revenue from the cigarette tax has decreased, showing that the effectiveness of a tax in reducing consumption.Jennifer-Pomeranz

Pomeranz is a public health law and policy researcher focusing on marketing, labeling and youth access issues related to food and beverages, over-the-counter diet drugs, and dietary supplements, publishing on topics including discrimination, the First Amendment, public health preemption, and innovative regulatory strategies to address public health problems such as obesity. She is Assistant Professor at the Center for Obesity Research and Education in the Department of Public Health and at the College of Health Professionals and Social Work at Temple University, having served previously as Director of Legal Initiatives at the Yale Rudd Center for Food Policy & Obesity.  She is currently the Policy Chair of the Health Law Section of the American Public Health Association and the official liaison between the American Academy of Pediatrics and the American Public Health Association.lisa powell 2

Lisa Powell is a Senior Research Scientist in the Institute for Health Research and Policy and Research Professor in the Department of Economics at the University of Illinois at Chicago. She has extensive experience as an applied micro-economist in the empirical analysis of the effects of public policy on a series of behavioral outcomes.

A 2011 study by the Yale Rudd Center for Food Policy & Obesity found that young people are being exposed to a massive amount of marketing for sugary drinks, such as full-calorie soda, sports drinks, energy drinks, and fruit drinks.  The study, described as the most comprehensive and science-based assessment of sugary drink nutrition and marketing ever conducted, found that companies were marketing sugary drinks targeting young people, especially black and Hispanic youth.

This story was reported by CT by the Numbers on February 16, 2014

Connecticut Ranks #48 in Federal Income Tax Refunds

Connecticut ranks #48 in the nation in income tax refunds its residents receive from the federal government.  Just over 11 percent of the taxes paid by state residents to the federal government are refunded to them, a percentage that is better than only the states of Delaware and Minnesota, and the District of Columbia.

By comparison, Mississippi residents receive more than three tbiggest tax refundsimes that percentage.  One third of the taxes paid by Mississippi residents – 34.84 percent – come back in refunds.  West Virginia residents receive 30 percent of the taxes they paid, South Carolina 26.27 percent and Alabama 26 percent.  Bloomberg.com reviewed Internal Revenue Service (IRS) data and ranked the 50 states and the District of Columbia based on the percentage of gross individual income taxes withheld or paid that were returned as refunds the following year.

Figures are for a five-year period: fiscal years 2007 through 2011 for tax collections and fiscal years 2008 through 2012 for refunds. For both collections and refunds, data include individual income tax withheld, individual income tax payments, FICA taxes, SECA taxes, unemployment insurance taxes, railroad retirement taxes and estate and trust income taxes. Refunds include interest.Tax-Refund

Connecticut’s gross total individual federal income tax collected between 2007 to 2011 was $206.31 million.  Total individual income tax refunded from the federal government between 2008 to 2012 was $23.56 million.  Joining Connecticut among the states with the lowest percentage refunded, in addition to Minnesota and Delaware, are Massachusetts, New Jersey, Ohio, New York and Nebraska. 


Investor Opportunities in Mobile Technology, Consumer Products Focus of Back-to-Back Conferences

It is described as “the Biggest and Most Disruptive Platform in Human History,” by William Davidson, Senior Vice President of Qualcomm.  Davidson will be the keynote speaker Wednesday in New Haven at “Connecticut Mobile Summit – Exploring Mobile Venture Opportunities and Challenges.”  Connecticut’s top mobile industry executives will be meeting to discuss how to accelerate mobile adoption, engagement and monetization, according to conference organizers.

Conference officials note that “penetration of smart phones into the workplace has been persistent since the iPhone launch in June of 2007. More recently, tablets have supplanted PCs as productivity boosters.”  The Connecticut Mobile Summit is designed to help educate Connecticut’s investment and technology communities in mobile venture opportunities and challenges.

mobile summittIn addition to Davidson, expert panelists participating include Carissa Ganelli, Founder & CEO, LightningBuy; Drue Hontz, Founder & President, KAZARK, Inc.; John Nobile, Founder & President, Tangen Biosciences; and Nadav Ullman, Founder & CEO, Dashride.

“In three to five years any enterprise that has not implemented mobility solutions for its customers, employees, and suppliers will be leapfrogged, disintermediated, or go bankrupt. Connecticut cannot afford to be behind this curve,” observed event moderator, Brenda Lewis, Principal of Transactions Marketing, Inc.

Davidson is senior vice presidemobile-technologynt of strategy and operations for Global Market Development in Qualcomm Technologies, Inc. In this role, he handles reporting and operations as well as executing on strategic global business initiatives. In addition, Davidson is senior vice president of investor relations where he serves as the primary liaison with the investment community and Qualcomm shareholders. Davidson has more than 25 years of experience in technical sales, marketing and general management roles in the telecommunications industry.
The half-day conference is being presented by the Connecticut Technology Council, Crossroads Venture Group and AT&T. The event is supported by Mea Mobile.

Opening remarks will come from Bruce Carlson, Acting CEO & President of the Connecticut Technology Council, Liddy Karter, Executive Director of Crossroads Venture Group, and Claire Leonardi, CEO of the recently re-branded Connecticut Innovations.  The event is $40 for members of the Connecticut Technology Council and Crossroads Venture Group, $50 for non-members.

The following day, the Northeast Consumer Product Conference will be held in Stamford, with the Connecticut Technology Council and Crossroads Venture Group joined by the Connecticut chapter of the Association for Corporate Growth (ACG) as sponsors.  The conference is described as the Northeast’s largest ‘mergers and acquisitions’ conference focused on early state and middle market consumer-facing companies.  It brings together operators, buyers, investors, and transaction professionals to discuss the challenges and opportunities within consumer industries.

The Stamford conference will include expert-led panels reviewing the state of the capital markets and share strategies for consumer marketing in a digital world, for both early and late stage firms.

Keynote presentation will be from Mike McMahon, President, Spire, a Datalogix company.  Panelists for a session on “Raising Capital in Today's Environment,”  to be moderated by Ramsey Goodrich, Managing Director, Carter Morse & Mathias, include Richard Baum, Managing Partner, Consumer Growth, Partners; Christopher Bradley, Principal, Mistral Equity Partners; and Tom Hayes, MaACGnaging Partner & Principal, New England Consulting Group.

ACG CT President Karin (McKittrick) Kovacic said, “This conference brings together owners and managers with investors and transaction professionals to discuss the challenges and opportunities within the consumer products sectors.”

The Connecticut Chapter of ACG is one of the fastest growing ACG chapters in the country, with close to 300 local professionals focused on middle-market corporate growth (i.e.: mergers and acquisitions, financing opportunities, business development, joint ventures, licensing arrangements, etc.), including a diverse group of private equity funds, intermediaries, lenders, and service providers.

The Connecticut Technology Council (CTC) is a statewide association of technology oriented companies and institutions, providing leadership in areas of policy advocacy, community building and assistance for growing companies.  With over 2,000 member companies that employ some 200,000 residents, the CTC works to position Connecticut as a leader in idea creation, workforce preparation, entrepreneurial aptitude, early stage risk capital availability and providing on-going support and mentoring to high potential firms.

Survey Says: Increase Consumer Protections, Limit Marketing of Alternative Electric Companies

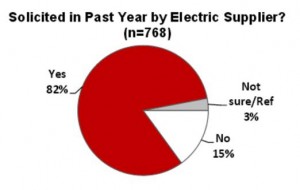
Too much.  That’s the opinion of Connecticut residents age 50 plus when it comes to the steady barrage of marketing by alternative electricity companies, according to a new survey by AARP Connecticut.  The survey found that 82 percent of electricity customers age 50 and older had been solicited in the past 12 months by an electric supplier – and that a significant 25 percent of the customers had changed electric suppliers during the year.

There was also a clear mandate to reign in the marketing.   Nearly three out of fourpower lines people would prefer that companies be limited to marketing to consumers only once a year.
A robust 88 percent expressed concern about the increasing costs of electricity.  However, most cite loyalty with their current supplier (35%), or not finding alternative suppliers with more competitive rates (21%) as reasons they chose not to switch carriers.  Sixteen percent cited negative perceptions or concerns about alternative suppliers, such as bad reputations (6%), being untrustworthy (4%), having variable rates (4%) or being bound by contracts (2%).

The marketing takes many forms.  The majority of customers said they have received offers from alternative suppliers through the mail (74%) and by phone (58%).  Additionally, a considerable number (13%) say representatives have knocked on their door at home.  The marketing tactics have generated strong support among those over 50 for limits:

  • 84 percent support requiring sales staff to wear badges to identify themselves and their company
  • 65 percent support requiring sales staff to tell consumers they have seven days in which they can terminate their contract
  • 64 percent support requiring sales staff to provide written terms of sales agreements while on-site.solicited by company

AARP Connecticut pointed out that a study by Connecticut’s Office of Consumer Counsel found that nine out of ten customers who switched to a third party supplier in CL&P’s territory and seven out of ten customers in UI’s territory were paying more than standard rages during the study period.  The overpayments, according to AARP, totaled about $13.7 million per month –“money that residents, especially older adults on fixed incomes, could be spending on basic necessities like groceries and medication,”  AARP noted.

Ninety percent of those surveyed supported proposals to protect consumers by requiring suppliers to disclose all costs associated with their prices, including early termination fees and minimum monthly charges, and 85 percent supported requiring suppliers who offer variable rate contracts to provide specific comparison information.

“It’s clear from these survey results, and from the stories our members have shared with us, that electric customers don’t feel like they’re getting a fair shake,” said AARP Connecticut Advocacy Director, John Erlingheuser.  “They’re fed up with high electric rates, with the constant marketing and questionable practices of third-party suppliers, and with the lack of oversight and enforcement by state regulators.  They want their elected officials to do more to help lower rates and ensure adequate consumer protections are in place in the alternative electric supply market.”

Among those surveyed, 77 percent were CL&P customers, and 16 percent were United Illuminating customers.  The survey pointed out to respondents that consumer electric bills are divided into two major sections: delivery and generation supply. CL&P and United Illuminating are the primary delivery companies in Connecticut. Since 2000, the supply portion of the bill has been deregulated, “meaning that independent companies, known as ‘electric suppliers,’ can compete to sell or supply you electricity.”  CL&P and UI continue to supply as well as deliver to consumers, but under deregulation, electric supply can be provided by other companies.  The deregulation plan was adopted by state government in an effort to reduce prices through a competitive marketplace.

Testifying at the state legislature last month, AARP Connecticut indicated that an array of unscrupulous marketing practices are luring consumers – especially those over age 50 - with seemingly attractive offers, only to have consumers receive bills charging rates often well in excess those that consumers had been paying previously.  They outlined a series of reforms that would better protect consumers.

In testimony before the Energy & Technology Committee, AARP Connecticut stated “What proponents of deregulation failed to recognize that markets require supervision, consumer protections, and proper enforcement. Some marketers have turned to means to capture customer interest and agreement that have resulted in complaints, misrepresentation of prices, the use of variable rates that are not predictable or even plainly stated, teaser rates, the renewal of fixed rate contracts into variable rate contracts without affirmative customer consent, and a host of telemarketing and door to door activities that confuse customers and take advantage of their lack of education and understanding of the terms being proposed to them in a hard sell marketing technique.”

Connecticut's Public Utilities Regulatory Authority (PURA) held a series of public hearings in February to solicit public comment in its ongoing investigation of the electric supplier market in Connecticut.  The agency provides a list of electric suppliers and aggregators on its website.  Earlier this month, Attorney General George Jepson and State Consumer Counsel Elin Katz called for enhanced consumer protections, CT Watchdog reported.

AARP Connecticut commissioned a telephone survey of 800 Connecticut residents age 50 and older to learn about their opinions on electric utility marketing and regulations.  The interviews took place between March 11 and March 16, and the data was weighted to reflect the Connecticut population age 50 and older.  The survey has a margin of error of plus or minus 3.5 percent.

France Replaces Canada As #1 Nation for Connecticut Exports in 2013

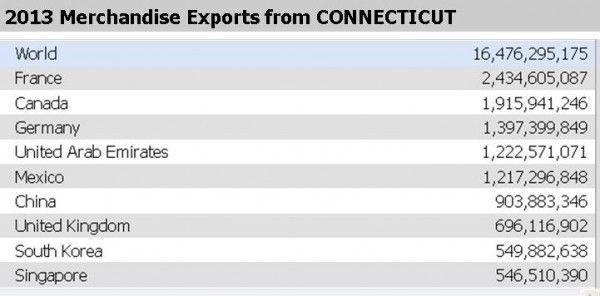
France replaced Canada as Connecticut’s top export partner in 2013.  Exports to France jumped from 1.9 billion to 2.4 billion, compared with the previous year, while exports from Connecticut to Canada remained steady at 1.9 billion.  During 2013, France received 14.8 percent of the state’s exports, while Canada received 11.6 percent, according to data from the U.S. Department of Commerce.

Germany (1.4 billion), United Arab Emirates (1.2 billion) and Mexico ($1.2 billion) round out Connecticut’s top five for 2013.  Germany also ranked third in 2012.   In 2013, UAE edged Mexico for fourth place among Connecticut’s leading export recipients, the reverse of their standing the previous year.    export chart

Overall, shipments of merchandise from Connecticut in 2013 totaled $16.5 billion, according to data from the Department of Commerce’s International Trade Administration – an increase of 3.2 percent from the previous year.  Connecticut was one of 16 states setting annual export records.  Exports were 15.9 billion a year ago, which was a drop from 16.2 billion in 2011 and 16.0 billion in 2010.

exportsOverall, the European Union was Connecticut’s largest export market, with average exports (2011-2013) totaling $6 billion annually, the agency’s report noted.
The state's largest merchandise export category is Transportation Equipment, which accounted for $8.0 billion of Connecticut's total merchandise exports in 2013, a category dominated by civilian aircraft, engines and parts, according to Commerce Department data. Other top merchandise exports are Machinery, Except Electrical ($1.9billion), Computer & Electronic Products ($1.3billion), Chemicals ($998 million), and Electrical Equipment, Appliances & Components ($760 million).

After the top five, Connecticut’s export recipients, in order, are China, United Kingdom, South Korea, Singapore, Japan, Netherlands, Brazil, Malaysia, Qatar and Turkey, rounding out the top 15.

In a year-to-year comparison of 2013 to 2012, exports to France increased by a substantial 27 percent, to Singapore by 13.6 percent and to the UAE by 12.3 percent.  Exports to Columbia jumped 232 percent, from $66 million to $219 million.  Exports dropped slightly to Japan, China, Malaysia and the Netherlands.

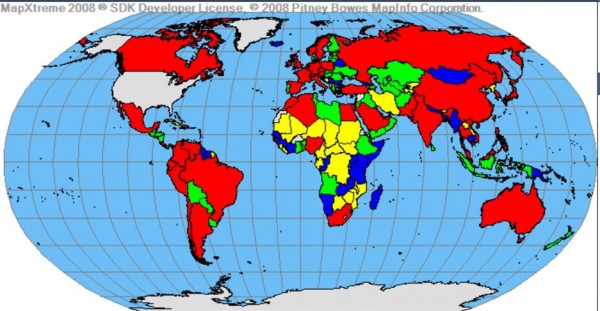
The United States currently has free trade export mapagreements in force with 20 countries, which account for $5.0 billion (30 percent) of Connecticut’s exports. During the past 10 years, exports from Connecticut to these markets grew by 69 percent, with NAFTA, Korea, Singapore, Colombia, and Israel showing the largest dollar growth during this period, the agency reported.

Connecticut’s goods exports to all Trans-Pacific Partnership markets increased by 9 percent from 2011 to 2013. During this period, 29 percent of Connecticut’s total goods exports went to the TPP nations, which include Australia, Brunei, Canada, Chile, Japan, Malaysia, Mexico, New Zealand, Peru, Singapore and Vietnam.  In 2013, 44 percent of total U.S. exports went to TPP nations, where the U.S. has focused on “creating a high standard, regional agreement that opens new markets and knits together existing U.S. trade agreements,” according to the agency’s update report.

The U.S. set an all-time record 2.3 trillion in exports in 2013.  Joining Connecticut in reaching state export records (see interactive map) were Texas, California, Washington, Louisiana, Michigan, Ohio, Georgia, Tennessee, North Carolina, South Carolina, Kentucky, Mississippi, Maryland, Colorado and Oklahoma.

Over one-quarter (27.4 percent) of all manufacturing workers in Connecticut depended on exports for their jobs, according to 2011, the most recent available in that category.  A total of 6,020 companies exported from Connecticut locations in 2011. Of those, 5,357(89.0percent) were small and medium-sized enterprises with fewer than 500 employees. Small and medium-sized firms generated over one quarter (26.6percent) of Connecticut's total exports of merchandise in 2011.


Volleyball to Overrun CT Convention Center Twice in 2015; New Event Coming to Hartford

2015 is shaping up as a banner year for the Connecticut Convention Center.  For the second time in the span of a few weeks, the convention center  has announced a new event will be coming to town.  The New England Region Volleyball Association (NERVA) will bring its first-ever Northeast Junior Championships to Hartford over Memorial Day weekend in 2015.

The tournament, featuring junior teams from throughout the Northeast, is expected to bring over 2,000 players, 400 coaches, 75 officials and volunteer tournament staff, and 3,500 family members and fans downtown, from Friday, May 22 through Monday, May 25, 2015.

Better yet, NERVA has committed to holding the event at the venue for the next three years, through at least 2017, with over 3,000 overnight rooms and 1,100 rooms anticipated for the new annual event. 2013 CTCC NERVA Winterfest

Tournament organizers are planning to fill the facility with 200 teams playing on 25 courts set up inside the Convention Center’s exhibit halls. They have experience in turning the space into an enormous multi-court facility, having held its annual Mizuno New England Winterfest at the facility in January over the long Martin Luther King, Jr. weekend, for each of the past five years.

Also on the docket at the Connecticut Convention Center in 2015 is the Museum Store Association national conference, to be held in Hartford for the first time next April.  It is the organization’s first conference in the Northeast in a decade.  They met in 2003 in Philadimage_logo1elphia, and will meet next month in Houston.

Other multi-year contracts continue.  ConnectiCon, which has been hosted at the Connecticut Convention Center since 2005, will return this year and next.  Mary Kay will return to the facility in 2015 and 2016.  And the National Association of Campus Activities (NACA), which has gathered at the Convention Center annually since 2007, will do so again this year and in 2015. The STITCHES-East regional knitting enthusiasts will be back every year through 2017.

“We have always valued our partnership with the Connecticut Convention Center and the Connecticut Convention and Sports Bureau,” states David Peixoto, NERVA Commissioner. “Our partnership has grown to develop Winterfest as the Premier Volleyball tournament in the Northeast. We look forward to making the Northeast Junior Championship just as successful.”6

The new four-day event does not require teams to qualify to participate. While it will serve as a season-ending tournament for some, the event will allow for additional preparation to teams continuing on to nationals. Participants are 12-18 years old, as NERVA follows USA Volleyball age guidelines.

Winterfest, which is the largest volleyball tournament held in New England, is designed to showcase female high school volleyball players to college coaches and recruiters from throughout the Northeast.  The event brings in around 6,000 visitors to the area every year.

The New England Region is one of many Regions in the United States that aid in the governing of the sport of volleyball. Regional Volleyball Associations (RVAs) are member organizations of USA Volleyball (USAV). The RVAs serve as the grassroots function for the USAV and individually and collectively serve as a catalyst for USAV functions.

The Connecticut Convention Center is the state’s premier meeting venue and the largest full-service convention facility between New York and Boston. Overlooking the Connecticut River, it features 140,000 square feet of exhibition space, a 40,000-square-foot ballroom and 25,000 square feet of meeting space, as well as ample sheltered parking.

More Children in Poverty, Less State Spending For Children, Reports Reveal

The percent of children in poverty in Connecticut increased to 13.2 percent, up from 10.4 percent in the 2000 Census, according to advocacy organization Connecticut Voices for Children, which analyzed data  in the U.S. Census Bureau’s American Community Survey (ACS) covering 2008-2012.  The statewide increase in poverty among children reflects significantly increased child poverty rates in 30 cities and towns, and decreased poverty rates for children in only 12 communities.

Income disparities among Connecticut’s communities are also clearly reflected in the data.  In Hartford, for example, the percentage of children in poverty reached a state high of 45 percent and the adult poverty rate hit 33 percent, while at the other end of the spectrum, the rate in Canterbury was less than 1 percent among children and less than 3 percent among adults.

After Hartford, the percentage of children living in poverty was at its highest in the state’s urban and rural communities:  New Haven topped 37 percent, in Waterbury 34 perckidsent, New London 29 percent, Cornwall, 27 percent, Norwich 23 percent, Meriden 22 percent, East Hartford and Preston, both at 21 percent, Stamford and Kent, both at 13 percent, and Danbury 12 percent.

The following 30 towns had statistically significant increases in the percent of all children in poverty: Ansonia, Avon, Berlin, Branford, Bridgeport, Cornwall, Danbury, Darien, Derby, East Haddam, East Hartford, East Haven, Enfield, Hartford, Harwinton, Litchfield, Meriden, Middletown, New Britain, New Hartford, New Haven, Norwich, Plymouth, Preston, Stamford, Vernon, Waterbury, West Haven, Windham, and Windsor Locks.

The following 12 towns had statistically significant decreases in the percent of children in poverty: Barkhamsted, Canterbury, Columbia, Granby, Hamden, Morris, Old Lyme, Salisbury, Sharon, Thomaston, Winchester, and Woodbridge. voices logo

The percent of all Connecticut residents in poverty increased to 10.0 percent according to the ACS data, up from 7.9 percent in Census 2000 (1999 figures).  Because the ACS is based on information gathered from a sample of local residents, the "sample size" in each town can be small in any one year.  The Census Bureau, therefore, averages together five years of data to create more reliable estimates.

In another report issued early this year, it was revealed that over the past two decades, Connecticut has committed less and less of its state budget to young people, according to the Fiscal Policy Center at Connecticut Voices for Children.

The report finds that spending on the “Children’s Budget” – state government spending that directly benefits young people – has dropped from 40% of the state budget in Fiscal Year 1992 to 30% in the current budget year (FY 2014). Spending on education has fallen by about a third -- from 26% of the state budget to 19% between Fiscal Years 19American Community Survey92 and 2014. The report, “Introducing the Children’s Budget,” is available on the Connecticut Voices for Children website at www.ctvoices.org

Connecticut Voices for Children is a research-based think tank that advocates for policies that benefit the state’s children and families.  Based in New Haven, the organization advances its mission through high quality research and analysis, strategic communications, community education, and development of the next generation of advocates.

Seven Communities Earn Grants to Strengthen Downtowns

Connecticut Main Street Center (CMSC), the downtown revitalization and economic development non-profit, has selected seven organizations and municipalities to receive a total of $70,000 in  Preservation of Place grants this year.

The 2014 grants will be used to provide Connecticut communities in Bridgeport, Canton, Essex, New London, Norwalk, the Northwest corner, and Willimantic with targeted resources to increase their capacity to plan for preservation and revitalization initiatives in their downtowns and neighborhood commercial districts.

The PreserCT Main Street LOGOvation of Place grant program provides a source of funding for new initiatives that can be integrated into, and leverage, comprehensive Main Street preservation and revitalization programs. The funds are meant to be flexible to meet individual community need.

"Historic preservation and the revitalization of our Main Streets create jobs, bring vacant buildings back on the tax rolls and add value and vitality to adjacent buildings and neighborhoods," said John Simone, CMSC President & CEO. "This year's winners are taking steps to implement these types of positive changes by proactively planning for the growth and improvement of their downtowns."

The selected organizations or initiatives will receive between $5,000 and $14,500 in Preservation of Place grant funds:

  • ·         Bridgeport Downtown Special Services District, for the creation of a plan that will use open spaces to facilitate creating placemaking in downtown Bridgeport
  • ·         Town of Canton, for the development of Collinsville Village Zoning Regulations;
  • ·         Town of Essex, for a Centerbrook Visioning & Action Plan;
  • ·         New London Main Street, for an organizational and leadership development and capacity-building plan,
  • ·         Norwalk 2.0, for the Freese Park Artist Village Plan;
  • ·         Northwest CT Regional Planning Collaborative, for Active Main Street: Enlivening Village Center Public Spaces;preservation of place
  • ·         Thread City Development, Inc. (Willimantic), for an organizational and leadership development plan.

"The diversity of locations, from the Northwest Corner of Connecticut to New London, matched with the diversity of projects, from creative placemaking in urban open spaces to organizational and leadership development that will improve the management function in downtown, will allow each community to respond to their greatest current need, actively creating their direction of growth," Simone said.

Since 2008, CMSC has awarded $376,130 through the Preservation new londonof Place grant program to twenty Connecticut communities, leveraging $842,727 in local Main Street initiatives. The program receives support from the State Historic Preservation Office with funds from the Community Investment Act.

Number of Brewery Permits Nearly Doubles in CT in Past Five Years

The number of brewery permits in Connecticut has nearly doubled during the past five years, from 19 in 2008 to 36 in 2013, reflecting the rapid growth in the state – and nationwide – in the craft brewing industry.

Connecticut ranked #29 in the nation, between Georgia and New Jersey, in the state-by-state rankings, compiled by Bloomberg.com using data fbee brandsrom the Beer Institute and the Alcohol and Tobacco tax and Trade Bureau.  There were 3,699 permitted breweries in the United States last year, about 34 percent more than the previous year.
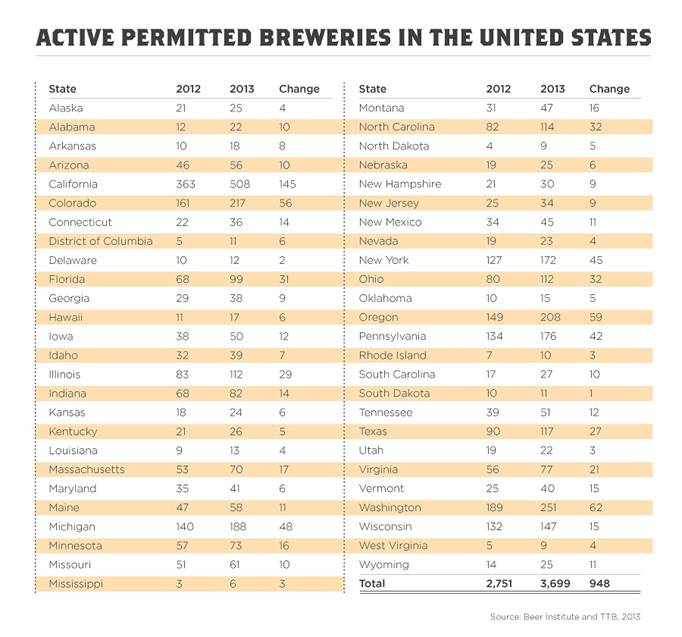
California led the nation with 508 brewery permits, followed by Washington State with 251, Colorado with 217, Oregon with 208 and Michigan with 188.  Rounding out the top ten were Pennsylvania (176), New York (172), Wisconsin (147), Texas (117), North Carolina (114) and Illinois and Ohio, each with 112 permitted breweries.  Every state in the nation saw an increase from 2012 to 2013.

According to the data, Connecticut had 19 permitted breweries in 2008 and 22 in 2012.  That number jumped to 36 last year.  In comparison to other states, Connecticut’s ranking dropped from 19th in 2012 to 29th in 2013, even as the number of permitted breweries increased by more than 50 percent.

 With 19 breweries and 16 in planning, according to the Brewers Association, Connecticut's economy and craft brewing industry could see tens of thousands of dollars of reinvestment.  In timage004.jpghe comparative survey, permitted breweries refer to manufacturers that have completed the appropriate paperwork and obtained the necessary permits to operate, though they may not be fully operational yet, according to Bloomberg.com .
Among our neighboring states, between 2008 and 2013, Massachusetts increased from 41 to 70 brewery permits, New York from 72 to 173, and Rhode Island, which ranked #48, from 5 to 10.   North Dakota, which had one permitted brewery in 2008, now has nine, moving from #50 to #49 in the nation.

The U.S. Department of Justice Bureau of Alcohol, Tobacco & Firearms (www.atf.gov) requires retailers and manufacturers of alcohol (i.e. brew pubs) to register. The Bureau also regulates the operation of distilleries, wineries, and breweries as well as, importers and wholesalers in the industry. In addition, the Liquor Control Division of the  Connecticut Department of Consumer Protection requires a liquor permit.

The state’s tourism website, “Still Revolutionary,” suggests that “Whether you’re looking for a relaxing Sunday afternoon with friends or a longer vacation with a significant other, take a few days to explore the Connecticut Beer Trail.”

The site states unequivocally that “Connecticut is home to some of the best breweries in the country!  The Connecticut Beer Trail spotlights the high quality and creative diversity of fresh, hand-crafted, locally-brewed beer, linking together some of the best breweries in the nation.”

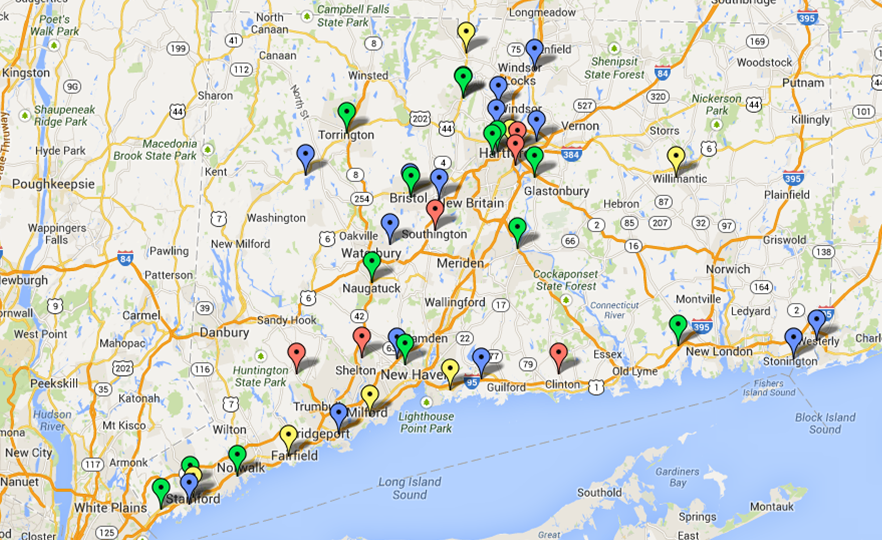
The Connecticut Beer Trail website, www.ctbeertrail.net, lists:

Other local brands included are:

Additionally, a number of breweries are in an early phase of development, according to the website:

CTBeerTrail.net was launched in 2010 by Byron Turner, according to the website ctbeerwine.com, to create a local craft beer social media community that was well-timed with Connecticut’s legislative push for a “Connecticut Brewery Trail.”  Gov. Malloy signed Senate Bill No. 464 into law on July 13, 2011, establishing a Connecticut Beer Trail by allowing the Department of Transportation to permit directional and other official signs or notices about facilities where Connecticut beer is made or sold, including signs or notices containing the words “Connecticut Brewery Trail”.  The website reports that as of December 2013, such signs have yet to be posted.     (Chart: Washington Post)