Demographics in New England Bring Enrollment Challenges for Higher Education
/Connecticut’s public colleges and universities are pulling out all the stops to bring students back to campus who may have started – and stopped – their pursuit of higher education years ago. Incentive programs – including free classes – are driven by an acute need to counter declining enrollment from “traditional” students that recent data suggests will continue to intensify for years to come.
The New England Journal of Higher Education, using U.S. Census data, found that New England is demographically the oldest and most rapidly aging of the nine Census divisions in the United States. The Journal reported that “Its median age, which is now over 40, has risen by seven years since 1990. This region has six of the 12 states with the most rapidly rising median ages. Maine, Vermont and New Hampshire have the nation’s highest median ages (43.9, 42.4 and 42.3) and also rank first, second and third among the most rapidly aging since 1990.”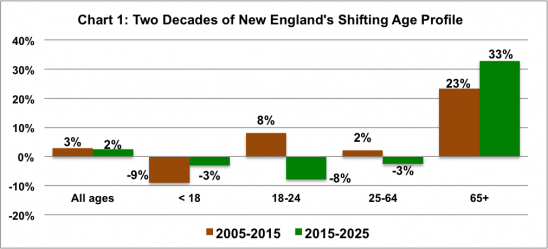
Between the 2000 and 2010 census, the number of children under age 18 in New England declined 197,000 or 6 percent, the Journal reported. From the 2010 census until mid-2013 this region dropped another 102,000 children, and that rate of decline is projected to continue. From 2010 to 2013, every New England state had more people move out than move in. In total, the region lost a net of almost 100,000 people through out-migration in just those three years.
After reaching an all-time peak in 2010, enrollment at Connecticut's 17 community colleges, state universities and the online-only Charter Oak State College – which make up the Connecticut State Colleges and Universities (CSCU) system - dropped to 92,989 last academic year, down 4.3 percent from its peak and its lowest level since 2008. At Central, Southern, Eastern, and Western Connecticut State Universities combined enrollment reached its lowest level in 14 years, Hartford Business Journal has reported.
Writing in the New England Journal, a publication of the New England Board of Higher Education, demographer Peter Francese pointed out that “the most rapidly growing ages in New England are, by far, people aged 65 or older. That combined with the decline in numbers of children portend a very difficult decade for the region’s colleges and universities.”
Using state published projections, he describes “a picture of continuing decline among children, but also forecasts a shift in the 18-to-24 age group and the 25-to-64 age groups from growth in the past to decline in the future. However, the past double-digit growth among residents age 65 or older is projected to continue at an even faster pace over the next 10 years.”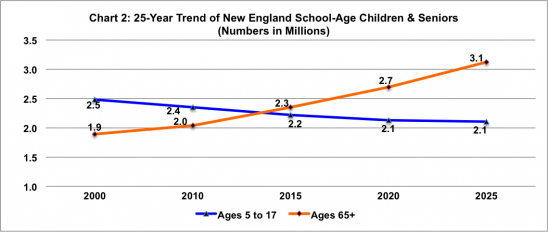
The data and projections also indicate that the region is fast approaching “a tipping point where the number of elderly will increasingly outnumber school-age children.” Francese, director of demographic forecasts for the New England Economic Partnership and founder of the former American Demographics magazine, suggests that “that this trend will mean continuing erosion of financial support for local public education. It may also mean a gradual erosion in the quality of the region’s secondary schools and the consequent impact on those in higher education who depend on having a reliable source of college-ready high school graduates.”
Enrollment at the 17 CSCU institutions in Connecticut for Fall 2014 was down by 1,428 students, or 1.5 percent, from the previous year, according to data compiled by the state Office of Higher Education. The total number of students, 91,192, includes more part-time than full-time students – 47,670 part-time versus 43,522 full-time. At the flagship University of Connecticut, which is outside the CSCU system, enrollment climbed 2.1 percent between 2013 and 2014, boosted by the hiring of additional faculty and additional state funding for "Next Generation UConn" - expansion plans that project increasing enrollment at the university's main campus by one-third over the next decade.
Chart 1: U.S. Census Bureau 2005 population estimates, New England states projections and author’s calculations; Chart 2: Historical data is from the Census Bureau, population projections are by each New England state. These charts first appeared in the New England Journal of Higher Education.

 rcentage increases in ELL students, between 2001 and last year, came in Windham (11.8% increase), Danbury (up 9.4%), Norwich (up 9.1%), and New London and West Haven (both up 7.4%).
 The new interactive tool, on the Connecticut Voices for Children website, enables visitors to track spending across nearly 100 children’s programs over 25 years. Over the last two decades, spending on children’s programs
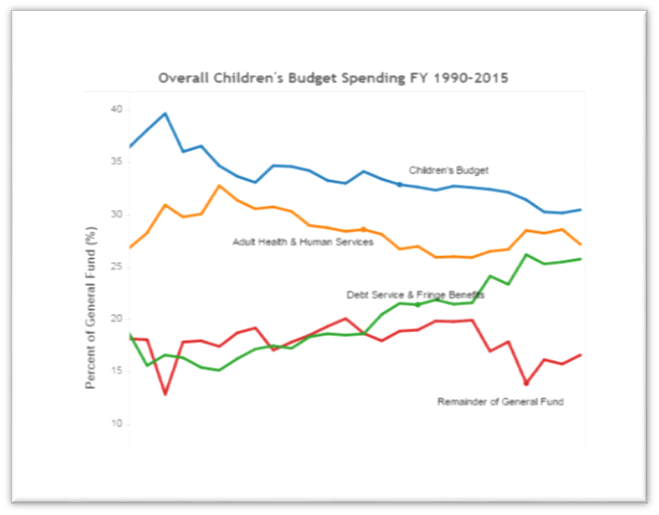

 ent where people with autism or sensory needs, along with their families, can enjoy coming to the theatre together and will feel comfortable, supported and free to be themselves.”

 rt this new chapter,” said co-founder and CEO Kate Pipa, who lives in Shelton. “And we are excited to bring kids a new box each month of hands-on fun that also doubles as a learning opportunity and is making social impact for the kids and for our partner organizations.”
 Making the grade are Bridgeport, Hartford, and New Haven. Their respective round one opponents make the Connecticut cities strong underdogs in need of a sizable population surge. Bridgeport goes up against San Francisco, Hartford faces Baltimore, and New Haven is up against Portland. (No, not Portland, Connecticut.)
 one of two versions of the game, geographic level: metro areas or states. Then they click on the name of the city in each match-up that you think has the larger population. Green shows a correct answer, red indicates an incorrect answer. Players are urged to “see how close you can come to a perfect score of 63” and then asked to “mouse-over results to view the most current population estimates for each pair.”


 ld University at #396. Outside the top 400 from Connecticut were Wesleyan University, Yale University, Quinnipiac University and Trinity College.
 ity in New Jersey, Florida Agricultural and Mechanical University, Florida International University, and six institutions in California, including California State Polytechnic University, the University of California and Cal State.
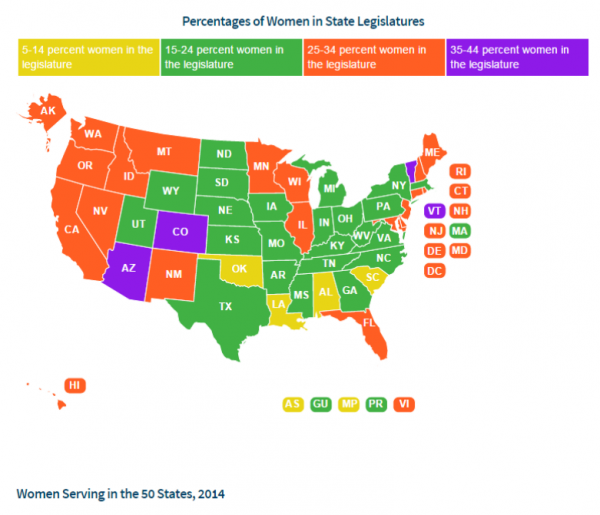
 Republicans. The House Speaker, House Majority Leader, Senate President Pro Tempore Senate Majority Leader, and Senate Republican Leader for the 2015 session are men, as was true in the previous legislative session. Connecticut has seen a woman Speaker of t
 he House, but there has not been a woman selected to serve as Senate President Pro Tempore or Majority Leader.