CT’s Has Nation’s Third Lowest Rate of People Killed by Police; National Data Reveals Glaring Disparities Among States, Cities

Between January 2013 and April 2016, the rate of individuals killed by police in Connecticut was the third lowest in the nation, according to the website mappingpoliceviolence.org  The website indicates that during that period, there were 20 people killed by police in the state, for a rate of 5.60, based on the state’s population.  The only states with lower rates were New York, at 5.26, and Rhode Island, at 3.80. stat 1 The highest rates were in New Mexico (31.5), D.C. (28.25), Oklahoma (24.52), Arizona (23.31), Nevada (21.85) and Wyoming (21.29).

Key findings highlighted on the website include:

  • 28 percent of U.S. police killings between Jan 2013 - Apr 2016 were committed by police departments of the 100 largest U.S. cities.
  • Black people were 39 percent of people killed by these 100 police departments despite being only 21 percent of the population in their jurisdictions.
  • In only 3 of the 100 largest city police departments was there no one killed between January 2013 and April 2016 (Buffalo, Irvine, and Plano), according to the website.
  • The majority (51%) of unarmed people killed by the 100 largest city police departments were Black. These police departments killed unarmed Black people at a rate 4 times higher than unarmed White people, the data indicated.
  • Rates of violent crime in cities did not make it any more or less likely for police departments to kill people. For example, Buffalo and Newark police departments had low rates of police violence despite high crime rates while Spokane and Bakersfield had relatively low crime rates and high rates of police violence, the website points out.

The site is designed to “help hold state policy-makers accountable for police violence,” and highlight “how police violence disproportionately impacts black people in many states.”  It offers a number of mapping tools to allow users to review and contrast data, and also offers a database of gathered information.

compareLooking at the rate at which Blacks were killed by police during the period January 2013 – April 2016, Connecticut was among the lowest, at 8.3, which reflects three deaths.  In New Hampshire, Vermont, North Dakota, Maine, Idaho and South Dakota, largely reflecting the population in those states, there were no deaths of African Americans, according to the data.

In 2015, among the 100 largest police departments, there were 14 police departments in which 100 percent of the individuals killed were Black (St Louis, Atlanta, Kansas City, Cleveland, Baltimore, Washington D.C., Raleigh, Milwaukee, Detroit, Philadelphia and Charlotte) and five departments in which all of those killed were White.  Connecticut’s largest cities were not included in the list.

The research indicated that “while some have blamed violent crime for being responsible for police violence in some communities, data shows that high levels of violent crime in cities did not appear to make it any more or less likely for police departments to kill people.”

The report defines a “police killing” as “a case where a person dies as a result of being chased, beaten, arrested, restrained, shot, pepper sprayed, tasered, or otherwise harmed by police officers, whether on-duty or off-duty, intentional or accidental.”

The website Mapping Police Violence is a “research collaborative collecting comprehensive data on police killings nationwide to quantify the impact of police violence in communities,” as described by the website.  The research team indicates that “the data represented on this site is the most comprehensive accounting of people killed by police since 2013.”


stat 3,4

West Hartford’s Newly Developed Complete Streets Policy is #2 in the Nation for 2015

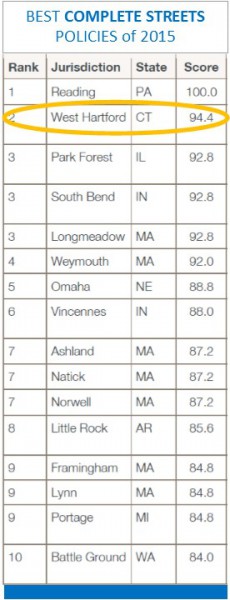
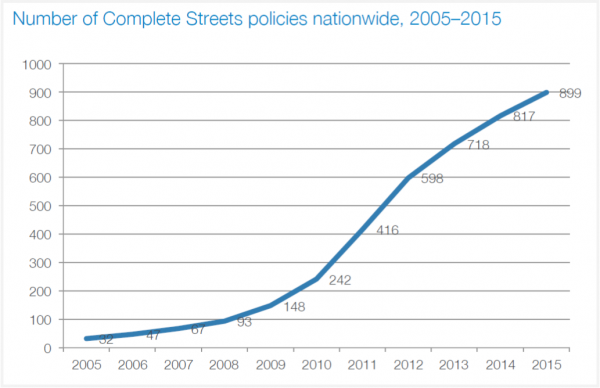
West Hartford’s Complete Streets policy, adopted in 2015, has been named the second best new policy in the nation by Smart Growth America and the Complete Streets Coalition. The coalition highlighted 16 communities nationwide for their outstanding new policies, among 82 communities that adopted Complete Streets policies during the year.  Nationwide, there are now a total of 899 Complete Streets policies in place in all 50 states, the organization announced this month. A Complete Streets approach creates an integrated transportation system that supports safe travel for people of all ages and abilities. This approach redefines what a transportation network looks like, which goals a public agency sets out to meet, and how communities prioritize their transportation spending. A Complete Streets policy is one of the best ways to set this approach into motion, Smart Growth American emphasized.

TOP 10 LISTThe U.S. Surgeon General and Secretary of Transportation both spoke out for more Complete Streets last year and Congress passed a transportation bill that included Complete Streets language for the first time ever.

The Complete Streets laws, resolutions, agency policies, and planning and design documents establish a process for selecting, funding, planning, designing, and building transportation projects that allow safe access for everyone, regardless of age, ability, income or ethnicity, and no matter how they travel.

Across the country, 32 state governments or agencies, 76 regional organizations, and 663 individual municipalities have all adopted such policies to create safer, multimodal transportation networks.

West Hartford’s policy is the result of a process that began in 2009 with the adoption of the Town’s 2009-2019 Plan of Conservation and Development,” according to town Deputy Mayor Shari Cantor.  She said the plan “promote[s] an integrated and balanced “complete street” transportation system which provides the best possible service, mobility convenience and safety while reinforcing a positive social, economic, and environmental influence on West Hartford.report

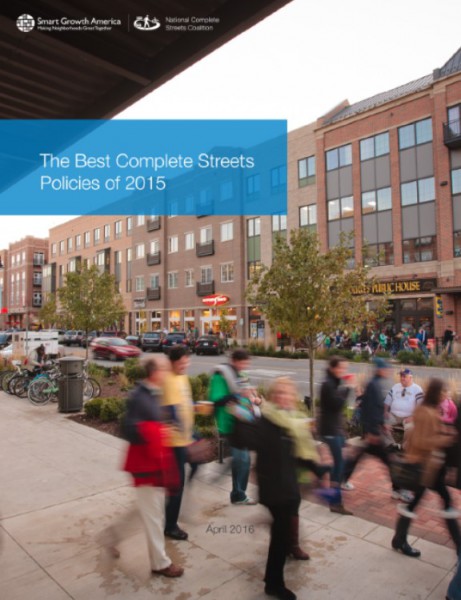
“Utilizing a comprehensive public participatory process, guided by the leadership of the Town Council; the advocacy efforts of various community groups in West Hartford including our Bicycle Advisory Committee, and the work of our Town staff; we were able to develop and adopt this tremendous Complete Streets Policy,” said Mrs. Cantor in response to the national recognition.

Each year, the National Complete Streets Coalition analyzes newly passed Complete Streets policies. The Coalition examines and scores policy language using the guidelines laid out in our ideal policy elements. Ideal policies state a community’s vision for transportation, provide for many types of users, complement community needs, and establish a flexible project delivery approach. Different types of policy statements are included in the Coalition’s review, including legislation, resolutions, executive orders, internal policies, and policies adopted by an elected board.

The Coalition ranks new Complete Streets policies to celebrate the people who developed exceptional policy language and to provide leaders at all levels of government with examples of strong Complete Streets policies.

Sixteen agencies led the nation in creating and adopting comprehensive Complete Streets policies in 2015. Topping the list, with the first-ever score of 100, was Reading, PA, followed by West Hartford, Park Forest, IL and South Bend, IN.  Four of the next seven slots went to communities in Massachusetts:  Longmeadow, Weymouth, Ashland, Natick and Norwell.  The others were Omaha, NE and Incennes, IN.

Of the 663 municipalities with Complete Streets policies, 239 (or 36 percent) are suburban communities. Small towns, often in rural areas, have passed 111 policies, or 17 percent of all municipal policies. On the other end of the spectrum, 12 of the 15 most populous cities in the country have committed to Complete Streets with a policy, according to the organization’s 2015 report. Blue_Back_Square_in_West_Hartford,_Connecticut,_August_10,_2008

“A Complete Streets approach is about helping everyone stay safe on the road—no matter if they’re walking, biking, taking transit, using an assistive device, or driving,” said Emiko Atherton, Director of the National Complete Streets Coalition. “Passing a Complete Streets policy is one of the best actions communities can take toward achieving these goals.”

Connecticut became the 10th state in the nation to adopt a Complete Streets law, in 2009.  The law mandates “accommodations for all users shall be a routine part of the planning, design, construction and operating activities” of all state highways. Connecticut’s Complete Streets law has evolved, and now (Conn. Gen. Stat. §13-153f) requires pedestrians, cyclists, and transit users to be routinely considered in the planning, designing, construction and operation of all roads.

In 2014, Bike Walk Connecticut released a first-of-its-kind ranking of the state’s cities and towns on how bike- and walk-friendly they are. Simsbury (1), New Haven (2), New Britain (3), Glastonbury (4), and Middletown (5) claimed top honors as the five most bike- and walk-friendly communities.

Esga-logoarlier this year, the University of Connecticut released a study that shows how shared space, a design concept that encourages all users to share street space, can provide much greater vehicular capacity than conventional intersections and increases pedestrian convenience. The study found that by redesigning streets and intersections as human-scaled places and incorporating shared space concepts, communities of all sizes have successfully encouraged active transportation, stimulated their local economies, reduced accident severity, and lessened their environmental impacts. The study compared actual user delays at six shared space intersections to expected user delays using standard U.S. traffic modeling software.  The state Department of Transportation issued a policy document in 2014 consistent with the law.

The criteria used in the Complete Streets evaluation include:

  1. Vision: The policy establishes a motivating vision for why the community wants Complete Streets: to improve safety, promote better health, make overall travel more efficient, improve the convenience of choices, or for other reasons.
  2. All users and modes: The policy specifies that “all modes” includes walking, bicycling, riding public transportation, driving trucks, buses and automobiles and “all users” includes people of all ages and abilities.
  3. All projects and phases: All types of transportation projects are subject to the policy, including design, planning, construction, maintenance, and operations of new and existing streets and facilities.
  4. Clear, accountable exceptions: Any exceptions to the policy are specified and approved by a high-level official.
  5. Network: The policy recognizes the need to create a comprehensive, integrated and connected network for all modes and encourages street connectivity.
  6. Jurisdiction: All other agencies that govern transportation activities can clearly understand the policy’s application and may be involved in the process as appropriate.
  7. Design: The policy recommends use of the latest and best design criteria and guidelines, while recognizing the need for design flexibility to balance user needs in context.
  8. Context sensitivity: The current and planned context—buildings, land use, transportation, and community needs—is considered in when planning and designing transportation solutions.
  9. Performance measures: The policy includes performance standards with measurable outcomes.
  10. Implementation steps: Specific next steps for implementing the policy are described.

The National Complete Streets Coalition, a program of Smart Growth America, is a non-profit, non-partisan alliance of public interest organizations and transportation professionals committed to the development and implementation of Complete Streets policies and practices. A nationwide movement launched by the Coalition in 2004, Complete Streets is the integration of people and place in the planning, design, construction, operation, and maintenance of transportation networks.

national chart

Gary Ginsberg Receives Public Communications Award from the Society of Toxicology

Dr. Gary Ginsberg, a Senior Toxicologist with the Connecticut Department of Public Health (DPH) has been awarded the “Public Communications Award” by the Society of Toxicology, an international organization dedicated to enhancing the impact and relevance of toxicology. Dr. Ginsberg was recognized by the organization for his efforts in explaining complex toxicology issues to the public, with the conference program noting that “Dr. Ginsberg is able to consolidate vast amounts of science into easily digestible useful information to help protect consumers from potentially hazardous situations.”ginsberg

At DPH, Dr. Ginsberg regularly prepares educational material for citizens on emerging contaminant issues, such as arsenic in pressure treated wood, the hazards to children from mothballs, and chemicals in children’s products and toys.  He has represented DPH in the media on numerous topics ranging from mercury in fish to chemical spill emergencies. He has also appeared on television shows such as the Dr. Oz Show and had his own radio program covering environmental issues of the day.

The organization’s annual conference, attended by 6,500 toxicologists and 350 exhibitors from across the country, and held in New Orleans last month, honored Ginsberg, who has been employed by DPH for over 20 years and regularly communicates with the legislature, local health departments, the general public and other state agencies on a wide variety of toxic exposure issues.

The recognition comes as Connecticut and the nation mark National Public Health Week, April 4-10.sot_logo

Conference organizers pointed out that “his dedication to toxicology is evident though his tireless endeavors to educate the public and other health care professionals with accurate and practical knowledge.”  Also noted were his regular contributions to a Yale University blog on toxicology issues, and his website, www.whatstoxic.org, as well as writing on toxicology issues in state and national publications. Dr. Ginsberg evaluates human exposures to chemicals present in the air, water, soil, food, and in the workplace, and provides risk assessment expertise to state agencies in standard setting and site remediation projects.

Dr. Ginsberg was featured in a recent “Wastebusters” video produced by the CT Department of Energy and Environmental Protection and CT DPH on the importance of selecting green cleaning products in schools and homes.  He has drafted numerous fact sheets on chemical hazards in consumer products, such as sun screen and chemicals in hand sanitizers. In 2006, Dr. Ginsberg co-authored a book called “What’s Toxic What’s Not” (Berkeley Books, 2006).

book“We are extremely proud of Dr. Ginsberg and congratulate him on this prestigious and well deserved award,” said Ellen Blaschinski, DPH’s Regulatory Services Branch Chief.  “His expertise in toxic exposures and ability to consolidate vast amounts of science into easily digestible, useful information helps protect and inform Connecticut’s citizens.”

A resident of East Granby, Dr. Ginsberg received his PhD from UConn in 1986. In addition to working at DPH, Dr. Ginsberg is an assistant clinical professor at the UConn School of Community Medicine, an adjunct faculty member at Yale University and has served on a number of US EPA advisory committees and on the National Academy of Sciences.

The Society of Toxicology is a professional and scholarly organization of scientists from academic institutions, government, and industry representing the great variety of scientists who practice toxicology in the US and abroad. The Society’s mission is to create a safer and healthier world by advancing the science and increasing the impact of toxicology.

https://youtu.be/l1MIcvoWGMo

CT Medical Examining Board Website Ranked 15th in US

If you’re looking for information about your doctor, you may find yourself searching the website of the state medical board.  In states across the country, those are the agencies that license physicians and also discipline them for offenses including sexual misconduct, substance abuse, and negligent care. But the accuracy and completeness of the information you find varies from state to state, according to a new analysis from Consumer Reports, which ranked the Connecticut Medical Examining Board as 15th in the nation for the information readily available to the public from the agency website.

Consumer Reports Safe Patient Project partnered with the nonprofit Informed Patient Institute to evaluate the websites of state medical boards in all 50 states. They found that most are difficult to navigate and the information on them varies widely.

consumerOverall scores were based on eight categories:  Search Capabilities, Complaint and Board Information, Identifying Doctor Information, Board Disciplinary Actions, Hospital Disciplinary Actions, Federal Disciplinary Actions, Malpractice Payouts and Convictions.

Connecticut, with an overall score of 58, was rated good in four categories, very good in two, and excellent in one category.  Only one category was given a poor rating.

The highest rated state medical board websites were in California (84), New York (79), Massachusetts (78), Illinois (76), North Carolina (76), Virginia (72), New Jersey (70), Florida (70) and Texas (68).medical examining board

The Federation of State Medical Boards, which represents the boards and facilitates communication among them, acknowledges that variation is a potential issue. “Consistency is certainly a worthy goal,” Lisa Robin, chief advocacy officer for the organization told Consumer Reports. “Looking at the disciplinary trends to make improvements in the system … we would always encourage that.” Still, she also says that, “the rate of discipline alone is probably not a good picture of really what the boards do and how well they’re able to protect patients in their state.”

But, as Consumer Reports’ analysis found, those state boards fall short in other measures, too. In fact, in many instances, physicians who have been severely disciplined continue to practice while their offenses remain relatively hidden, buried deep on the boards' websites or unavailable entirely online.

The Connecticut Medical Examining Board website includes a listing of disciplinary actions taken by the Connecticut Medical Examining Board or the Connecticut Department of Public Health but notes that “information is not intended for licensure verification purposes.”  Actions taken – ranging from reprimands to civil penalties to license suspension or revocation are listed.  Board meeting minutes are also available on the site, as well as procedures for individuals to file complaints.

states

Increased Municipal Burden, Disproportionate Impact on Low-Income Drivers Among Possible Effects of Highway Tolls, Report Finds

If Connecticut opts to introduce a system of tolls on the state’s roads to help fund a significant expansion of transportation infrastructure projects in the years ahead, the toll system instituted could run the risk of causing an increased use of local roadways that “could shift the burden of maintenance and congestion to municipalities,” and lower income residents in the state could be faced with “a higher burden relative to their incomes than wealthier Connecticut residents.” Those warnings to policy makers are included in an Issue Brief  by Inform CT that reviews the various tolling options and respective challenges posed.  Connecticut eliminated tolls more than 30 years ago in the aftermath of a horrific accident at the Stratford toll plaza, and state leaders have been in a “perpetual debate about whether to reinstate them ever since,” the paper points out.issue brief

With overhauling the state’s transportation system is a leading element in Governor Malloy’s agenda to boost the state’s economy, renewed attention is being paid to methods of generating sufficient revenue to support those initiatives, and to issues raised in the 2015 policy brief.  Spurred by advances in technology, the possibility of imposing a system of electronic tolls, such as those in use in other states, are among the considerations, with border tolling, distance tolling and congestion pricing among the options.

920x920The issue brief indicated that a disadvantage of a distance toll system on all limited access highways in Connecticut would be that it “could create an incentive for people to use alternative roadways. The increased use of these roadways could shift the burden of maintenance and congestion to municipalities.” The advantage would be that distance tolls “could help to more efficiently allocate the cost of these roadways to drivers who use them the most.”

In analyzing the potential impact of tolls placed at Connecticut’s borders, the policy paper notes that while such an approach would “help to ensure that out-of-state residents driving through Connecticut pay for their use of Connecticut’s roadways,” border tolls “place a disproportionate burden on residents of Connecticut who commute out-of-state to work. This burden is further amplified if we believe that, on average, these out-of-state commuters use a smaller share of the roadways than their in-state commuting counterparts.”

toll options
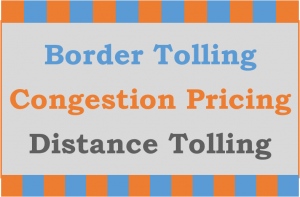
Congestion pricing, which provides for higher toll charges at peak traffic times, “helps to limit traffic on major roadways and create an incentive for people to use more environmentally friendly forms of public transportation,” the policy paper indicates.  However, a congestion pricing system “could polarize roadway use by displacing low income commuters during peak driving hours. Congestion pricing could also create displacement effects whereby the increased use of local roadways could shift the burden of maintenance and congestion to municipalities.”Print

The report suggests that “congestion pricing and distance tolls could become more affordable for low income residents if electronic payment systems were implemented that allow for income-based rate reductions.”

Earlier this year, a study panel recommended installing tolls and raising taxes in order to pay for Malloy's 30-year, $100 billion transportation program.  Legislators have said that any decision on the imposition of tolls is at least a year away, as attention focuses during the current session on establishing a method to assure that money allocated to transportation is not redirected to other areas of government.

The issue brief also stress that “a key consideration when trying to outweigh the benefits and costs of implementing tolling in Connecticut is how the revenue from the tax will be redistributed to the residents of the state.” It goes on to highlight that “as the bill stands, the monies raised would go into the Special Transportation Fund but allocation of the monies from there is not specified. The allocation of these funds is an important discussion that needs to take place before the impact of the legislation can be considered in earnest.”

InformCT is a public-private partnership that currently includes staff from the Connecticut Economic Resource Center and the Connecticut Data Collaborative. The mission of InformCT is to provide independent, non-partisan research, analysis, and public outreach focused on issues in Connecticut, and to act as the convener for fact-based dialogue and action.

Legislature to Examine Why Zero Convictions for Human Trafficking, Even As Incidents Increase in CT

Human trafficking is a form of modern-day slavery. This crime occurs when a trafficker uses force, fraud or coercion to control another person for the purpose of engaging in commercial sex acts or soliciting labor or services against his/her will.  It is happening in Connecticut. Connecticut’s Permanent Commission on the Status of Women (PCSW) is convening a Joint Informational Forum with the state legislature’s Judiciary, Public Safety and Security, and Children’s Committees on Thursday, March 31 at the Legislative Office Building to examine the issue, the response of law enforcement and other agencies in Connecticut, and where changes in state law need to be made.

A decade ago, in 2006, Connecticut enacted Public Act 06-43, which created the felony charge of trafficking in persons.

“And yet, since then, only 10 arrests have been made and there have been no convictions,” according to PCSW, which noted that during that same time, the Department of Children and Families has received more than 400 referrals of individuals with high-risk indicators for human trafficking that demanded a collaborative response, including the participation of law enforcement.  Those numbers have climbed each year, with 133 referrals in 2015, according to the Governor’s office. human trafficking

“We decided to convene trafficking experts because, as we learn more about human trafficking, in particular sex trafficking of adults and minors, we need to ensure that victims are supported and that law enforcement and prosecutors have the tools to adequately punish traffickers, those buying sex, and those permitting and facilitating the sale of sex in Connecticut,” said Jillian Gilchrest, senior policy analyst for the PCSW, and chair of the state's Trafficking in Persons Council.

“Although the legislature has made great strides to increase awareness and enhance training programs against human trafficking, and especially the sex trafficking of minors – the truth is that this modern-day slavery is a national issue,” said State Rep. Noreen Kokoruda, the ranking member of the General Assembly’s Committee on Children. “Connecticut must take the critical steps necessary to combat human trafficking and to make sure that the legislation we passed is enforced. In order to proactively address this issue, we need a collaborative effort from all agencies; this issue is simply too important to ignore.”

Data from the National Human Trafficking Resource Center (NHTRC) indicates that in 2015 there were 120 calls made and 39 human trafficking cases reported in Connecticut – the highest numbers in the past three years. The statistics are based on phone calls, emails, and webforms received by the NHTRC that reference Connecticut. The NHTRC works with service providers, law enforcement, and other professionals in Connecticut to serve victims and survivors of trafficking, respond to human trafficking cases, and share information and resources.

Since 2007, the NHTRC has received more than 600 calls to their hotline that reference Connecticut.  As Connecticut’s felony crime of trafficking in persons, Connecticut Statute §53a-192a approaches its 10-year- anniversary, members of the Judiciary, Public Safety, and Children’s Committees are interested in understanding why no one has been convicted under §53a-192a and what policy or legislative changes can help remove current barriers to prosecution in these cases, officials said.

chartIn Connecticut, a person is guilty of trafficking in persons when such person compels or induces another person to engage in sexual contact or provide labor or services by means of force, threat of force, fraud or coercion. Anyone under the age of 18 engaged in commercial sexual exploitation is deemed a victim of domestic minor sex trafficking irrespective of the use of force, threat of force, fraud or coercion.

In a January report to the state legislature, the Trafficking in Persons Council pointed out that “Connecticut is not unique; there are many states that have yet to prosecute a trafficking case. In fact, according to the U.S. Department of State, as of 2011 only 18 states brought forward human trafficking cases under state human trafficking statutes.”

A series of proposals are now being considered by the state legislature.  In recent testimony, the PCSW pointed out that “the demand side of human trafficking and prostitution has all but been ignored in Connecticut. Arrests have been concentrated first on prostitutes, and secondarily on those buying sex. In fact, in the last 10 years in Connecticut, prostitutes were convicted at a rate of 7 times that of those charged with patronizing a prostitute It’s a basic premise of supply and demand: if you reduce the demand, you reduce the supply, which in this case, is the purchase of women and children for sex.”

In legislative testimony last month, the PCSW pointed out that “more and more trafficking and prostitution are being arranged online and taking place at hotels and motels throughout Connecticut. According to the National Human Trafficking Resource Center (NHTRC), Hotels and Motels are among the top venues for sex trafficking in Connecticut.”  PCSW stressed that “as we learn more about human trafficking, and what the crime looks like in Connecticut, we must ensure that our policies keep pace with that reality.”  Among the proposals is one designed to “give more tools to investigators,” Gov. Malloy and Lt. Gov. Wyman recently told a legislative committee.

The Trafficking in Persons (TIP) Council is chaired and convened by the Permanent Commission on the Status of Women and consists of representatives from State agencies, the Judicial Branch, law enforcement, motor transport and community-based organizations that work with victims of sexual and domestic violence, immigrants, and refugees, and address behavioral health needs, social justice, and human rights.

The report recommended that “Connecticut must ensure the creation of laws that address the continuum of exploitation, the implementation of laws, and the pursuit of criminal punishments for such cases. Sentences should take into account the severity of an individual’s involvement in trafficking, imposed sentences for related crimes, and the judiciary’s right to impose punishments consistent with its laws.”

Regarding victims of trafficking in Connecticut, the report recommended that “Key victim protection efforts include 3 "Rs" - rescue, rehabilitation, and reintegration. It is important that human trafficking victims are provided access to health care, counseling, legal and shelter services in ways that are not prejudicial to victims’ rights, dignity, or psychological well-being. Effective partnerships between law enforcement and service providers mean victims feel protected and such partnerships help to facilitate participation in criminal justice and civil proceedings.”

According to Rep. Rosa C. Rebimbas, ranking member of the Judiciary Committee, “Connecticut has made great strides to protect vulnerable women and children with strong laws against human trafficking, and resources to help them escape from the horrors of human trafficking, yet we are still behind when it comes to prosecution of the criminals who perpetrate such heinous offenses. We will continue to press for stronger laws to protect Connecticut residents, and to bring justice on their behalf.”

CT Ranks 10th in Percentage of Structurally Deficient, Functionally Obsolete Bridges

Of Connecticut’s 4,225 bridges, 357 are structurally deficient (8.4%) and another 1,087 are functionally obsolete.  That’s 34 percent of the state’s bridges deemed deficient by experts – and it ranks Connecticut as the 10th worst state in the nation, by percentage. Worse than Connecticut?  Only Rhode Island, Massachusetts, Hawaii, Pennsylvania, Alaska, New York, West Virginia, New Jersey and Maine.  The data, compiled by the Federal Highway Administration of the U.S. Department of Transportation, reflects information and analysis through December 31, 2015. Picture4

While the number of structurally deficient bridges in Connecticut is the lowest since 2006, the number of functionally obsolete structures has climbed in recent years, and is now the highest since 2010.  The total number of bridges in the two categories has dropped in each of the past three years, but remains at about one-third of the state’s bridges.  Connecticut ranks 26th in the percentage of structurally deficient bridges.

According to the Nation Bridge Inventory Database website, Structurally Deficient is a status used to describe a bridge that has one or more structural defects that require attention. This status does not indicate the severity of the defect but rather that a defect is present. Conditions driving the designation could include the bridge deck, the superstructure or the substructure of the bridge.

The sufficiency rating is calculated per a formula defined by the Federal Highway Administration, which places 55 percent value on the structural condition of the bridge, 30 percent on its serviceability and obsolescence, and 15 percent on its essentiality to public use. According to the Iowa Department of Transportation, “a structurally deficient bridge, when left open to traffic, typically requires significant maintenance and repair to remain in service and eventual rehabilitation or replacement to address deficiencies.”

The category Functionally Obsolete is a status used to describe a bridge that is no longer by design functionally adequate for its task. Reasons for this status include that the bridge doesn't have enough lanes to accommodate the traffic flow, it may be a drawbridge on a congested highway, or it may not have space for emergency shoulders, according to the National Bridge Invencaution
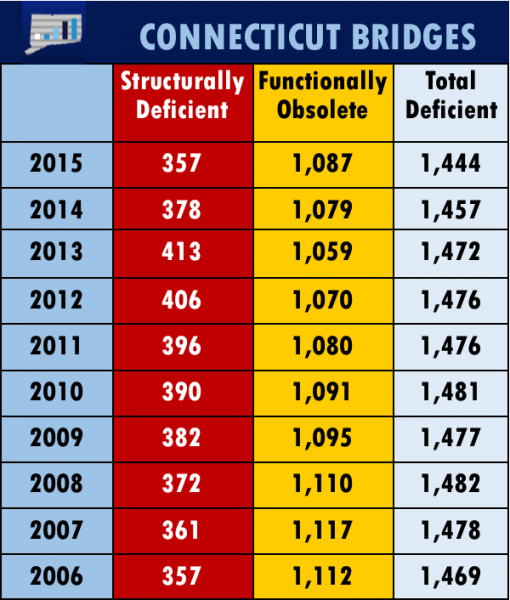
tory Database. Functionally Obsolete does not communicate anything of a structural nature – it may be perfectly safe and structurally sound, but may be the source of traffic jams or may not have a high enough clearance to allow an oversized vehicle.

A year ago, Connecticut has 378 structurally deficient bridges and 1,079 considered functionally obsolete. Two years ago, 413 bridges were defined as structurally deficient and 1,059 were listed as functionally obsolete.

A January 2016 report by the American Road & Transportation Builders Association compiled the most traveled U.S. Structurally Deficient Bridges, and identified the West River Bridge in New Haven, built in 1957, ranked as the 98th most travelled structurally deficient in the nation.  At number 110 on the list was the Yankee Doodle Bridge in Fairfield, also constructed in 1957. At number 148 was the I-95 bridge over the Wepawaug River, south of Route 121 in New Haven, built in 1958.

Also ranking in the nation’s top 200 most travelled structurally deficient bridges were the I-95 bridge in Fairfield over Route 33 at Exit 17 (ranked number 159), the I-91 Bridge over North Front Street and Quinn River in New Haven just north of I-95 (number 160), and the I-95 bridge over Byram River in Fairfield (number 161).  Those bridges were built in 1957, 1964 and 1958, respectively.

bridges by state

Safety Gap: Parents Impose Rules on Teen Drivers, Teens Don’t Think So

Teen drivers are at the highest risk for crashes and crash-related fatalities, and are particularly vulnerable to distractions while driving.  The results of a new nationwide survey of teens and their parents suggest a considerable disconnect between the limitations parents believe they are imposing on driving and the use of cell phones, and their teens’ view of limitations imposed by their parents. The gap in numerous instances is wide, and has raised concerns about the resulting risks to teen drivers.

In families where parents reported limitations on their teen drivers – such as restricting cell phone use, number of teen passengers and driving times and locations – teens themselves sometimes said they did not have those limitations, according to the C.S. Mott Children’s Hospital National Poll on Children’s Health, which indicated that parents play a key role in promoting the safety of their teens by setting expectations for driving.teen drive limits

“We found that the great majority of parents do have rules for their teen drivers; however, teens consistently perceive fewer limits on their driving than what their parents report. This signals an opportunity for parents and teens to have more conversations about safe driving habits,” says lead author Michelle L. Macy, M.D., M.S., an emergency medicine physician at the University of Michigan’s C.S. Mott Children’s Hospital.

Parents of teens 13-18 years old and teens themselves were asked about limits placed on driving circumstances that can increase a teen driver’s risk of a crash. About nine in 10 parents report they place at least one limit on their teen drivers while eight out of 10 teens report having at least one driving limit placed on them by their parents.

Among parents and teens who both responded, teens consistently say they have fewer limits on their driving than were reported by their parents.  Overall, 81 percent of teens report having at least one driving limit placed on them by their parents. In families where parents report limits on cell phone use, 13 percent of teens say they have no limits. In families where parents report limits on passengers or driving times/locations, 20 percent of teens say they have no such limits.logo

Limits on cell phone use and texting while driving are most commonly reported by parents and their teens. Fewer limits are set on passengers and driving times/locations. As many as one-quarter of parents report placing no limits on teen passengers or nighttime or highway driving, suggesting opportunities to increase teen driver safety by encouraging parents to place limits on these high-risk driving conditions, officials indicated.  Among the key limitations parents impose, according to the survey:

Limits on cell phone use include:quote

  • requiring teens to park to use their cell phones (86%)
  • forbidding texting while driving (73%)
  • having cell phone turned off or put away (62%)

Limits on passengers include:

  • allowing only 1-2 friends in the car (59%)
  • allowing only certain friends (54%)
  • no teen passengers allowed (40%)

Limits on driving times/locations include:

  • no driving after 10 p.m. (61%)
  • driving only to/from school, work, or activities (57%)
  • no highway driving (36%)

Parents who judge their teens’ driving ability as “above average” (32% of all parents) are less likely to place limits on passengers and driving times/locations. Sixty-seven percent of parents set limits on passengers for their “above-average” teen drivers, compared with 81percent of parents who perceive their teen drivers as “below average.” Similarly, 69 percent of parents set limits on driving times/locations for their above-average teen drivers, compared with 85 parents of parents who perceive their teen as below average. In contrast, parents do not adjust their restrictions on cell phone use in relation to their teens’ driving ability.

There was greater agreement between parents and teens on limits placed on cell phones than on passengers or driving times/locations, according to the national survey, conducted in September 2015 and released earlier this year.

“This may indicate that parents communicate to their teens more clearly their expectations around cell phone use while driving than for other driving situations. It is also possible that parents and teens have greater awareness of the risks of using cell phones while driving, due to media attention on cell phone distractions as a common cause of crashes,” the survey analysis points out.

The analysis also indicated that the higher degree of disagreement between teens and parents in relation to the limits set for passengers and driving times/locations suggests the need for more dialogue in families to ensure rules and expectations around driving are understood. Written parent-teen driving agreements are one way for parents to clearly communicate rules and expectations, officials indicated.

Connecticut’s Tim Hollister, author of two books about parenting and safe teen driving and the website From Reid’s Dad, recently developed a video for parents, with financial support from the Travelers, which underscores the influence of parents in teen driving.  Hollister will be speaking on the subject at the Easton Public Library on February 10 and the Newington Public Library on February 24.  Hollister, whose son Reid died as a result of a car accident at age 17, will share information parents should know regarding teen driving and discuss his most recent book, His Father Still.

https://youtu.be/QmCJKvyXhEQ

https://youtu.be/wccN8aqOWA4


CT Ranks 20th in Dependence on Gun Industry, But 3rd in Firearms Output, 2nd in Industry Wages

Connecticut’s place in the ongoing national debate about guns is reflected in a new analysis which ranks the state 20th in the nation in overall dependence on the gun industry, but also ranks the state 3rd in total firearms industry output per capita and 2nd in highest average wages & benefits in the firearms industry. Picture8
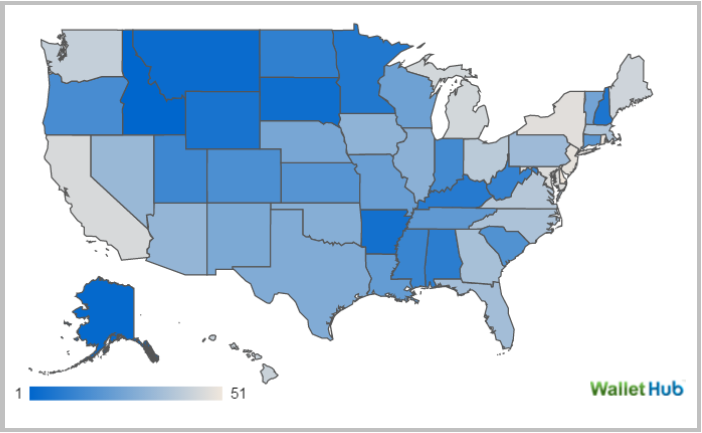
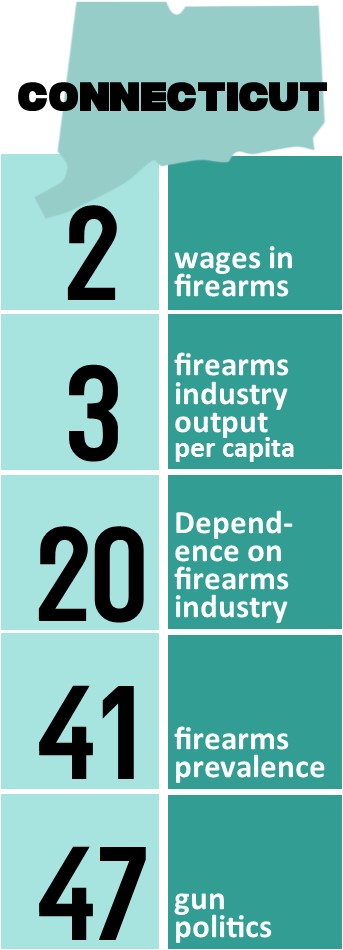
With the gun debate center-stage in the presidential primaries and in Washington, D.C., the website WalletHub analyzed which states depend most on the arms and ammunitions industry both directly for jobs and political contributions and indirectly through firearm ownership. WalletHub’s analysts compared the 50 states and the District of Columbia across three key dimensions: 1) Firearms Industry, 2) Gun Prevalence and 3) Gun Politics and eight metrics.

Connecticut also came in 41st in its "firearms prevalence rank" and 47th in "gun politics rank."

The states Most Dependent on the Gun Industry were Idaho, Alaska, Montana, South Dakota, Arkansas, Wyoming, New Hampshire, Minnesota, Kentucky and Alabama.gun stat chart

Officials point out that the gun industry plays an important role in the U.S. economy, and Connecticut is no exception. By one estimate, firearms and ammunitions contributed a total of nearly $43 billion to the national economy in 2014. That figure accounts for more than 263,000 jobs that paid $13.7 billion in total wages, according to the report from the Connecticut-based National Shooting Sports Foundation. In the same year, federal and state governments collected from the industry more than $5.79 billion in business taxes, plus an additional $863.7 million in federal excise duties, the WalletHub report indicated.

In the overall rankings, the states determined to be least dependent on the gun industry are Maryland, New York, New Jersey, Rhode Island and Delaware.

The analysis also found:

  • The number of firearms-industry jobs per capita is highest in New Hampshire, which is seven times greater than in the District of Columbia, where it is lowest.
  • The average wages & benefits in the firearms industry is highest in the District of Columbia, which is three times greater than in New Mexico, where it is lowest.
  • The total firearms industry output per capita is highest in New Hampshire, which is 18 times greater than in Hawaii, where it is lowest.
  • The total taxes paid by the firearms industry per capita is highest in Montana, which is six times greater than in Delaware, where it is lowest.
  • Gun ownership is highest in Alaska, which is 12 times greater than in Delaware, where it is lowest.

The eight relevant metrics utilized in the analysis and their corresponding weights were as follows:map

Firearms Industry – Total Points: 35

  • Number of Firearms-Industry Jobs per 10,000 Residents: (~14 Points)
  • Average Wages & Benefits in the Firearms Industry: (~7 Points)
  • Total Firearms Industry Output per Capita: (~7 Points)
  • Total Taxes Paid by the Firearms Industry per Capita: (~7 Points)

Gun Prevalence – Total Points: 35

  • Gun Ownership: (~17.5 Points)
  • Gun Sales per 1,000 Residents (approximated by using National Instant Criminal Background Check System data): (~17.5 Points)

Gun Politics – Total Points: 30

  • Gun-Control Contributions to Congressional Members per 100,000 Residents: (~15 Points)
  • Gun-Rights Contributions to Congressional Members per 100,000 Residents: (~15 Points)

Data used to create these rankings were collected from the U.S. Census Bureau, the National Shooting Sports Foundation, the Federal Bureau of Investigation, the BMJ Publishing Group and the Center for Responsive Politics, according to WalletHub.

Bullying Is Parents Top Concern, Depression Next

Across the country, parents with children under age 18 are most concerned about their child being bullied, with 6 in 10 expressing that concern.  The next most prevalent concern – expressed by a majority of those surveyed by the Pew Research Center – is that their child will struggle with anxiety or depression.  Fifty-four percent have that concern. Noting that comprehensive statistics on bullying are difficult to obtain, Pew referenced the 2013 Youth Risk Behavior Study (which covered only high-school students) finding that 19.6 percent had been bullied on school property in the previous 12 months, and 14.8 percent had been electronically bullied. In both cases, white teens and female teens were more likely to say they’d been bullied.FT_16.01.05_parentalConcerns

Connecticut’s statistics were higher than the national average in both categories.

In the 2012-13 school year, there were more than 1,400 incidents which an investigation was conducted and active bullying was concluded to have occurred, according to the state Department of Education.  The most recent data posted on the department’s website indicates that “21.9% of Connecticut students had been bullied on school property. Nationwide, the rate is 19.6%. In Connecticut, the prevalence of having been bullied on school property is significantly higher among females (26.1%) than among males (17.9%). The prevalence of having been bullied on school property is significantly higher in grade 11 among students in CT (22.8%) than in the US (16.8%).”

The Youth Risk Behavior Study also indicated that 17.5% of Connecticut students had been electronically bullied. Nationwide, the rate is 14.8%, according to the study report.youth risk report CT

Earlier this month, the parents of a high school freshman in Westport who died last month asked the local Superintendent of Schools to investigate reports that their son may have been the target of bullying and the nature of widespread social-media comments about his death among students.

In a letter to school officials, the parents wrote: “several current Staples High School students have reported observing bullying, humiliating or inappropriate behavior by one or more peer or peers toward others, and these students report that they do not know how to respond or intervene. They feel guilty and ashamed of their inaction and passive consent to the blatant behaviors. This is a critical area needed to stop these types of malevolent behaviors.”

Published reports indicate that police have found no evidence of bullying in the student's death.

The likelihood of their child facing anxiety and depression is also of great concern to parents, ranked second-highest in the survey.  About one-in-ten adolescents, or around 2.6 million, have experienced major depression in the past year, according to 2013 data reported by National Institute of Mental Health, the Pew report indicated; for 7.7 percent, their depression caused severe impairment.

Depression was three times as common among teen girls as teen boys (16.2% versus 5.3%). Available data suggest that a quarter of teens have experienced some sort of anxiety disorder (such as phobias, panic disorder or post-traumatic stress disorder) at some point in their lives, according to the National Institute of Mental Health.

The nationwide survey by the Pew Research Center survey also found that the nature of parental concerns varies considerably across demographic groups.  The research found, for example that:

  • low-income parents are more concerned about teen pregnancy and their kids getting in trouble with the law than are higher-income parents.
  • Black parents are more likely than white parents to worry about their children being shot, while white parents are more likely than black parents to worry tFT_15.12.21_parentalConcerns_shoot
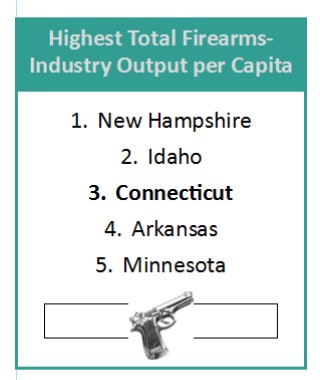
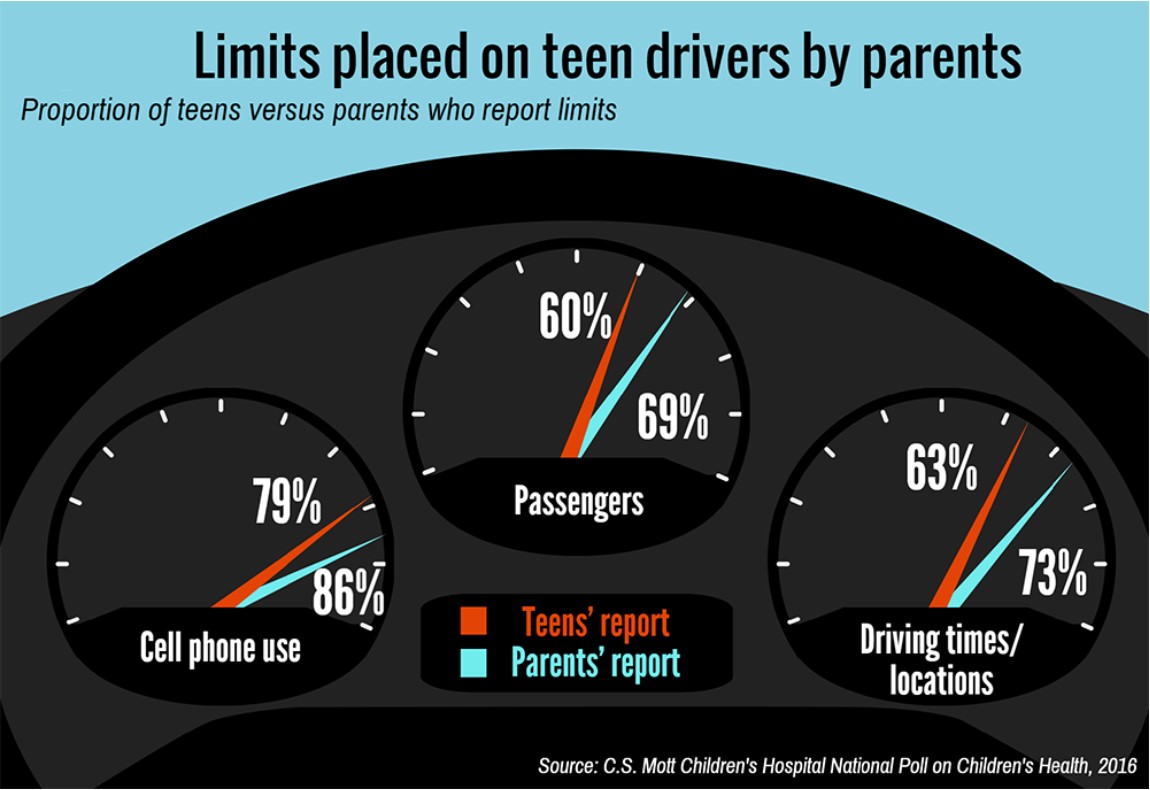
hat their children will struggle with anxiety or depression.
  • Hispanic parents worry more than black or white parents in all eight areas of concern, from being bullied to having problems with drugs or alcohol

Pew Research Center points out that in 2014, the rate of firearm deaths for black youths was 4.26 per 100,000, almost three times the rate for white youths and nearly four times the rate for Hispanic youths. Hospital emergency departments, from which the Centers for Disease Control and Prevention gathers its injury data, don’t always obtain information on race and ethnicity for their patients, the report noted. But based on the 80 percent or so of nonfatal firearm injury cases involving juveniles in 2013 for which race and ethnicity data are available, the disparity among different subpopulations was stark: 1.68 per 100,000 for white youths, 5.3 per 100,000 for Hispanic youths and 24.67 per 100,000 for black youths, the Pew report indicated.

The report also indicated that every state in the nation, as well as the District of Columbia, has a lower teen birthrate than it did in the early 1990s. The birthrate for 15- to 19-year-olds (the metric tracked by federal researchers) has been dropping for decades, Pew pointed out, and hit a record low in 2014. There were just 24.2 births per 1,000 teen females that year, compared with 61.8 per 1,000 in 1991 and 41.5 as recently as 2007.