For the month of October, there was a 3.6 percent year-over-year increase in passengers at Bradley International Airport, the strongest month thi syear, resulting in an overall 1.1 percent increase over the first ten months of the year, compared with 2014. Save for a slight dip in July and August (and a minimal drop in February) – compared to record numbers in the summer months a year ago – Bradley continues to see steady year-over-year increases in passenger traffic.
The October uptick follows September’s 1.2 percent a percent increase, reflecting increases in passenger traffic in and out of Bradley during seven of the first ten months of the year, compared with a year ago. 
Bradley saw 17,000 fewer passengers in August 2015 compared with the previous August, after a drop of 5,142 passengers in July as compared with July a year ago. The numbers are included in the minutes of the Connecticut Airport Authority, which oversees Connecticut’s airports including Bradley, the region’s second largest airport after Boston’s Logan Airport.
Since then however, the steady growth has resumed. From January through March, the passenger numbers at Bradley reflected a slight increase of 1.4 percent over the same period in 2014. If the September and October growth continues in November and December, the airport’s passenger traffic is expected to once again exceed the previous year.
At New England’s other major airports, Logan Airport in Boston showed a passenger increase of 3.8 percent in the first quarter of 2015 above the same period the previous year. At T.F. Green Airport in Providence, RI, passenger traffic declined by 2.3 percent in the year-over-year comparison.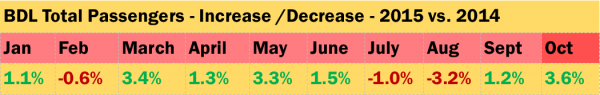
In April, passenger traffic was up 1.3 percent above 2014 levels. In May, Bradley again saw a slight uptick from May 2014, with passenger numbers increasing by 3.3 percent to 542,888. Boston’s Logan Airport was up 4.9 percent from the previous May, and Providence’s T.F. Green Airport was virtually unchanged, up by 63 passengers.
Another increase in June, 1.5 percent above the previous June, continued Bradley’s strong performance. The same was true of Logan Airport, where passenger numbers were up 5.7 percent in June 2015 as compared with the previous June.
Overall, from January to June, as compared with 2014, passenger numbers at Bradley were up 1.5 percent. Logan Airport passenger numbers were up 4.4 percent from the previous year, while T.F. Green saw a decline of 1.3 percent.
July saw a decline in passengers at Bradley in the year-over-year comparison. Bradley’s passenger numbers were down 1 percent for the month – 534,071 in July 2015 versus 539,213 the previous year. T.F. Green Airport was also down, by 1.7 percent, while Logan saw its passenger numbers higher this year than last, by a considerable 6.8 percent.
In August, passenger numbers at Bradley were down again in 2015 as compared with 2014. The decline was 3.2 percent, dropping by more than 17,000 passengers, from 538,442 to 521,000. Logan was up again, by 6 percent, while T.F. Green’s numbers were virtually identical.
Even with the decline in slight declines in February, August and July, however, Bradley still showed a narrow net gain in passengers this year when compared with the first ten months of 2014, just over one percent. Through September, the calendar year total was 4,435,206. Among the carriers at Bradley, Southwest (621.027), Delta (489,853), the merged US Air/American (356,209) and JetBlue (310,432) saw the largest number of passengers boarding flights.
Earlier this fall, CAA officials announced the return of trans-Atlantic flights from Bradley, beginning in September 2016. Bradley will be one of three new  locations in the United States to offer Aer Lingus flights to Ireland. The daily service will include one evening departure from Bradley and one afternoon departure from Dublin. Published reports indicate that the State offered a $4.5 million guarantee against losses in each of the first two years, plus $5 million in other inducements to establish the Bradley-Dublin route. The financial inducements to Aer Lingus could reach $14 million: up to $9 million in loss protection from the state Department of Economic and Community Development and $5 million from the CAA, including $3.8 million in marketing over three years and about $1.2 million in waivers of various fees at the airport over two years, reports have indicated.
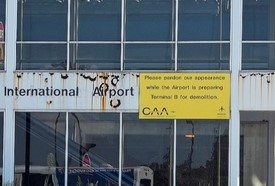 The demolition of the half-century old Terminal B is underway at Bradley, with plans for a transportation center, additional parking (for cars and planes), and free shuttle service from the airport to the train station in Windsor Locks in the planning stages.
The CAA also governs airports in Groton/New London, Danielson, Windham, Waterbury/Oxford, and Hartford/Brainard. The Authority’s November meeting was cancelled. It is next scheduled to meet on December 14. The CAA is led by a volunteer Board comprised of regional leaders in transportation, aviation, business, law, politics, economic development, and other areas of industry. The chair is Mary Ellen Jones of Glastonbury; the vice-chair is Michael T. Long of Simsbury.


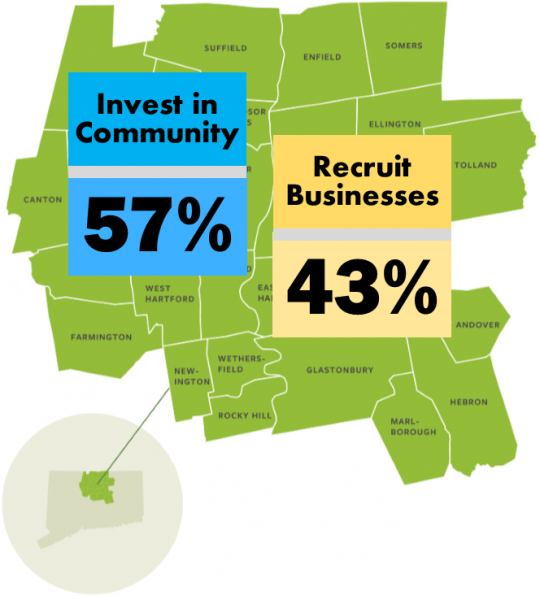 The data from the survey reflect a difference of opinion among older residents of the region. Individuals over age 46 took the opposite view from younger residents, with a majority expressing a preference for spending skewed toward recruiting companies. The reversal was dramatic, with two-thirds of those age 36-45 preferring investing in communities, by a margin of 67%-33%, and individuals age 46-55 expressing a preference for resources to be aimed at recruiting companies, with two-thirds holding the opposite view, 63%-38%.

 The issue brief indicated that a disadvantage of a distance toll system on all limited access highways in Connecticut would be that it “could create an incentive for people to use alternative roadways. The increased use of these roadways could shift the burden of maintenance and congestion to municipalities.” The advantage would be that distance tolls “could help to more efficiently allocate the cost of these roadways to drivers who use them the most.”
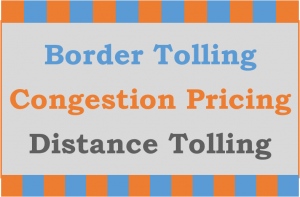 Congestion pricing, which provides for higher toll charges at peak traffic times, “helps to limit traffic on major roadways and create an incentive for people to use more environmentally friendly forms of public transportation,” the policy paper indicates. However, a congestion pricing system “could polarize roadway use by displacing low income commuters during peak driving hours. Congestion pricing could also create displacement effects whereby the increased use of local roadways could shift the burden of maintenance and congestion to municipalities.”
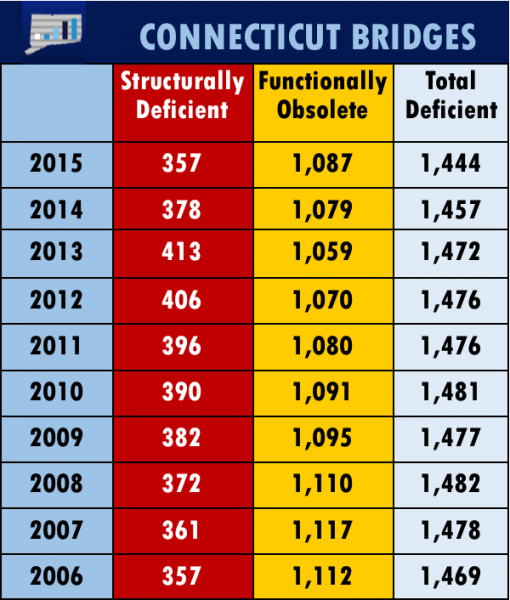
 tory Database. Functionally Obsolete does not communicate anything of a structural nature – it may be perfectly safe and structurally sound, but may be the source of traffic jams or may not have a high enough clearance to allow an oversized vehicle.
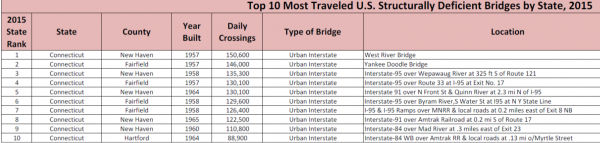
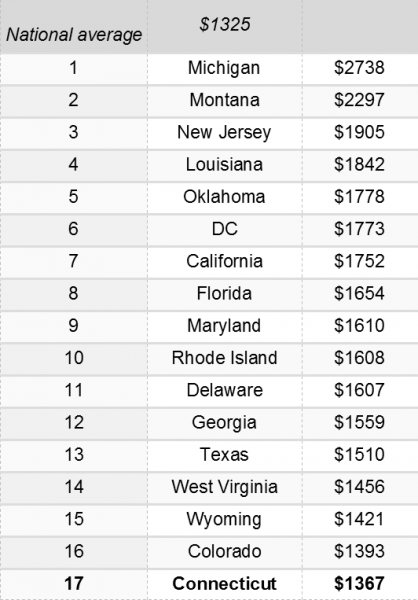
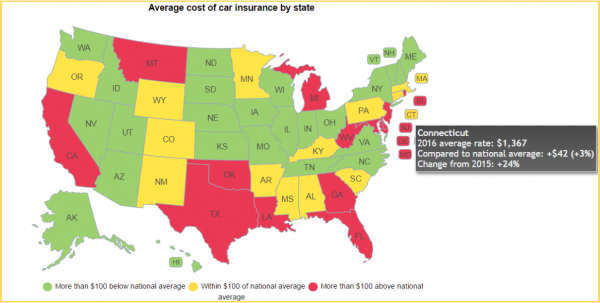 The national average for a full-coverage policy as featured in the Insure.com report came in at $1,325 this year – a slight increase from last year’s average of $1,311. Rates varied from a low of $808 a year in Maine to a budget-busting $2,738 in Michigan. Insurance rates in Michigan are more than double (107 percent) the national average.
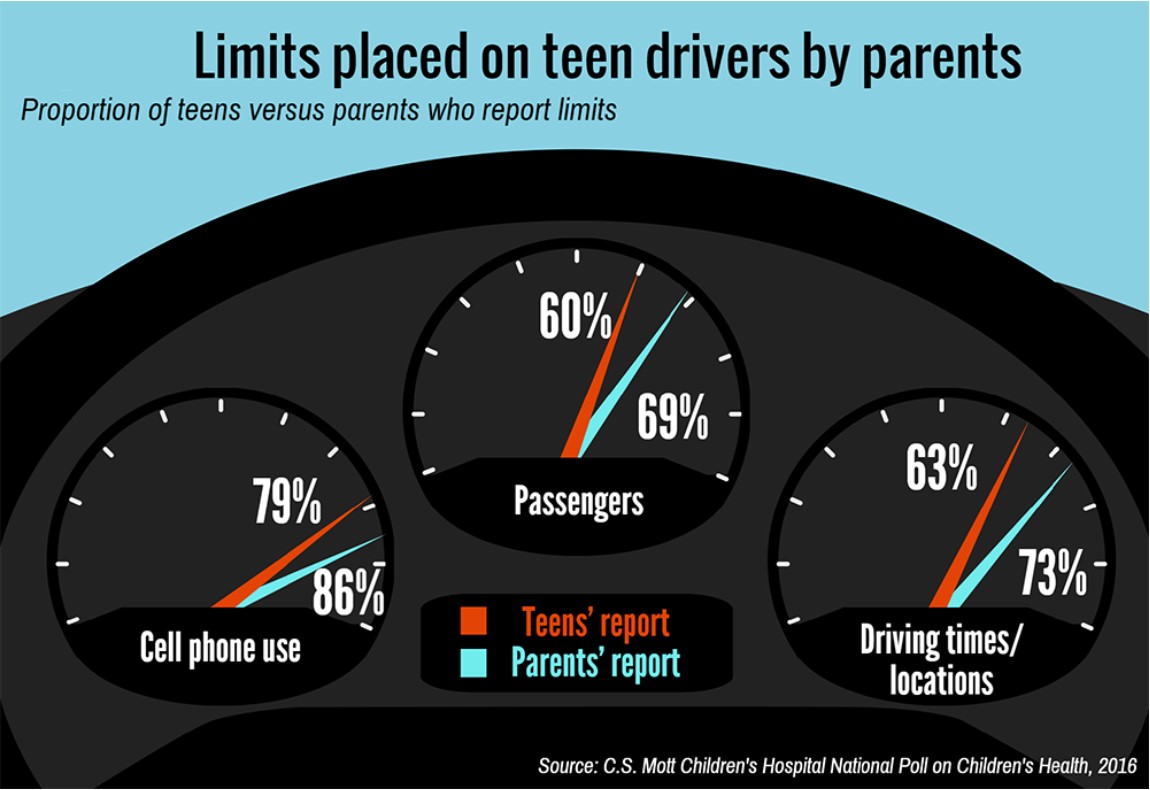
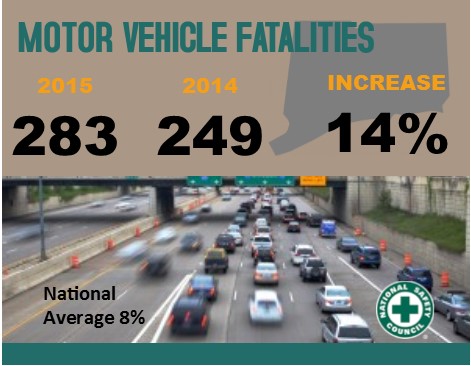 Nationally, 2015 saw the largest single-year percent increase in motor vehicle deaths since 1966. Estimates from the National Safety Council (NSC) show an 8 percent increase in 2015 compared with 2014 – with substantial changes in some states, including Connecticut. There were 283 motor-vehicle related deaths in Connecticut last year, compared with 249 in 2014 and 276 in 2013.
 safety, the National Safety Council recommends drivers:
 The OLR report also indicates that a Federal Highway Administration pilot program permits up to three states to toll existing Interstate highways that they could not otherwise adequately maintain or improve, and increase funding available for public transportation initiatives. In addition, $2.6 billion is provided to Amtrak’s Northeast Corridor (and $5.4 billion to other Amtrak lines) over five years. It separates the Northeast Corridor, from Boston to Washington, D.C, from other Amtrak accounts to ensure that the amounts assigned to that Corridor are used there, OLR reports.