Connecticut Ranks #30 in Nation in Native Born Residents; Louisiana #1, Nevada Has Least

Just over half of Connecticut’s residents were born here, ranking the state 30th in the nation for the percentage of population who are native born.

Data from the U.S. Census Bureau’s American Community Survey, as analyzed by AARP, indicate that 55.2 percent of Connecticut residents were born in the Constitution State.   That places Connecticut fourth30 in New England, behind Massachusetts, Maine and Rhode Island.

The top 8 states with native born residents – all above 70 percent - are Louisiana, with 78.7 percent, followed by Michigan (76.7%), Ohio (75%), Pennsylvania (73.8%), Mississippi (72%), Iowa (71.6), Wisconsin (71.5%) and Alabama (70.2%).  The Rust Belt and Deep South generally had the highest percentages of resident born and raised in the states were they still live.

The lowest percentages of native born residents were in the states of Nevada (25%), Florida (35.7%), the District of Columbia (37%), Alaska (40.4%), New Hampshire (42%)  and Colorado (42%) .  The only Western state above 60 percent was Utah, at 61.8 percent.

In the tri-state region, native New Yorkers came in at 63.6 percent (ranked #18) and New Jersey at 52.6 percent, slightly lower than Connecticut.  Just one-tenth of a percent ahead of Connecticut was Georgia, with 55.3 percent.Born-in-the-USA
Just behind Connecticut in the rankings at #31 was California, with 54.5 percent of residents born in the state, and Hawaii, at 54.2 percent.

In thirteen states and Washington, D.C. – mostly in the West but also including Delaware (44.9%) and New Hampshire (42%) - less than half of residents are native sons and daughters.

1.       Louisiana78.7%

2.       Michigan 76.7%

3.       Ohio 75.0% 4.       Pennsylvania 73.8%

5.       Mississippi 72%

6.       Iowa 71.6%

7.       Wisconsin 71.5%

8.       Alabama 70.2%

9.       West Virginia 69.6%

10.   Kentucky 69.8%

11.   Indiana 68.4%

12.   Illinois 66.9%

13.   North Dakota 66.9%

14.   Missouri 66.6%

15.   Maine 65.2%

16.   Nebraska 65.1%

17.   South Dakota 64.4%

18.   New York 63.6%

19.   Massachusetts 63%

20.   Utah 61.8%

21.   Arkansas 61.5%

22.   Tennessee 61.4%

23.   Oklahoma 60.9%

24.   Texas 60.6%

25.   Kansas 59.4%

26.   Rhode Island 58.1%

27.   North Carolina 58%

28.   South Carolina 58.25

29.   Georgia 55.3%

30.   Connecticut 55.2%

31.   California 54.4%

32.   Hawaii 54.2%

 

Women Aren’t Leading Nation's Top Art Museums; Connecticut Fares Better

When the Wadsworth Atheneum, America’s oldest public art museum, hired Susan Lubowsky Talbott as Executive Director in 2008, she was described by the museum’s board chair as “the absolute best person on the face of this planet to lead the way.”

Talbott, who will be marking six years at the helm of the state’s leading art museum, came to the state after three years as the director of Smithsonian Arts at the Smithsonian Institution in Washington.  Previously, she was director and C.E.O. of the Des Moines Art Center from 1998 to 2005, where she formed partnerships with more than 100 community organizations and is credited with doubling museum attendance during her first two years.

Having a woman at the helm of a leading art museum is more the exception than the rule, according to a report by the Association of Art Museums Directors, a professional organization, The New York Times reported recently.   The organization indicated that women run jut a quarter of the biggest art museums in the United States and Canada, and earn a third less than their male counterparts.

The report also noted that “strides mamuseum leadersde by women at small and midsize museums” (often university or contemporary art institutions) where women hold nearly half of the directorships and earn on a par with men.  Just five of the 33 most prominent art museums are led by women.

Amy Meyers is Director of the Yale Center for British Art.  The Yale Center for British Art is a public art museum and research institute for the study of British art and culture. Presented to Yale University by Paul Mellon (Yale College, Class of 1929), the Center houses the largest collection of British art outside the United Kingdom.  Meyers has served since 2002. A Yale alumna (she earned a Ph.D. in American studies in 1985), Meyers was previously curator of American art at the Henry E. Huntington Library, Art Collections and Botanical Gardens in San Marino, California.

As director of the Yale Center for British Art, Meyers has worked to strengthen the museum's role as a leading research and educational institute in the history of arts, while continuing its active exhibitions program. She has reached out to students, faculty and scholars to involve them in the life of the center and created a Preservation Committee to oversee conservation of the current museum site.atheneum

As for the other leading museums in the state, it’s reigning men.

The New Britain Museum of American Art, founded in 1903, was the first institution in this country devoted to collecting and exhibiting American art. The Museum’s collection comprises more than five thousand works and is constantly expanding in an effort to reflect our ever-evolving culture.  Leading the effort is director is Douglas Hyland.  Hyland arrived in 1999 from the San Antonio Museum, where he was director.  In a 2009 article, Connecticut magazine reported that “in the 10 years since his arrival, Hyland has doubled its collection to 10,000 objects. He has also doubled its full-time staff, from 12 to 24, doubled the number of docents, to 100, and more than doubled museum membership, from 1,200 to 3,500.”

The director of the Florence Griswold Museum in Old Lyme, the home of American Impressionism, is Jeff Anderson. Peter C. Sutton is Executive Director and Chief Executive Officer of the Bruce Museum in Greenwich.  Bruce Museum offers a changing array of exhibitions and educational programs that promote the understanding and appreciation of art and science.  The Lyman Allyn Art Museum in New London interim Director is James Eckerle. LAAM is the only museum in Southeastern Connecticut to offer a comprehensive collection of European art as well as American fine and decorative art: the permanent collection is comprised of over 10,000 objects.

Although not an art museum, prominent in Connecticut’s museum roster is the Mark Twain House & Museum, where Cindy Lovell, not yet a year into her position as Executive Director, has been characterized by a focus on Twain and education in her career.  After working for years as a university professor, she became director of the Mark Twain Boyhood Home in Hannibal, Mo. Her next stop was Hartford.

The Times reported that women leading art museum with budgets of over $20 million across the country are Kimerly Rorschach, who was hired in 2012 to lead the Seattle Art Museum, Janet Carding at the Royal Ontario Museum, Karol Wight at the Corning Museum of Glass, Nathalie Bondil at the Montreal Museum of Fine Arts and Kaywin Feldman at the Minneapolis Institute of Arts.

Photos:  Susan Lubowsky Talbott (left) and Amy Meyers; Wadsworth Atheneum.

Passenger Traffic Gaining Altitude At Bradley - Gradually

Flying high?  Well, sort of.  Bradley International Airport reports an increase of 1 percent in passenger counts for 2013, including four consecutive months of growth at the end of the year.

The Connecticut Airport Authority assumed oversight of Bradley in July from the state Department of Transportation.  That effectuating Gov. Malloy’s proposal, approved by the state legislature two years ago, for a new quasi-state agency that would be more responsive to market opportunities and less grounded in the state’s bureaucratic procedures.

The numbers increased 1 percent in September, 4 percent in October, 3 percent in November, and a lofty 20 percent in December, the Hartford Business Journal reported.  The overall count of passengers getting on and off planes at Bradley was 5,421,875 in 2013, compared to 5,381,860 in 2012.

Looking slightlBradleyy farther back, in 2009 the total was 5,334,322.  The Bradley International Airport Strategic Plan for 2010-2013, prepared in 2009, anticipated 6,545,000 enplanements and deplanements in 2013 – about 125,000 more that the actual totals.  At that time, an annual average growth rate of 6.2 percent was projected.  The same report called for additional growth in passengers of 3.4 percent annually for 2013 – 2018.  The projections were provided in the InterVISTAS report, Bradley International Air Traffic Forecasts – Final Report, dated April 25, 2010.
So much for predictions.

Bradley continued its end-of-year growth pattern at the start of 2014, with passenger counts increasing 9 percent in January.  There is, however, a long way to go to achieve the numbers projected years ago, which are necessary to come within range of what’s needed to bring plans for a new terminal off the drawing boards and into construction.

Earlier this year, it was reported that if passenger counts increase as currently projected, and other conditions are realized, construction of a new Terminal B would tentatively begin in just under a decade, in 2022. The entire complex, with the additional new terminal, would be up and running by about 2024 at the earliest.  Picture2

Before that threshold is reached – which remains uncertain – plans are to proceed with roadway realignment, scheduled to start in late 2015 or early 2016, with completion in late 2017 or early 2018.  That would include a rotary to be built where the Route 20 connector, off Interstate 91 Exit 40, to the garage’s exit road, and a new access road to a newly constructed transportation center.

The elevated road in front of Terminal A just past the Sheraton would remain, then all upper level traffic would be diverted to the lower level. The elevated roadway in front of Terminal B will be demolished.

That would make space for a new ground transportation center, which is expected to have a rental car facility, about 800 public parking spaces and a transit center with curbside services for limousines, taxis, and buses.  Just about anyone driving past the old, rusting and vacant terminal eagerly anticipates its demolition, as much as the array of new services that are planned to replace it.

Frequent Gamblers Prefer Atlantic City; Connecticut Casino Customers Satisfied As Competition Grows

A new study shows that the Atlantic City casinos continue to lead the way in attracting the gamblers who visit casinos most often, but Connecticut’s casinos are not far behind.  The review of players club members at casinos throughout the mid-Atlantic region reflects an industry becoming more competitive as frequent gamblers have more choices.  The study found that

Foxwoods- table

  • the region’s biggest gamblers are playing in Atlantic City, NJ
  • frequent gamblers at Connecticut's casinos bring more than $300 to gamble
  • gamblers frequenting upstate New York casinos have the lowest daily gaming budget in the Mid-Atlantic region
  • table gamblers generally have an average gambling budget of almost twice that of slots player,
  • 35-44 year olds bring the most gambling money to the casinos.

The casino markets included in the survey were New York, New Jersey, Pennsylvania, Connecticut, Delaware, Maryland and Massachusetts.  The survey, called Casino SCORES, conducted 3,000 interviews with individuals who live in one of the states, had made at least three visits to a casino in the region during the past year, and were members of at least one players club.

The study asked gamblers their average ddaily gamlingaily gaming budget when going to casinos in the  region. Of the 43 casinos evaluated in the study, the highest daily gaming budgets were among individuals that go to the Atlantic City casinos most often, followed by Foxwoods in Connecticut and Lady Luck Casino at Nemacolin Resort in Pennsylvania.

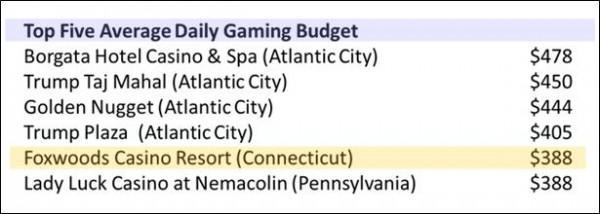
The top five average daily gaming budgets were:  Borgata Hotel Casino & Spa (Atlantic City), $478; Trump Taj Mahal (Atlantic City), $450; Golden Nugget (Atlantic City),  $444; Trump Plaza, (Atlantic City), $405; and Foxwoods Resort Casino (Connecticut), and Lady Luck Casino at Nemacolin (Pennsylvania), both at $388.  Mohegan Sun was further down the list at $324, but well above the majority of casinos.  The bottom five, all in New York, ranged from $205 down to $120 average daily individual gaming budgets.

The Average Daily Gaming Budget among those who said they play table games most often was $493, compared with $250 among those who responded that they play slots most often.

The survey also found that the 35-to-44 year old age bracket brings the most money with them to the casino they visit most often, compared with other age groups. 21 to 34 -  $334 35 to 44 - $359 45 to 64 - $308 65 and over - $288

Among those surveyed who had joined at least one casino's players club, 41 percent did so at an Atlantic City casino, 31 percent were members of Mohegan Players Club, and 25 percent joined Foxwoods Rewards.  Membership overlapped, as some individuals surveyed were members of more than one players program.

Competition To Retain, Attract Frequent Gamblers Intensifying

With Massachusetts moving forward with its  casino licensing process, the region will continue to see heightened competition in the coming years.  A new casino opened in Maryland last year, and two more are planned in the next three years.   The increasing competition is already having an impact on the revenue stream to the state in accordance with longstanding exclusivity agreements.  At the end of the fiscal year last summer, the two Connecticut casinos sent a total of $296.4 million to the state, a drop of almost $48 million from fiscal 2012.

Massachusetts’ regulators recently awarded a slot parlor license to Plainridge Racecourse which is just 20 miles from Twin River Casino in Lincoln, Rhode Island.  The Massachusetts gambling commission expects to award the license  for Western Massachusetts in May, with an MGM proposal for Springfield the only project left in the running after a Mohegan Sun proposal was defeated in a  local referendum in nearby Palmer. In addition, two proposals are competing for the license in the greater Boston region, Mohegan Sun in Revere and Wynn Resorts in Everett.

“As competition heats up, foxwoodskeeping and growing loyalty is going to be key,” said John Antonello, Managing Director of Travel and Leisure Entertainment for  Phoenix Marketing International (PMI).  “The more perks that are provided, the better.”  The trend is for loyalty programs to get “more sophisticated, so they can extend their reach,”   Antonello added.

Both Foxwoods and Mohegan Sun players club members indicated a “good level of satisfaction,” with the benefit program currently offered,” Antonello said, reflecting program elements including restaurant dining and shopping discounts, complementary hotel rooms on-site, reserved parking, VIP check-in and special gaming events.  Mohegan Sun, for example, offers three levels of benefits to cub members, Foxwoods offers five.

The data offered in the survey also includes cross-tabulations that indicate to which loyalty programs in other industries the club members at specific casinos belong  – which can provide individual casinos a road map suggesting which perks might be most attractive to their existing customers.  For example, 37 percent of Foxwoods club members are also members of Marriott Rewards, and one-third are members of airline prmohegan sunograms, such as Delta, American or JetBlue.  Those aspects of the survey are proprietary, and available to clients of Phoenix.

Antonello said that players club programs are rapidly evolving, and are reminiscent of the hotel loyalty programs of just over a decade ago, when they aggressively began adding new perks to retain customers amidst growing competition.  “Casinos are now looking for partnerships with other entertainment and travel companies as they go after a broader audience. The trend is to go beyond one industry,” he said.  Foxwoods Rewards partners program, for example, now includes discounts at businesses ranging from FTD Florist to Mystic Acquarium and the Connecticut Science Center.

Completed interviews were conducted in December 2013  in proportion to each state’s population and all counties within each state were represented.  Phoenix expects to repeat the survey later in the year.  Additional information is available at casinoscores@phoenixmi.com


14 Connecticut Mayors Will Spotlight National Service, Joining Colleagues Nationwide

Fourteen Connecticut municipal chief elected officials - 12 mayors and two first t selectmen -  will be joining colleagues from across the country on April 1 in spotlighting the impact of national service and thanking those who step up to provide voluntary service to their communities.  The nation’s mayors are increasingly turning to national service as a cost-effective strategy to address city challenges, officials say. By unleashing the power of citizens through AmeriCorps and Senior Corps, the two lead national service programs, participating individuals have a positive and lasting impact – making our communities better places to live.

The second-annual Mayors Day of Recognition for National Service will include Bridgeport’s Bill Finch, Fairfield’s Mike Tetreau, Hartford’s Pedro Segarra, Middletown’s Dan Drew, New London’s Daryl Finizio, and Wesmayor's dayt Haven’s Ed O’Brien.  Also signing on as participants in the day of recognition are Deb Hinchey of Norwich, Mark Boughton of Danbury, Hamden’s Scott Jackson, Manchester’s Leo Diana, New Haven’s Toni Harp, North Haven’s Michael Freda, Stamford’s David Martin and  Windham’s Ernie Eldridge.

On April 1, mayors will hold public events and use traditional and social media to highlight the value and impact of national service to the nation’s cities.

Officials report that more than 3,700 people of all ages and backgrounds are helping to meet local needs, strengthen communities, and increase civic engagement through national service in Connecticut. Serving at more than 600 locations throughout the state, these citizens tutor and mentor children, support veterans and military families, provide health services, restore the environment, respond to disasters, increase economic opportunity, and recruit and manage volunteers.

This year, the Corporation for National and Community Service (CNCS) will commit more than $9,390,000 to support Connecticut communities through national service initiatives. Through a unique public-private partnership, this federal investment will leverage an additional $2,720,000 in other resources to strengthen community impact, build local support, and increase return on taxpayer dollars.logo

The Corporation for National and Community Service is a federal agency that improves lives, strengthens communities, and fosters civic engagement through service and volunteering. CNCS annually engages more than five million Americans in service to meet local needs through Senior Corps, AmeriCorps, and national days of service; improves communities through the Social Innovation Fund, and leads President Obama's national call to service initiative.

Last year, 832 Mayors representing nearly 100 million citizens participated in the inaugural Mayors Day of Recognition for National Service. The initiative is being led by the Corporation for National and Community Service; Cities of Service; the National League of Cities; and Mesa, AZ, Mayor Scott Smith, President of the U.S. Conference of Mayors.

Amateur Radio, Invented in Hartford, Will Celebrate 100 Years with National Convention Here

Before smart phones, before the internet, there was Amateur Radio, better known as Ham Radio.  And it began in Hartford – spreading quickly around the world a century ago.  The province of hobbyists and enthusiasts, Ham Radio often became a lifeline when disasters struck and traditional phone lines were rendered inoperable.

Technology has surely changed, but a thriving American Radio Relay League (ARRL), the national association for Amateur Radio, will mark the 100th anniversary of its founding this summer at the Connecticut Convention Center in its birthplace, Hartford.

The organization’s Centennial Convention will be July 17-19, 2014, according to ARRL President Kay Craigi.  The theme will be: Advancing the Art and Science of Radio—Since 1914.  Ham Radio remains a popular hobby and service in which licensed Amateur Radio operators (hams) operate communications equipment.  ARRL has over 162,000 members and eCentennial_Banner_Artmploys approximately 100 people, with national headquarters in Newington.

Federal Emergency Management Agency (FEMA) Administrator W. Craig Fugate, call sign KK4INZ, will be the keynote speaker at the ARRL Centennial Banquet on July 18.

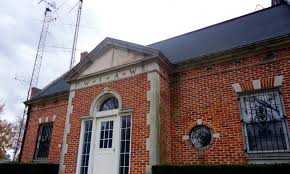
It all began in May 1914 when Hiram Percy Maxim (1869-1936), a leading Hartford inventor and industrialist, founded the American Radio Relay League (ARRL), together with Clarence Tuska, secretary of The Radio Club of Hartford.  ARRL headquarters moved to Newington in 1938 and is visited by nearly 2,000 groups and individuals each year. The site is home to The Hiram Percy Maxim Memorial Station, call sign W1AW. HAM radioARRL's mission is based on five pillars: Public Service, Advocacy, Education, Technology, and Membership.

Although Amateur Radio operators get involved for many reasons, officials say, they all have in common a basic knowledge of radio technology and operating principles, and pass an examination for the FCC license to operate on radio frequencies known as the "Amateur Bands." These bands are radio frequencies reserved by the Federal Communications Commission (FCC) for use by ham radio operators.

“The 2014 ARRL Centennial is a once-in-a-lifetime opportunity,” said ARRL Marketing Manager Bob Inderbitzen, who explained that the convention will include presentations and forums, exhibits, vendors, demonstrations, flea market, activities for youth, and a banquet.

 “We’ve also planned some very special ceARRL Newingtonntennial-themed activities,” Inderbitzen added, “including coach bus trips to ARRL headquarters and W1AW—the Hiram P. Maxim Memorial Station in nearby Newington. We want ARRL members to come with all of their experiences from the first one hundred years of Amateur Radio and ARRL, and leave with a shared vision for ARRL’s second century.”

More information about ARRL and Amateur Radio is online at www.arrl.org/what-is-ham-radio. Details on the centennial convention are available at www.ARRL2014.org.  The organization has also developed a 25 minute documentary about the history of Amateur Radio, which is available on You Tube.  Fans of the ABC Television show “Last Man Standing” may be aware that its main character, “Mike Baxter” — played by Tim Allen — is supposed to be a radio amateur, KAØXTT

Fifth Time A Charm? Vulnerable User Bill Back Before Legislature

“Study after study reveals that more people would be willing to make more trips by bike or on foot if they felt they could do so without taking their lives in their hands.”  That comment at a legislative hearing by Kelly Kennedy, Executive Director of Bike Walk Connecticut, highlights the reason behind proposed legislation that would “help hold accountable careless drives who injure or kill non-motorized users of the road.”

Dubbed the “don’t hit me” bill, it is baambulance_ck for a fifth consecutive year at the State Capitol, endorsed by an array of 23 organizations.  In each of the past two years, it passed the Senate but was not considered by the House.  It recognizes that “vulnerable road users,” such as pedestrians, bicyclists, first responders, and highway workers need additional legal protections, and provides enhanced penalties for careless driving resulting in injury or death of a vulnerable road user.

The "Vulnerable User" bill:

  • Provides for a fine of up to $1,000 for injuring or killing a vulnerable user due to careless driving; and
  • Defines a vulnerable user as a pedestrian; cyclist; animal rider or driver; highway worker; farm tractor driver; user of a skateboard, roller or inline skates; user of a wheelchair or motorized chair; or blind person and his or her service animal.

The statistics behind the effort are clear:

  • Careless drivers injure hundreds of people every year in Connecticut--130 pedestrians and cyclists were killed between 2010 and 2012 and approximately 1,400 pedestrians and cyclists are injured every year, according to Bike Walk Connecticut.  Between 2006 and 2012, there were more than 10,000 deaths or injuries.
  • The League of American Bicyclists' top recommendation for Connecticut in its Bike Friendly State Report Card calls for Connecticut to "Adopt a vulnerable road user law that increases penalties for a motorist that injures or kills a bicyclist or pedestrian."  (CT's Bike Friendly State ranking was #18 in 2013.)

Nora Duncan, State Director of the Connecticut AARP, testified in support of the bill, noting that “an older pedestrian is 61 percent more likely to die from a crash than a younger pedestrian.”  The bill, she said, “could improve pedestrian safety by deterring negligent behavior that puts vulnerable uses at risk of injury or death.”  In a survey, 47 percent of people over age 50 in Connecticut said they felt they could not safely cross main roads close to their home.

share the roadThe proposal was also supported by the State Department of Transportation, which suggested that the definition “be all encompassing to include all users such as persons on a legal non-motorized device” such as scooters and skateboards.  Transit for Connecticut, a statewide coalition of 33 business, social service, environmental, planning and civic organizations advocating the benefits of mass transit, supported a vulnerable user law indicating that “with emphasis on energy conversation and healthy lifestyles, the number of walkers and bicyclists is growing.  These residents, along with residents living in close proximity to bus stops and transit services need proper access if they want to use public transit.”

Kirsten Bechtel of the Yale School of Medicine’s Department of Pediatric Emergency Medicine, called for individuals who commit an infraction under the proposed law to “attend driver retraining and perform community service.”  In written testimony, she said that “vulnerable user laws in Oregon, Washington and Delaware include these requirements to ensure that drivers are held accountable and operate their vehicles safely in the future.”  Others, including the Tri-State Transportation Campaign, supported that idea.

Clinton resident Debbie Lundgren, in an email to the Transportation Committee, said succinctly, “pass the Vulnerable User Bill this year.  We have waited long enough!”

The  Committee is expected to consider SB 336 later this month.  If approved there, it would go on to the Senate for consideration.  A road well traveled.

Fastest Internet Download Speeds in CT? Killingworth, Storrs & Stonington Lead 26 Towns in Top U.S. 1,000

Killingworth is the Connecticut town that has the fastest internet download speed.  It is one of 26 towns and cities in the state to rank among the top 1,000 communities with the fastest internet speeds in America, according to recently compiled data.  The only other Connecticut towns to rank among the top three hundred nationwide were Storrs, Stonington, East Haddam, and Weston.   Of the state’s cities, only Stamford and Norwalk reached the top thousand fastest download speeds nationwide.

Recent data reflects that although the national average speed is 18.2 Mbps, the highs and lows – or have’s and have-nots – are quite apparent by region, with the Northeast, especially the I-95 corridor, fairing quite well.  ookla_reverse_color_800

Data from over 5,600 cities and towns represented in Ookla's Net Index, illustrated by Congressional district, shows relative download speeds across the contiguous U.S., from January through July 2013. (Blue means a faster download speed; red means a slower download speed, on the map.)  The disparities are clearly evident between different regions of the country.

The fastest internet speed in Connecticut is in Killingworth, at 30.28, ranking #179 among cities and towns across the country.  Close behind is Storrs (Mansfield) at 30.20, ranking #181.  Rounding out Connecticut’s top 10 communities with the fastest internet download speeds are Stonington (29.09, #262),  East Haddam (29.00, #269), Weston (29.88, #280), Westport (27.36, #454), Greenwich (26.14, #630), and Bloomfspeed mapield (25.99, #655), Mansfield (25.99, #656) and Guilford (25.92, #664).
Seventeen of the top 25 towns are in New York or New Jersey The fastest single location, with an average download speed of 85.5 Mbps belongs to Ephrata, Wash., a small town of 7,000 that happens to be home to its own fiber optics provider.   Kansas City, Kan., where Google developed a fiber optic network, comes in second, clocking in at 49.9 Mbps. The worst speeds can be found in Northeastern Arizona, where Chinle and Fort Defiance both clock in at less than 1.5 Mbps, according to Gizmodo, which published a report on the data.

The next ten fastest communities include the only cities to earn a spot on the top 1,000, Stamford and Norwalk.  Connecticut’s second ten are: New Canaan (25.88, #672), Redding (25.79, #691), Tolland (25.40, #734), Canton (25.36, #743), Orange (25.00, #786), Avon (24.62, #834), Torrington (24.58, #837), Darien (24.57, #839), Stamford (24.51, #851), and Norwalk (24.49, #854).

Six additional towns were among the top 1,000 nationally.  They are:  Woodstock (24.43, #865), Fairfield (24.43, #866), Mystic (24.34, #879), Milford (24.25, #894), Woodbury (24.21, #900), and Hebron (23.93, #950).  All are well above the national average.

Ookla's data are primarily coming from the site Speedtest.net.  For a complete list of cities and towns by speed click here.  The metropolitan Northeast, Florida, and most of Arizona come in pretty strong.

Reaching the next five hundred (between 1,000 and 1,500) from Connecticut were Winsted, Coventry, Bridgeport, Monroe, Groton, Southbury, Pawcatuck, Litchfield, Woodbridge, Watertown, Danbury, Brookfield, Newtown, Shelton, Stratford, Deep River and Gales Ferry, at number 1,477.  There were 43 Connecticut towns and cities  among the top 1,500 nationwide.


Connecticut Ranked 45th in Population Growth Last Year; Births Outpaced Deaths, Net Loss from Migration

Connecticut’s population is estimated to have increased by 4,315 people during the past year, ranking the state 45th in the nation in population growth , according to the U.S. Census Bureau's population estimates program.

Only New Hampshire, New Mexico, Rhode Island, and Vermont added fewer residents.  Maine and West Virginia were the only states in the U.S. to lose population, by 199 and 2,376 respectively.  Connecticut’s population drop was one-tenth of one percent.

The largest overall population gain occurred in North Dakota (3.1 percent), the District of Columbia (2.1 percent), Utah (1.6 percent), Colorado and Texas (each 1.5 percent).

The data indicate that Connecticut ranked 44th in net domestic migration, losing 17,224 residents in 2013.  States losing more residents included, Ohio, Michigan, Pennsylvania, New Jersey, California, Illinois, and New York.  On the opposite end of the spectrum, the states achieving the largest net domestic migration were Texas (113,528), Florida (91,484), North Carolina (37,240), Colorado (36,284), South Carolina (29,324) aCensus Bureau Logond Arizona (26,417).

The numbers for international migration tell a different story.  California topped the list with a net gain of 123,217, followed by New York (101,778), Florida (99,454), Texas (64,187) and New Jersey (64,197).  Connecticut was just above the middle of the pack, with a net international migration gain of 15,702, ranking sixteenth.  Considering both domestic and international migration, Connecticut's net loss from migration was 2,076 people.

Connecticut saw 37,172 births and 29,249 deaths during the year, ranking the state 34th in births but 29th in the number of deaths.

The Census Bureau computes state population estimates using multiple data sets. Population estimates by state, current as of July of each year, include birth rates, death rates and estimates of residents migrating from one state to another, Governing magazine reported.

Connecticut’s population is estimated at 3,596,080, according to the U.S. Census.

Fuel Companies, Home Contractors Top List of Consumer Complaints in 2013

Complaints about home improvement contractors, the perennial front-runner among Connecticut consumers, were eclipsed in 2013 by complaints about fuel-related companies, according to the state Department of Consumer Protection (DCP).   The two categories made up nearly one-third of all consumer complaints to the department.

The agency’s annual “Top Ten” list of consumer complaints, based on  a review of more than 6,000 written consumer complaints received in 2013, saw fuel-related complaints rise to the top for the first time.   Fuel companies were the subject of 17.5 percent of consumer complaints, while home improvement contractors caused 14.5 percent of complaints fiiled during the year.

Telemarketing, retail and Internet complaints, real estate and auto dealer complaints retained their place on the list, and some business closures also led to increased complaints in some areas, officials said.  Telemarketing continued to rank third, as it has in recent years.

consumer-complaints2The state agency received a total of 6,008 written complaints in 2013, while the number of phoned-in complaints and questions numbered in the tens of thousands.  The areas included in the ten leading causes of consumer complaints accounted for nearly 60 percent of the written complaints during the year.
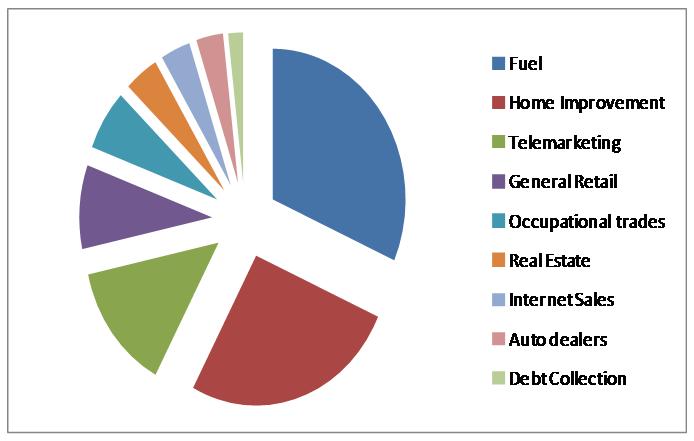
The Top Ten categories for consumer complaints received by DCP in 2013:

1. Fuel – gasoline, propane, oil  (17.5% of all complaints) –  The sudden closure of a home heating oil delivery company earlier last year helped to fuel a spike in consumer complaints involving fuel and fuel related categories. Gas pump “jumps,” bad or short firewood, gas pump signage and propane delivery were topics described in consumers’ complaints last year.  The agency is proposing legislation this year to further improve consumer protections under pre-paid fuel contracts.

2. Home improvement/New home (14.5%) – Up slightly from 2012, complaints about home improvement contractors and new home builders are common and typically involve issues such as unfinished work, improper contracts, damage to home or property, shoddy materials, non-return of deposit.  Contractors should be registered with the Department of Consumer Protection and consumer contracts should indicate that consumers have three business days to cancel the contract.

3. Telemarketing (7.6%) – This category often includes complaints about some entities not currently covered by the Do Not Call law, and includes complaints about numerous businesses flouting the Do Not Call law. Where a number can be traced to a Connecticut business, the Department enforces the Do Not Call law. However, non-traceable numbers, out of state and out of country numbers are provided to the Federal Trade Commission for enforcement.  consumer complaint chart

 4. General retail (5%) – These complaints involve bricks and mortar stores, and generally include problems with refunds, exchanges, warranties, rebates, advertising, or service.

5. Occupational trades (3.6%) – DCP investigates complaints related to the occupations that it regulates, including work performed by tradespersons such as plumbers, electricians, home inspectors, well drillers, heating and cooling contractors, and others.

 6. Real estate (3.3%) – DCP licenses and regulates real estate salespersons, brokers and appraisers, and it also responds to consumer complaints about contract errors, misleading advertising, buyer/seller agreement violations, alleged fraud, and property valuation.

7. Restaurant (2.3%) – In 2013, closures led to a spike in restaurant complaints which is not usually a major category of consumer complaints. A major wedding reception facility in the Hartford area closed, leaving brides-to-be without their deposits or a venue for their reception. Smaller restaurant closings and consumers’ subsequent loss of gift card value also contributed to a higher than normal complaint tally in 2013.CT DCP Logo

8. Internet Sales (2%) –  Problems in this category include include non-delivery of items or overcharges, companies that engage in repeat billings, unauthorized charges or ACH withdrawals, or that do not respond to “opt out” requests from consumers.

9. Auto Dealer  (1.8%) –  Issues include non-delivery of ordered vehicles, over-charges, warranties, rebates, advertising, or aggressive sales tactics.

10. Debt collection (less than 1%) –  Consumers report harassing behavior on the part of debt collectors. Sometimes consumers complain that they will not pay the debt for a service or product that doesn’t work.  Anyone who has a problem with something that they owe payments on must complain to the original seller about the problem, not to the debt collection agency, officials advised. Debt collectors are not allowed to be abusive, nor threaten any action that they cannot or will not reasonably undertake. Consumers have the right to dispute a debt in writing.