CT Businesses Expect More Hiring During 2nd Quarter, Survey Says

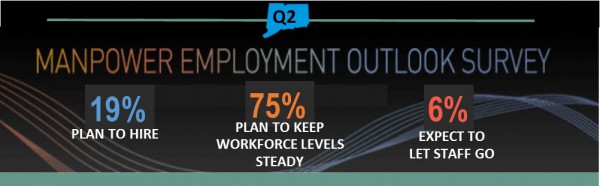
Employers in Connecticut expect to hire at a respectable pace during the second quarter of 2016, which began on April 1, according to the Manpower Employment Outlook Survey. From April to June, 19 percent of the companies interviewed plan to hire more employees, while 6 percent expect to reduce their payrolls. Another 75 percent expect to maintain their current workforce levels. This yields a Net Employment Outlook of 13 percent, according to the Survey.

“Hiring intentions are stronger compared to Q1 2016 when the Net Employment Outlook was 8 percent,” said Manpower spokesperson Becca Dernberger. “The hiring pace is expected to slow down compared to one year ago when the Net Employment Outlook was 19 percent.”
Q2CTFor the quarter just underway, job prospects appear best in Construction, Durable Goods Manufacturing, Transportation & Utilities, Wholesale & Retail Trade, Information, Financial Activities, Professional & Business Services, Education & Health Services, Leisure & Hospitality and Other Services. Employers in Nondurable Goods Manufacturing plan to reduce staffing levels, while hiring in Government is expected to remain unchanged, according to the projections.

Plans for potentially massive state employee layoffs, now anticipated in the coming weeks, had not been announced when the survey was conducted.

In the Northeast, the expectations are somewhat better than in Connecticut, as 21 percent  of employers surveyed plan to increase staff levels during Quarter 2 2016 while 4 percent expect a decrease in payrolls, resulting in a Net Employment Outlook of +17 percent.

Among Connecticut’s largest municipalities, the net employment outlook for Q2 includes 14 percent in Bridgeport, 13 percent in Hartford and 11percent in New Haven.  Survey results were developed for the 100 largest Metropolitan Statistical Areas, based on business establishment count.  Leading the list were Charlotte and Omaha at 29 percent, followed by Albany and Boise City and 28 percent, Dallas and Providence and 27 percent, and Phoenix and Toledo at 26 percent.

The Net Employment Outlook is derived by taking the percentage of employers anticipating an increase in hiring activity and subtracting from this the percentage of employers expecting a decrease in hiring activity.hiring_now

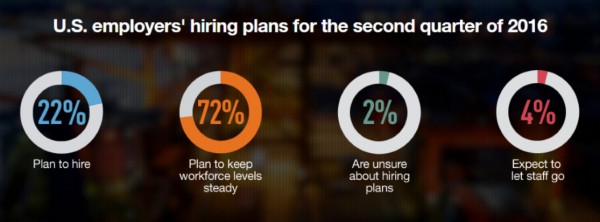
Of the more than 11,000 employers surveyed in the United States, 22 percent expect to add to their workforces, and 4 percent expect a decline in their payrolls during Quarter 2 2016. Seventy-two percent of employers anticipate making no change to staff levels, and the remaining 2 percent of employers are undecided about their hiring plans. When seasonal variations are removed from the data, the Net Employment Outlook is +16 percent, relatively stable compared to the Quarter 1 2016 Outlook, +17 percent.

The Manpower Employment Outlook Survey is conducted quarterly to measure employers’ intentions to increase or decrease the number of employees in their workforces during the next quarter. The weakest outlook for 2016 Q2 are projected in Youngstown, Akron, Baton Rouge, and Las Vegas.

“The U.S. labor market is strong compared to the global situation, with the economy still generating a sufficient number of jobs to keep the unemployment rate down,” said Kip Wright, Senior Vice President, Manpower North America. “However, we now live in a world of ‘certain uncertainty,’ where increased volatility may be here to stay. As a result, organizations and individuals need to be more agile in order to better adapt to this rapidly evolving environment, and a key differentiator to success is attracting and developing the right skills.”
US outlook

PERSPECTIVE: Survey Data; Not What It Used to Be

by Michelle Riordan-Nold In public debate, I increasingly hear the phrase: data-driven decision making. At CTData part of our core mission includes advocating for the public availability of data to inform policymaking. But what does it really mean and what data are we talking about?

As people increasingly use data to inform business or policy decisions, the quality of that data becomes even more important. Using data responsibly is something creators and users need to take seriously. Part of this includes understanding the drawbacks of data collection methodologies.CT perspective

I recently attended the Association of Public Data Users conference where several of the speakers discussed the increasing unreliability of survey data.

As it turns out, most of what we know in social science comes from surveys of households. For example, the unemployment rate, poverty rate, rate of inflation are all collected through household surveys. Federal household surveys are used to make macroeconomic policy, they are used in indexing government benefits, and in determining tax brackets.

Surveys tell us a host of factors about people's lives, including: what people are doing in response to government programs, their level of education and employment, and how they spend their money, just to name a few. They tell us how the economy is operating and how government programs are working or not working. However, rarely do we talk about the challenges and deficiencies of survey data, yet we rely very heavily on this data for decision making.

quote 2Surveys as an instrument for collecting reliable data are deteriorating. Over time, as Bruce Meyer, the McCormick Foundation Professor at Chicago Harris, notes, people are "less willing to participate in surveys, less willing to answer the questions, and when providing answers people are less likely to give accurate answers than they did in past. People are over surveyed." Frankly, the allure of being surveyed and giving your opinion is no longer a thrill.

As the saying goes, ‘a picture is worth a thousand words.' The chart below, taken from a recent paper by Meyer, shows that the non-response rate for five key national household surveys has been creeping up over the years. People are not responding that they receive government services even when they actually are the recipients of government programs.chart

But it's not just a problem of people not responding, it is also an issue that the information they provide is also quite poor. Meyer's research revealed that

"in our most used survey, that's the source of official income and poverty statistics, only about half of people receiving food stamps report it, under 40% of those receiving cash assistance report it. If you want to know who is poor you get a very bad picture from just surveys alone."

How did he figure this out? Professor Meyer linked the main household survey data to government program data (also known as administrative data). In a secure research data center, using anonymized data, he was able to look at what a recipient says in a survey to what the recipient is actually receiving.

"In surveys, the poverty rate looks much higher than what it really is; second these programs look less effective than what they are because much of the receipt is missing; in addition it looks like people who you think should be receiving these programs aren't."

What does this mean for policy?

On the one hand, it makes it look like the poor are doing much worse than they are. It also makes government programs look less effective than they are.

Meyer was involved in federal legislation that called for the establishment of a commission to look into ways that administrative data could be made more widely available to administrative agencies to determine whether programs should be expanded or contracted and to provide access to researchers both inside and outside government. The commission would be staffed by program or data experts, experts on data confidentiality and security, and with equal appointments from the House, Senate, and White House.quote 1

If these statistics were found to be so unreliable at the national level; what does it mean for Connecticut?

Relying on survey data is no longer a reliable measurement tool. It is time to look at the administrative data and examine the effectiveness of state government programs. This can be done. It should be easier with the passage last year of Public Act 15-142 that gives the Office of Policy and Management authority to link agency data and provide it to public researchers, as well as with the continued development of the P20-WIN data sharing initiative.

In order for policymakers to make 'data-driven decisions' we need to:

  1. define the outcomes desired by government programs;
  2. ensure the data are being collected to measure efficacy;
  3. analyze the data to measure the programs; and
  4. take action on the research results to ensure efficient allocation of resources.

However, this requires good administrative data that must come from those administering the programs. Let's get a commission together to ask the questions, determine the needs, and analyze the data.

With the fiscal challenges the State is facing, it's important that policymakers ensure that dollars are well spent and government programs are working. Access to better data can only lead to better government decisions.

______________________________

Michelle Riordan-Nold is Executive Director of the Connecticut Data Collaborative

PERSPECTIVE commentaries by contributing writers appear each Sunday on Connecticut by the Numbers.

LAST WEEK:  The State Budget:  What Do Demographics Have to Do With It?

Former Hometown Stamford, Public Television Launch Ken Burns' Documentary on Jackie Robinson

As the 2016 major league baseball season begins, the eyes of the nation – and his former hometown of Stamford – will once again turn to the remarkable legacy of Jackie Robinson. A new documentary by acclaimed film director Ken Burns, titled Jackie Robinson, premieres Monday, April 11 at 9 p.m. and continues Tuesday, April 12 at 9 p.m. on PBS and CPTV. To kick-off the program’s debut, the Connecticut Public Broadcasting Network (CPBN) will host a special tribute to Jackie Robinson at The Palace Theatre, Stamford on Friday, April 8 at 7 p.m. The event will include live jazz music by award-winning saxophonist Albert Rivera, and commentary and a Q&A session with ESPN commentator and former Major League Baseball player Doug Glanville.Jackie_Robinson_Title_878x494

Although not a Connecticut native, Robinson lived in Stamford for nearly 20 years, having moved to the community while a member of the Brooklyn Dodgers in 1954.  Robinson, known world-wide for breaking the color barrier in major league baseball in 1947, died of a heart attack in 1972, at age 53.

The evening will include an advance preview screening of the new two-part documentary by Ken Burns. The story of the first African American to play baseball in the major leagues features interviews with President Barack Obama, Harry Belafonte, Tom Brokaw, and others who share how Robinson’s determination and heroism influenced generations.12191994_10153655136803080_6232117043660408872_n

Upon arriving in Stamford, Robinson and his family lived with Richard Simon, co-founder of Simon and Schuster, and his wife, Andrea and their family at their North Stamford home before building a home on Cascade Road in North Stamford. The Simons’ daughter, singer/songwriter Carly Simon, recalled going with Robinson to Ebbets Field to see the Brooklyn Dodgers when she was young, the Greenwich Time recently reported.

parkStamford has a public park named in his honor, recalling that Robinson represented tolerance, educational opportunity, and the confidence that inspires personal achievement and success. A life-size bronze statue of Jackie Robinson with an engraved base bearing the words “COURAGE,” “CONFIDENCE,” AND “PERSEVERANCE” stands in the park located on West Main Street, the gateway to downtown Stamford.

Just weeks ago, Jackie Robinson’s daughter Sharon and her mother Rachel accompanied President Obama to Cuba, and joined him and the United States delegation at an exhibition baseball game.  She told mlb.com:

robinson“It brought back very personal memories of my father talking about his trip to Cuba in 1947, when the Brooklyn Dodgers trained in Havana. At the time, dad was a member of the Dodgers' farm team, the Montreal Royals. Branch Rickey arranged for him to fly to Cuba for an exhibition game, just a couple of months before he broke down baseball's color barrier in the United States. To me, this connection to my father almost brought me to tears. I was watching a baseball game in the same stadium nearly 70 years later.”

In the two-part documentary, Ken Burns “reveals fascinating stories about the legend’s life on and off the field.”  In part one, Robinson “rises from humble origins to integrate Major League Baseball, performing brilliantly despite the threats and abuse he faces on and off the field and, in the process, challenges the prejudiced notions of what a black man can achieve,” according to PBS.  In part two, Robinson” uses his fame to speak out against injustice, alienating many who had once lauded him for ‘turning the other cheek.’” After baseball, during his years in Stamford, “he seeks ways to fight inequality, but as he faces a crippling illness, he struggles to remain relevant.”

The documentary “paints the picture of a man who challenged institutional racism in the face of harsh criticism. It also delves into his close-knit relationship with his wife, Rachel, and their children through candid interviews and personal family photos.”

In 1997, Major League Baseball “universally” retired his uniform number, 42, across all major league teams; he was the first pro athlete in any sport to be so honored. Initiated for the first time on April 15, 2004, Major League Baseball has adopted a new annual tradition, “Jackie Robinson Day,” in which all players on all teams wear #42.

Of his interest in sharing Robinson’s story, director Ken Burns said, “There was so much more to say not only about Robinson’s barrier-breaking moment in 1947, but about how his upbringing shaped his intolerance for any form of discrimination and how after his baseball career, he spoke out tirelessly against racial injustice, even after his star had begun to dim.”

My dad once said, "A life is not important except in the impact it has on other lives," Sharon Robinson recently recalled.

CT Women of Innovation To Be Honored This Week

The 12th annual Women of Innovation® awards gala this week will recognize 52 women who are accomplished in science, technology, engineering, math and who are involved in their community, five college students and seven high school students who have already begun to demonstrate similar accomplishment. The annual awards event is “a time for like-minded, successful women to network and celebrate their accomplishments,” continuing a tradition led by the Connecticut Technology Council aimed at recognizing women in a range of innovative businesses, education and communities, and highlighting role models for young women looking ahead to career pursuits.

The categories include:

  • Youth Innovation and Leadership
  • Collegian Innovation and Leadership
  • Community Innovation and Leadership
  • Research Innovation and Leadership
  • Academic Innovation and Leadership
  • Entrepreneurial Innovation and Leadership
  • Small Business Innovation and Leadership
  • Large Business Innovation and Leadership

One woman in each of the eight categories will be selected as a top Woman of Innovation in her category, at the April 6 awards ceremony.

Among the nominees, in the Entrepreneurial Innovation and Leadership category, are Marcia Fournier, Founder & CEO of BioArray Therapeutics, Inc.; Gloria Kolb, CEO/Owner of Elidah, Inc.; Wendy Davis, CEO of GestVision, Inc.; Amy McCooe, Co-CEO of Level Up Village; Nicole Bucala, CEO of MIFCOR; Kelly Simpson-Angelini, CEO and Chief Strategic Officer of Simpson Heathcare Executives; Janine Darling, Founder & CEO of STASH America, LLC; and Anuja Ketan, Chief Technology Officer at Zillion Group Inc.innovationlogo

The women nominated in the Small Business Innovation and Leadership category include Melissa Casini – etouches, Norwalk, (Director of Account Management); Dina Dubey – Z-Medica, Wallingford,  (Executive VP, Corporate Development); Merrie London – Connecticut Innovations, Rocky Hill (Manager, SBIR and Federal Leveraging Programs); Jackie Mulhall – SMC Partners, Hartford (Director); Pam Perdue – Continuity Control, New Haven (Founder, EVP Regulatory Operations); and Kathleen Roberge – etouches, Norwalk (VP of Global Sales).

The full list of nominees includes individuals at some of Connecticut’s leading companies, including Sikorsky Aircraft, Frontier Communications, Hartford Hospital, Pfizer, and Pratt & Whitney. Academic institutions with Women of Innovation include the University of Connecticut, Wesleyan University, University of Bridgeport, and Yale University.

The keynote speaker for the April 6 awards program will be Congresswoman Elizabeth H. Esty, U.S. Representative for the 5th Congressional District of Connecticut. During the past 11 years, more than 500 women have been honored by Women of Innovation.

“Our state’s innovation sector recognizes the essential contributions its female engineers, scientists, programmers, physicians, mathematicians and teachers make in developing new products and services, advancing health technologies and serving as educators and role models for generations of women that follow,”said Connecticut Technology Council President and CEO Bruce Carlson. “Women of Innovation® allows us to put the spotlight on these exceptional innovators and leaders and connect them with a professional network of other women who strive for excellence.”

https://youtu.be/Uz1gQ96Yk1c

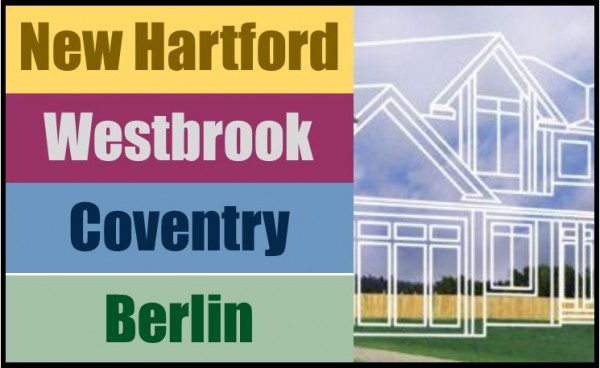
First Time Home Buyers: New Hartford, Westbrook, Coventry Most Attractive

In Connecticut, as elsewhere across the country, it is a home buyers’ market.  And that is especially prevalent in some of Connecticut’s smaller communities, and those in the central and northern parts of the state, according to an analysis by NerdWallet, a national finance website, which determined the top places for first-time homebuyers in Connecticut. The site identified the top communities for new home buyers, considering how much individuals would need to spend on a mortgage and examining the data on appreciation “to find the best locations, based on the health of the local housing market, the costs of housing, and the prosperity and safety in each community.”compare-mortgage-rates-1

“To be sure,” the website noted, “the state is not a magnet for first-time buyers based on affordability, but the places we identified stand out as being the most suitable for those looking for a foothold in the housing market.”

The top community was New Hartford, which was described as having “a population of just over 6,900, this small community was the 11th-safest among the 116 in the state we analyzed. Additionally, the select monthly ownership costs were the second-lowest among the top 10 cities, at $1,813; that’s $235 less than the median for all 116 communities.”

Runner-up was Westbrook, along the Connecticut shoreline.  Westbrook had “the second-most expensive home value among the top 10. But it also had the strongest home value growth rate among all 116 communities analyzed — a positive economic sign for homebuyers,” the website indicated.   “Although home values in many areas of the state fell between 2011 and 2014, they grew by 4.87% in Westbrook; that’s well above the median decline of 6.8% for all communities analyzed. Westbrook also had the lowest real estate tax rate among the top 10, at 1.15% of assessed value per year.

The top ten communities:home towns

  1. New Hartford
  2. Westbrook
  3. Coventry
  4. Berlin
  5. Colchester
  6. Windsor Locks
  7. Durham
  8. Ellington
  9. Marlborough
  10. Windsor

Of Coventry, the third-ranked community, the website said: “Homeowners here see median monthly ownership costs of $1,883, which is $165 less than the median of all communities analyzed. Among the top 10 locations, it takes the third-shortest amount of time to save for a down payment in Coventry (19.86 years). With a crime rating of "safe," low poverty rates and home values nearly $20,000 less than the state median, Coventry could be an ideal location for first-time homebuyers if they can find employment within commuting distance.”

The fourth-ranked town, Berlin, was cited for its population growth, “the third-highest of all 116 communities analyzed, rising 3.34% between 2011 and 2014 — much higher than the median population growth of 0.5% for all places analyzed. The median home value here as of 2014 was $286,800, slightly higher than the median of all places analyzed.”

Colchester, with a median age of 39, was described as the youngest among the to 10, and Windsor Locks, home of Bradley International Airport, was highlighted for the affordability of its homes, “the least expensive” among the top communities.

Rounding out the top twenty were South Windsor, Canton, Haddam, Suffield, Glastonbury, Burlington, Tolland, East Hampton, Southington and Lebanon.  A total of 116 communities were ranked in the analysis, with Stamford, Ansonia, Waterbury, New Haven,  and Bridgeport at the bottom of the list.  nerdwallet-logo-new

For their calculations, the website assumed a first-time homebuyer in Connecticut earns an annual income of $73,361, the 2014 state median for households headed by residents ages 25 to 44. They also assumed a personal savings rate of 4.8 percent, based on the U.S. 10-year average as measured by the Federal Reserve Bank. Assuming the homebuyers are starting with nothing in the bank, they then estimated how many years it would take to save for a 20 percent down payment

By following the Consumer Financial Protection Bureau's recommendation that homeowners shouldn't allocate more than 28% of their gross monthly income to housing costs, NerdWallet analysts determined that a first-time homebuyer in Connecticut could afford to spend $1,712 a month on ownership costs — mortgage, taxes, utilities and insurance.

CT Medical Examining Board Website Ranked 15th in US

If you’re looking for information about your doctor, you may find yourself searching the website of the state medical board.  In states across the country, those are the agencies that license physicians and also discipline them for offenses including sexual misconduct, substance abuse, and negligent care. But the accuracy and completeness of the information you find varies from state to state, according to a new analysis from Consumer Reports, which ranked the Connecticut Medical Examining Board as 15th in the nation for the information readily available to the public from the agency website.

Consumer Reports Safe Patient Project partnered with the nonprofit Informed Patient Institute to evaluate the websites of state medical boards in all 50 states. They found that most are difficult to navigate and the information on them varies widely.

consumerOverall scores were based on eight categories:  Search Capabilities, Complaint and Board Information, Identifying Doctor Information, Board Disciplinary Actions, Hospital Disciplinary Actions, Federal Disciplinary Actions, Malpractice Payouts and Convictions.


Connecticut, with an overall score of 58, was rated good in four categories, very good in two, and excellent in one category.  Only one category was given a poor rating.

The highest rated state medical board websites were in California (84), New York (79), Massachusetts (78), Illinois (76), North Carolina (76), Virginia (72), New Jersey (70), Florida (70) and Texas (68).medical examining board

The Federation of State Medical Boards, which represents the boards and facilitates communication among them, acknowledges that variation is a potential issue. “Consistency is certainly a worthy goal,” Lisa Robin, chief advocacy officer for the organization told Consumer Reports. “Looking at the disciplinary trends to make improvements in the system … we would always encourage that.” Still, she also says that, “the rate of discipline alone is probably not a good picture of really what the boards do and how well they’re able to protect patients in their state.”

But, as Consumer Reports’ analysis found, those state boards fall short in other measures, too. In fact, in many instances, physicians who have been severely disciplined continue to practice while their offenses remain relatively hidden, buried deep on the boards' websites or unavailable entirely online.

The Connecticut Medical Examining Board website includes a listing of disciplinary actions taken by the Connecticut Medical Examining Board or the Connecticut Department of Public Health but notes that “information is not intended for licensure verification purposes.”  Actions taken – ranging from reprimands to civil penalties to license suspension or revocation are listed.  Board meeting minutes are also available on the site, as well as procedures for individuals to file complaints.

states

Greater Hartford Residents Prefer Focus on Vibrant Communities Over Recruiting Businesses

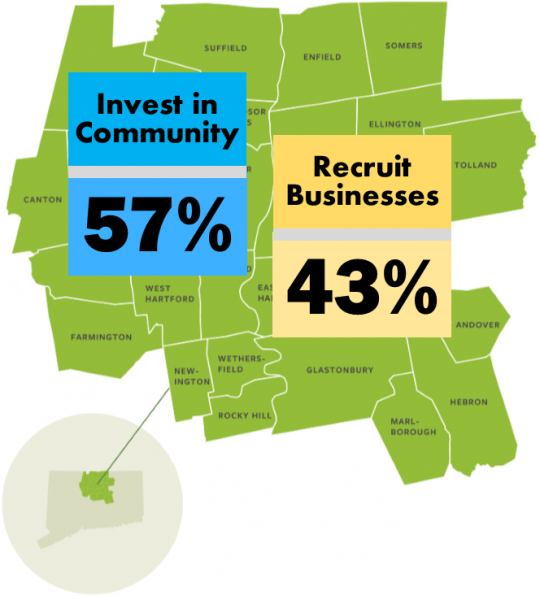
In a time of reduced resources and stark choices for policy makers, a survey of Greater Hartford residents suggests that investments aimed at creating vibrant communities, with the focus on local schools, transportation options, walkable, attractive physical environment is preferred to devoting greater resources to recruiting employers. In a survey for the Hartford Foundation for Public Giving as part of the Metro Hartford Progress Points effort, and conducted by Inform CT, residents of Hartford and Tolland County, by 57 percent to 43 percent, said that investing in communities was a better approach than recruiting businesses.HartfordFoundation

The findings reaffirm one of the key goals in the new three-year strategic plan of HFPG, launched earlier this year, developing vibrant communities.  The plan states that “All of our region’s residents should have the opportunity to live and contribute to strong, safe vibrant communities,” and calls for a “focus on people and places with the greatest need by engaging and supporting partners who promote meaningful civic engagement, safe affordable housing, quality health and mental health care and a rich diversity of cultural and other experiences to improve the quality of life.”

mapThe data from the survey reflect a difference of opinion among older residents of the region.  Individuals over age 46 took the opposite view from younger residents, with a majority expressing a preference for spending skewed toward recruiting companies.   The reversal was dramatic, with two-thirds of those age 36-45 preferring investing in communities, by a margin of 67%-33%, and individuals age 46-55 expressing a preference for resources to be aimed at recruiting companies, with two-thirds holding the opposite view, 63%-38%.


Across all age groups, a majority of homeowners preferred that the emphasis be on vibrant communities, 52%-48%, and an even larger majority of respondents who are not homeowners, 64%-36%, shared the same view.

The preference for policy to be targeted more towards assuring vibrant communities than recruiting companies was consistent across a majority of respondents of various education levels and among white, black and Hispanic residents of the region, according to the survey.  A majority of survey respondents who are currently employed full-time, as well as those working part-time, and those unemployed all expressed a preference for investing in communities rather than recruiting companies.

The Greater Hartford survey results are not inconsistent with data gathered elsewhere.  A March 2014 national survey by the American Planning Association (APA) found that Millennials and Baby Boomers want cities to focus less on recruiting new companies and more on investing in new transportation options, walkable communities, and making the area as attractive as possible. The national survey found that 65 percent of all respondents and 74 percent of millennials believe investing in schools, transportation choices and walkable areas is a better way to grow the economy than investing in recruiting companies to move to the area, according to the APA.mhppLogo

A 2013 study in Michigan, posing similar questions, brought similar results.  In the statewide survey, 64 percent of Michigan citizens said they believed the most important thing state government can do for job creation is to “provide quality education, good roads and transportation, good public services like safety, water, fire, parks and libraries that create an environment in which people want to live, work and run a business.”  This contrasts with 29 percent who said the most important thing state government can do is to “cut taxes for individuals and businesses.”

Earlier this month, at the annual Municipal Collaboration Summit organized by the Hartford Business Journal, one of the session’s was devoted to an exploration of “Building Vibrant Communities,” with observations from representatives of Connecticut Main Street Center, the Partnership for Strong Communities and the Connecticut Economic Resource Center.

The Hartford Foundation for Public Giving serves 29 towns, hundreds of nonprofits and more than 750,000 residents in the Greater Hartford region.  As Greater Hartford’s community foundation, HFPG brings together members of the community to “share information, understand local problems and put resources behind effective solutions.”Print

Developed by a group of key regional stakeholders, Metro Hartford Progress Points is a periodic 'check-up' to build greater understanding about issues facing the Greater Hartford community. The second edition of Progress Points, released late last year, takes a deeper look at key issues impacting our communities and how they are connected, with a particular focus on access to better schools, better jobs and stronger neighborhoods.  Along with the Hartford Foundation, partners include the Hispanic Health Council, MetroHartford Alliance, United Way of Central and Northeastern Connecticut, Urban League of Greater Hartford, Capitol Workforce Partners, Capitol Region Council of Governments, the Center for Urban and Global Studies at Trinity College and the City of Hartford.

The survey was conducted for the Foundation during the 4th quarter of 2015 by Inform CT.

PERSPECTIVE: The State Budget: What Do Demographics Have to Do With It?

by Alissa DeJonge A combination of factors are having a negative impact on state revenues, contributing to budget woes. The different age cohorts in Connecticut’s population tell an important story of one reason revenues are declining. State legislators need to examine Connecticut’s current and future demographics as they look to solve fiscal problems.CT perspective

Much of the daily news centers on the state budget deficit and the lengths that legislators are attempting to go to find ways to balance it. There is a projected $220 million shortfall for this fiscal year that was addressed by legislators on March 29.[1] And the projected shortfall for the next fiscal year is approaching $1 billion. quote 1

Legislators are quite aware that revenues are not coming in to the extent originally anticipated, and that this trend has been occurring for the past number of years. Indeed, Senator Beth Bye, during a March 23 conference about broadband infrastructure,[2] discussed the revenue woes and the dire situation that Connecticut is facing.

What makes this situation particularly serious is the fact that the reasons there is a ‘revenue problem’ have been long in the making, and the trend is poised to continue.

Of course, the overall state economy continues to struggle. Connecticut is one of 10 U.S. states that has not regained all the jobs lost since the last recession.[3] If jobs are sluggish, so too are revenues back to the state. And wage growth, while seeing improvements in 2015, has been relatively flat since the end of the last recession, which also keeps state revenues in a static to declining state.[4]

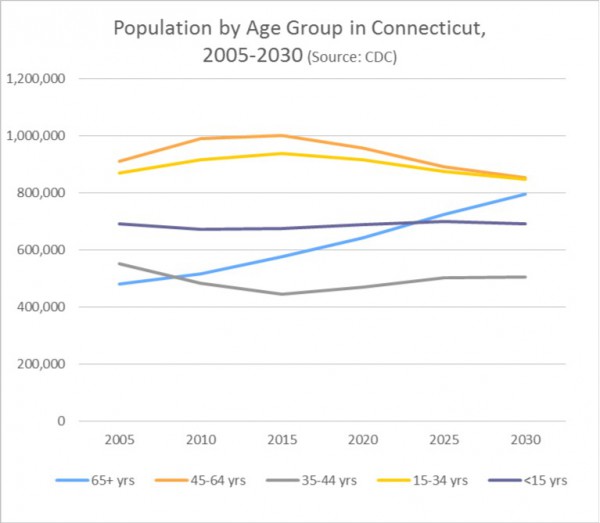
However, the lack of revenues also involves overall demographic patterns. The figure shows population by age for Connecticut between 2005 and 2015, and projections extending to 2030.

  • The age group over 65 is projected to increase 38% between 2015 and 2030. This will add much pressure to state services such as Medicaid and long term supports and services while at the same pop by age grouptime reducing revenues because this large age cohort is no longer working.
  • The Baby Boomer generation, those who are currently 45-64 years old, comprise the largest share of the state’s population. As they move from employment to retirement, the trend of increasing service needs and lessening revenues will accelerate.
  • Generation Xers will fill many Boomer jobs, but they are a much smaller group, which means that state revenues are unlikely to regain their previous higher levels because fewer people will be producing outputs.
  • The current Millennials (roughly ages 15-34 years) and the even younger Generation Z population have more people in their age groups then the Generation Xers. Therefore, demographic trends should eventually contribute to increasing state revenues. But it will be well over a decade before the Millennials begin to gain seniority and higher wages in the workforce and contribute more to the state revenues.

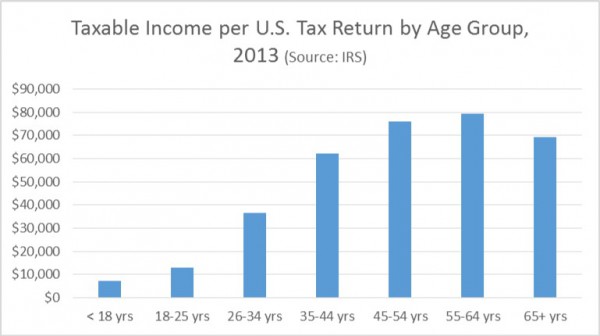
taxable incomeThis figure shows how taxable income ebbs and flows by age group. The Baby Boomers are in the best position to contribute to state revenues right now. However they are retiring in a consistent fashion, and the next younger cohort, of which there are fewer people to begin with, is earning less than their mature counterparts. This sets up a long-term issue for state revenue potential, one that will not be mitigated until the larger Millennial age cohort gets into their more profitable working years.

Revenue expectations are not what they used to be. In the 1960s, the economy consistently grew between three and five percent each year, and Americans assumed that it would continue to grow at that pace.  As a result, government was able to fund additional programs as economic and tax bases kept expanding. Today the economy is growing at only around two percent each year. This economic trend reduces the ability for the government to fund programs, and all demands cannot be met, with the current revenues coming in.[5]

If you multiply the taxable income per return by the number of people in each demographic group in both 2015 and 2030, excluding inflation, there would be a four percent decrease in the projected total amount of taxable income in the state.  This illustrates the effect of demographic trends on taxable income. Without even considering job trends, wage trends, or other long-term economic factors, the demographic shifts of the population are going to make it even more challenging for state governments to raise revenues.quote 2

The state revenue problem will not resolve itself with this legislative session, or even the next. While the current revenue problems are a combination of many factors, the demographic influence is significant and should not be overlooked because it can provide insight for decades into the future.

Since there are a number of longer term, structural issues that will continue to affect the state’s ability to raise revenues for many years, stakeholders and policymakers will have to adjust to this new economic reality. Prioritization of programs with specific intended targeted outcomes is the approach to the state budgeting process needed now.

_________________________________

Alissa DeJonge is Vice President of Research, Connecticut Economic Resource Center Inc. (CERC).

PERSPECTIVE commentaries by contributing writers appear each Sunday on Connecticut by the Numbers.

LAST WEEK: Freedom's Just Another Word For... 

_________________________________

[1] http://www.nbcconnecticut.com/news/local/Vote-on-State-Budget-Deficit-Expected-Tuesday-373779281.html (Accessed March 29, 2016)

[2] High-Speed Broadband Internet Infrastructure Informational Conference: A Toolbox for Municipalities (March 23, 2016)

[3] http://www.usnews.com/news/business/articles/2016-03-25/job-totals-trail-pre-recession-levels-in-10-us-states (Accessed March 29, 2016), from U.S. DOL calculations of jobs changes, December 2007 – February 2016.

[4] http://www.washingtontimes.com/news/2015/oct/8/comptroller-connecticut-wage-growth-continues-to-l/ (Accessed March 29, 2016)

[5] Robert Samuelson, Trump’s Wrong – We’re Hugely Well-Off (Op-Ed), The Hartford Courant, March 28, 2016.