CT Residents Are Driving Less, Reflecting National Trend

Connecticut residents have cut their per-person driving miles by 3.45 percent since 2005, while the nation’s long term driving boom appears to have ended, according to a report by the ConnPIRG Education Fund. The decline in driving is a national trend, with 46 states including Connecticut having reduced per-person driving since the middle of the last decade.

The 31-page report, “Moving Off the Road: A State-by-State Analysis of the National Decline in Driving,” is based on the most current available government data. The average number of miles driven by Americans is in its eight consecutive year of decline, led Moving Off the Road Thumbnailby declines among Millennials. Connecticut has had the slowest decline in driving in New England, but has the second lowest vehicle miles traveled per person in region, behind Rhode Island. The national trend in driving peaked in 2005.

“It’s time for policy makers to recognize that the driving boom is over. We need to reconsider expensive highway expansions and focus on alternatives such as public transportation and biking—which people increasingly use to get around,” said Abe Scarr, Director of the ConnPIRG Education Fund.

“The Millennial generation is leading the decrease in driving and will be using and paying for our transportation system for years to come.  It is critical that Connecticut plans a system that reflects how people are getting around and want to get around,” said Scarr.  The report noted that “the evidence suggests that the nation’s per-capita decline in driving cannot be dismissed as a temporary side effect of the recession.”

Earlier this year, Governor Malloy and Department of Transportation Commissioner James Redeker launched a multi-year strategic planning process, Transform CT, which aims to “improve economic growth and competitiveness, build sustainability, and provide a blueprint for a world-class transportation system.”  TransformCT_published_Cycle_Small

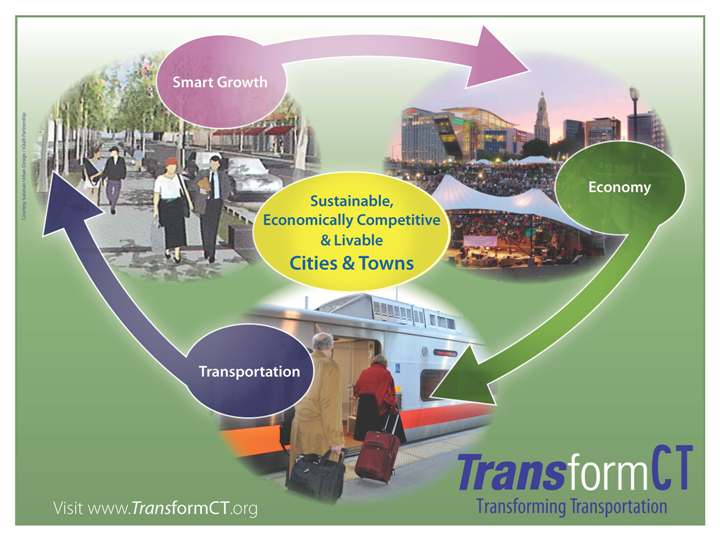
Transform CT has established an interactive website to gather public input which has collected nearly 300 comments, suggestions or ideas to date, and will be updated with topics and polls regularly as the strategic plan is developed over 18-20 months. In addition, a series of events will be held throughout the fall to engage the public on the future of transportation in Connecticut.

 “Connecticut’s investment in critical transit projects like CTfastrak and the New Haven-Springfield commuter rail line show that transportation decisions better reflect changing travel preferences of residents,” said Ryan Lynch, associate director for the Tri-State Transportation Campaign, a non-profit policy organization.

The Tri-State Transportation Camcars on hwaypaign, a 501(c)(3) non-profit organization dedicated to reducing car dependency in New York, New Jersey, and Connecticut, celebrates its 20th anniversary with a fundraising benefit in New York City on November 7.  The Campaign was formed in the early nineties as a response to the mounting economic and environmental costs of automobile and truck dependence and promising reforms in federal transportation policy. Among the organization’s board members is Norman Garrick, Director of the Center for Transportation and Urban Planning at the University of Connecticut.

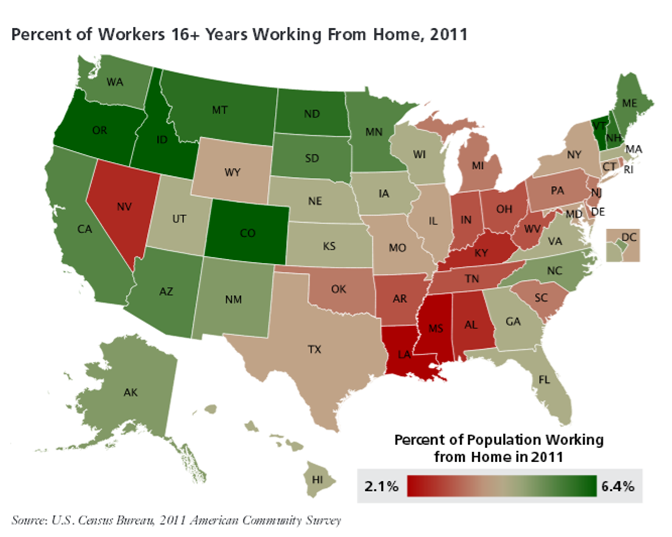
North Dakota, Nevada, Louisiana and Alabama are the only states in the nation where driving miles per capita in 2011 were above their 2004 or 2005 peaks, the ConnPIRG report found.  Meanwhile, since 2005, double-digit percent reductions occurred in a diverse group of states: Alaska, Delaware, Oregon, Georgia, Wyoming, South Carolina, the District of Columbia, Pennsylvania, Indiana and Florida.

The states with the biggest reductions in driving miles generally were not the states hit hardest by the economic downturn, according to the ConnPIRG report. The majority—almost three-quarters—of the states where per-person driving miles declined more quickly than the national average actually saw smaller increases in unemployment compared to the rest of the nation, according to the report.

Sports Statistics Conference Features Sabermetrics As Part of National, Global Focus on Influences of Stats

Connecticut-based ESPN is among the sponsors for the upcoming New England Symposium on Statistics in Sports, to be held on September 21 at Harvard University, that will include a panel discussion to feature Eric Van, sabermetric baseball operations consultant for the Boston Red Sox, Ben Baumer, who handled statistical analysis for the New York Mets from 2004 through 2012, and Vince Gennnaro, a consultant to a number of Major League Baseball teams during the past decade.

Panel moderator is Andy Andres, head coach and lead instructor of the MIT Science of Baseball program and Fenway Park datacaster/stringer for mlb.com.    Featured speakers are Jim Albert of Bowling Green State University, on “Assessing Streakiness in Home Run Hitting,” and Richard Smith, of the University of North Carolina, who will present for the first-time a statistical model for predicting the finish times of individuals who were running in the 2013 Boston Marathon but were unable to complete the race, as previously reported by Connecticut by the Numbers.

NESSISThe Symposium is a meeting of statisticians and quantitative analysts connected with sports teams, sports media, and universities to discuss common problems of interest in statistical modeling and analysis of sports data. The symposium is part of a year-long series of programs and events around the world during the International Year of Statistics.

In addition to the featured presentations, the scheduled presentations at the Sept. 21 Symposium will focus on statistical research and analysis conducted in areas including:

  • statistics-based revisions to defensive alignments in the NBA,
  • how weather affects the knuckleball,
  • whether crossing helps or hurts scoring in premier soccer, and
  • trends such as match time and game duration in professional tennis.

Co-chairs of the conference are Mark Glickman, Senior Statistician at Boston University and Scott Evans, Senior Research Scientist at Harvard.   Registration is now open for the day-long symposium.

ESPN operates a Stats & Info blog that shares with fans the information that the ESPN Stats & Information Group provides to its production teams around the company. The Stats & Info blog's content is a must-read at ESPN - on-camera talent, producers, bloggers,ESPN stats & info columnists and editors use Stats & Info insight on a daily basis. Individuals can subscribe to the blog for around-the-clock notes, stats and trends, using a blend of traditional statistics and the advanced metrics that the network describes as  the "next level."

Industry sponsors Sports Data Hub, ESPN Stats & Info, RStudio and Revolution Analytics, as well as the Harvard Statistics Department, the Boston Chapter of the American Statistical Association, and the Section in Sports of the American Statistical Association are providing support for the conference.

National Outreach Symposium in November

Sports are but one aspect of the growing use of statistics throughout everyday life.  The U.S. government’s Bureau of Labor Statistics is working with other federal agencies to host an outreach symposium November 13 and 14, 2013 to celebrate the International Year of Statistics 2013.

The goal of IYSTATLogothis two-day event is to present an overview of statistical methodologies and how they can be applied to diverse applications in econometrics, demography, medicine, agriculture, energy, transportation, and more. The audience for the planned symposium, to be held in Washington, D.C., will come from a diverse background of users and consumers of government statistics, data, and analyses.

The objectives of the International Year of Statistics initiative and  awareness campaign are to increase public understanding of the power and impact of statistics on all aspects of society, and nurture statistics as a profession, especially among high school and college students.

Organizers of the year-long effort – with than 2,000 participating organizations world-wide - note that “statistics have powerful and far-reaching effects on everyone, yet most people are unaware of their connection—from the foods they eat to the medicines they take—and how statistics improve their lives.” In Connecticut, participating organizations include the University of Connecticut and Connecticut by the Numbers.

More People Working From Home in Connecticut, Nationally

“Technologically-enabled opportunities for telework could be one factor contributing to the reduction in driving,” according to a report issued by ConnPIRG which has identified a drop in driving frequency in nearly every state in the nation, including Connecticut.

The report, “Moving Off the Road: A State-by-State Analysis of the National Decline in Driving,” notes that “the internet and other communications technologies have enabled many people to perform work from home that could only be done in an office previously. Email, conference calls, videoconferencing, and shared digital files have made it far easier for people to “telecommute” from home. In this way, telework might reduce household driving by eliminating commuting trips.”

The number of people who work from home a majority of the time stood at 4.3 percent in 2011.Counting a broader measure of all workers who report that they perform some of their job from home at least one day a Home-iconweek, 9.5 percent did so by 2010, up from 7 percent in 1999.

The most recent National Household Travel Survey indicates that 9 percent of city commuters telecommute even once per month, compared to 14 percent of suburban commuters and 10 percent of rural and town commuters, the report indicated.

According to the report, it is more common for people to work from home in New England and the entire West, except Nevada. One reason for differences may be the industrial make up of states, since working from home is more feasible in some types of work than others. The following figure bears out the ambiguous relationship between working from home and the volume of driving.

 ConnPIRG Education Fund, a 501(c)(3) organization, works to protect consumers and promote good government. ConnPIRG Education Fund offers an independent voice that works on behalf of the public interest, investigating problems, crafting solutions, educating the public, and offering meaningful opportunities for civic participation.

The new ConnPIRG analysis and report found that after sixty years of almost constant increases iworking from home mapn the annual number of miles Americans drive, since 2004 Americans have decreased their driving per-capita for eight consecutive years. Driving miles per person are down especially sharply among Millennials, America’s largest generation that will increasingly dominate national transportation trends.

The website Global Workplace Analytics reports that regular telecommuting grew by 73% between 2005 and 2011 compared to only 4.3% growth of the overall workforce (not including the self-employed). Growth within different sectors of the workforce varied widely:

  • Federal employees - 424% growth
  • State government employees - 114% growth
  • Not-for-profit employees - 85% growth
  • For profit employees - 63%
  • Local government employees - 67%

While many conjectured that telecommuting would decline during the recession, it actually grew by 11.4% from 2008 to 2011.   Based on current trends, with no growth acceleration, regular telecommuters will total 4.9 million by 2016, a 69% increase from the current level, according to Global Workplace Analytics, which conducts independent research and consult on emerging workplace issues and opportunities.

CT is Among Leaders in Long Marriages, Less Popular for Divorcees

It seems that Connecticut is a great place for a long marriage and those who have never been married, and not so popular for divorced individuals.  Data indicate that Connecticut ranks #12 in longest married residents, #14 in never-married residents, #32 in currently married residents and #33 in divorced residents –as a percentage of population, comparing the 50 states and Washington, D.C.

Bloomberg Visual Data ranked the U.S. states and the District of Columbia based on the median duration of current marriages in years which was calculated by averaging the medians for males and females for each state, using the 2011 U.S. Census American Community Survey data.marraige stats

The top ten states for longest marriages, based on the median duration of current marriages in years, were South Dakota (23.1 years), West Virginia (23.0), Maine (22.8) , North Dakota, Pennsylvania and Vermont (22.4), Iowa (22.1) Montana, Wisconsin(21.8), Nebraska (21.7) and Delaware 21.5).  Tied with Connecticut at #12 is Michigan, at 21.4 years.

In every state in the nation, at least a quarter of residents ages 15 and older have never married.  Far outdistancing the field is the District of Columbia, where 58 percent have never married – the only instance where that number exceeds half the population.  Next highest is New York, with 37.7 percent, followed by California, Massachusetts, Rhode Island, Maryland, Illinois, Louisiana, New Jersey Mississippi, Delaware, Pennsylvania, Georgia.  Connecticut is next, with a third of the population – 33.1 percent – never having been married.Wedding_rings

When comparing the estimated percentage of those currently married, Connecticut ranks at #32, with 48.4 percent.  Topping the list is Utah with 56.2 percent, Idaho at 55.5 percent and New Hampshire at 53.6 percent.

New Jersey and New York have the lowest percentage of divorced people in the U.S., at #49 and #50 respectively in the estimated percentage of divorced residents.  Connecticut ranked at #33, with 10.7 percent of the population (age 15+) being divorced.  The most divorced residents?  Nevada at 14 percent, followed by Maine at 13.7 percent and Arkansas and New Mexico, tied at 13.4 percent.

Connecticut Ranks #4 in Back-to-School Stores

With students now settling into their classrooms and the hectic back-to-school shopping mostly in the rear view mirror, we learn that Connecticut ranks #4 among the nation’s states in the number of back-to-school retail stores per square mile.

The Land of Steady Habits is outpaced only by New Jersey, Rhode Island and Massachusetts as retail meccas for pre-school year shoppers, just ahead of Maryland, Delaware, New York and Florida.

Connecticut has 3,477 back-to-school retailers, for an average per square mile of .718, according to a Bloomberg Visual Data using NAICS data.  The data defines an establishment is a single physical location at which business is conducted. Retail totals were only for establishments identified in the following NAICS sectors and subsectors: electronics and appliance stor4es; clothing and clothing accessory stores; sporting goods stores; hobby, toy and game stores; musical instrument and supplies stores; bookstores; general merchandise stores; and office supply and stationery stores.

Alaska and Wyoming had the smallest number of retailers, at 661 and 678 respectively, as well as the smallest number per square mile. (Alaska was .001)

Connecticut’s annual tax-free week for clothing and footwear under $300 was conducted Aug. 18 through Aug. 24 at stores across the state, just prior to the start of the school year in most communities. On average, it is estimated that families spend nearly $700 on back to school purchases. The state expects to lose about $7 million to $8 million in revenue from the week of tax-free shopping.

According to the National Retail Federation projections prior to the back-to-school shopping season, the biggest portion of back-to-school shoppers’ budgets will go toward new apparel and accessories: 95.3 percent of those with school-age children will spend an average of $230.85 on fall sweaters, denim and other chic pieces of attire. Additionally, families will spend on shoes ($114.39) and school supplies ($90.49). Fewer families with children in grades K-12 will purchase electronics (55.7%), and those that are going to invest in a new tablet or smartphone are going to spend slightly less than last year.

back to school

CT Worst in Nation for Unemployed, Near Bottom in GDP Growth - But Not Miserable

Connecticut is the worst state in the nation for the unemployed, according to data compiled by Bloomberg news.  The state ranked last among the 50 states and District of Columbia on the difficulty of life for the unemployed based on three equally weighted criteria: income replacement, the unemployment pool and income disparity, based on data compiled from U.S. Bureau of Economic Analysis, U.S. Bureau of Labor Statistics, and U.S. Census.

According tbea_logo_460o the business news service, the ten most challenging states for unemployed residents are Connecticut, New Jersey, District of Columbia, California, Maryland, Alaska, New York, Virginia, Delaware, Massachusetts and New Hampshire.

The best states – at the opposite end of the data compilation – are North Dakota, Utah, Iowa, New Mexico, Oklahoma, Arkansas, West Virginia, Montana and Idaho.economic-indicators2

In developing the rankings, Bloomberg used the following:  Average weekly unemployment benefits was the quarterly average from 2Q 2012 to 1Q 2013. Personal Income per capita was calculated by dividing 2013 preliminary total personal income by state data from the Bureau of Economic Analysis by the state population from the Census as of mid-year 2012. Unemployment rates were the July 2012 to June 2013 seasonally adjusted 12-month average figures for the civilian non-institutional population. Household income ratios were from the U.S. Census Bureau, 2011.  The three scores were averaged for the final ranking.

Connecticut also ranked third from the bottom on Gross Domestic Product growth between 2008 and 2012, according to a companion Bloomberg report of data from the U.S. Bureau of Economic Analysis.  Only Arizona and Nevada had a worse track-record during the period.  Connecticut was one of ten states to experience negative GDP growth during the years of the comparison.  The state’s GDP dropped to 197.2 billion last year, from 202.5 billion in 2008.  The most dramatic increase in GDP was in North Dakota, where GDP grew 35 percent.  Next was Texas, with a 12 percent increase, followed by Oregon, West Virginia, Alaska, Louisiana, Utah, Nebraska, Maryland and Indiana.

There was some good news for the Land of Steady Habits in recent data.  Connecticut ranked #13 among the "least miserable" states in the nation.  Which are the most miserable states?  Louisiana, Mississippi, Arkansas, West Virginia, New Mexico, SoutCT welcomes youh Carolina, Alabama, Nevada, Tennessee and Kentucky.  All of which seems to indicate that a state can have solid GDP growth and still be relatively miserable - particularly for the unemployed.

Thirteen variables from the United Health Foundation's America's Health Rankings were isolated to determine each state's Misery Score. Among them:  Air pollution levels refer to micrograms of fine particles per cubic meter. High school graduation rates refer to percent of incoming ninth graders who graduate within four years. Poor health days refer to the number of days in which a person could not perform work or household tasks due to poor mental or physical health. Personal income refers to income from all sources and is not inflation adjusted.

The least miserable states were – from the top - Minnesota, North Dakota, New Hampshire, Vermont, Massachusetts, Hawaii, Iowa, Nebraska, Utah, Wisconsin, Wyoming, South Dakota – and then Connecticut, at lucky #13.

State Lottery Shows Strength in Connecticut, Land of Steady Habits

What would you do if you won the lottery?  According to a new survey, you’d go to work.  That's true not only in the Land of Steady Habits, but nationwide.

Two-thirds of American workers say they would continue working even if they won $10 million in the lottery, while 31% say they would stop, according to a new Gallup poll, released earlier this month. The desire to keep working after enjoying a financial windfall is higher today than in three earlier Gallup measures, all prior to the 2008-2009 recession, the polling firm reported.

Additionally, most American workers who predict they would continue working even after winning the lottery say they would want to stay at the same job rgallup pollather than seek a new job. The roughly 2-to-1 ratio in favor of keeping the same job versus getting a new one is about the same as in 2004, but slightly higher than in 2005 and 1997.

Bloomberg News has reported that lottery players in the U.S. spend an average of $396 a year purchasing lottery tickets, with residents of Massachusetts, Georgia and New York leading the way.  Using data from this analysis, Bloomberg identified which states see the highest and lowest payout ratios. Connecticut tops  neither list. On average, Massachusetts players spend $861, Georgians spend $471 and New Yorkers spend $450 on lottery tickets.  At the bottom in per person spending, on average, are Oklahoma ($71), Montana ($61) and North Dakota ($47).

In fiscal year 2012, players in Connecticut won $659.9 million in prize money. At the same time the CT Lottery provided a record $310 million to support the services and programs founded by the state’s General Fund including public health, libraries, public safety, education and more, according to state lottery officials. Connecticut’s first lottery btop 3egan in 1972, and was the fourth in the nation.

According to the quasi-public Connecticut Lottery Corp.'s most recent annual report, released in May, the lottery achieved record sales totaling nearly $1.1 billion in fiscal year 2012, an increase of $65.1 million from the previous fiscal year, the Day of New London reported.  The lottery credited a number of factors for its total sales increase, including higher sales of instant tickets and higher sales of multistate games, such as Powerball, Mega Millions and Lucky for Life. Also, 2012 was a leap year, meaning an extra day for sales.

For the first time in 15 years in fiscal year 2013 (which ended on June 30), the lottery is bringing in more revenue ($16 million) than both Foxwoods and payoutsMohegan Sun, WTNH-TV reported last week.  Lotteries are ubiquitous.  In North America every Canadian province, 43 U.S. states, the District of Columbia, Mexico, Puerto Rico, and the U.S. Virgin Islands all offer government-operated lotteries. Elsewhere in the world, according to NASPL, publicly-operated lotteries exist in at least 100 countries on every inhabited continent.

According to the U.S. Bureau of Economic Analysis, only seven U.S. states don't run lotteries: Alabama, Alaska, Hawaii, Mississippi, Utah, Wyoming, and Nevada. Of the 43 states that do run lotteries, the average payout is just under 60% of the revenue dollars collected. Using U.S. Census data, Bloomberg reported that of the estimated $50 billion spent on lottery tickets in 2010, only $32.8 billion was returned in prize money.

A previous Gallup Poll on Gambling in America found that 57% of American adults reported buying a lottery ticket in the past 12 months. People with incomes of $45,000 to $75,000 were the most likely to play -- 65 percent had played in the past year -- while those with incomes under $25,000 were the least likely to play at 53 percent. Further, people with incomes in excess of $75,000 spend roughly three times as much on lotteries each month as do those with incomes under $25,000, the National Association of State and Provincial Lotteries (NASPL) points out.

As Enrollment Climbs, Caliber and Diversity of UConn Students Also Increases

Five years ago, at the start of the 2008-09 school year, published reports trumpeted that “UConn is expecting about 300 more freshmen this fall compared to last, making the 3,500-strong class the largest in the school's history.  Déjà vu all over again, as students arrive on campus to begin the 2013-14 academic year. The state’s flagship university reports a freshman class of “approximately 3,750 members – the largest in the school’s history.”

UConn is also pointing with pride at a freshman class that has:UConn

  • an average SAT score of 1233, which outpaces last year’s incoming freshmen, whose average of 1226 had set the previous UConn record;
  • the most diverse group of students that UConn has ever recruited, with 27 percent of its members representing minority groups;
  • the largest number of Honors Program students (456) to enroll in UConn in a single year;
  • 149 valedictorians and salutatorians in the freshman class (continuing steady growth from 43 in 2002, according to the Daily Campus).

UConn’s new freshmen class draws 32 percent of its students from other states, the same level as in 2002.  In 2010, the Connecticut Post reported that out-of-state students made up 35 percent of the 3,339 freshmen who started their college careers at UConn's main caUConn enrollmentmpus and more than 26 percent of all 4,580 freshmen across the university's main and five regional campuses. That was up from 17 percent in 1995.

This summer, a record number of UConn students enrolled in summer school, taking advantage of incentives that include lower tuition and half-priced housing.  More than 8,800 students enrolled in one or both of the school's summer sessions, according to school officials.  That is up 22 percent from 2009, the year before the school began offering housing incentives for its summer programs.

UConn President Susan Herbst told the Day of New London this week that UConn plans to hire 259 new faculty members, 200 of whom will be teach the so-called STEM subjects - science, technology, engineering and math - and will enroll an additional 6,580 undergraduates in the coming yuconn-night1ears, after legislative approved of Gov. Malloy’s plan for more than $1.5 billion in bonding and $137 million from the state's general fund for "Next Generation Connecticut."  Total enrollment last fall was 30,250, including more than 17,000 undergraduates on its main campus in Storrs.

A decade ago, in October 2002, UConn reported that “freshmen enrollment at the Storrs campus has increased so significantly over the last five years that it will be maintained at about 3,200 students for the next few years."

Official  enrollment figures for the 2013-14 academic year will not be available until September.


Cost of Raising A Child Is Highest in Northeast U.S., Including CT

The cost of raising a child:  priceless.  Well, no, there is a price-tag.  The U.S. Department of Agriculture (USDA) released its annual report, Expenditures on Children by Families, which shows that a middle-income family with a child born in 2012 can expect to spend about $241,080 ($301,970 adjusted for projected inflation*) for food, shelter, and other necessities associated with child-rearing expenses over the next 17 years.

There was an overall 2.6 percent increase from 2011.  Expenses for child care, education, health care, and clothing saw the largest percentage increases related to child rearing from 2011. However, there were smaller increases in housing, food, transportation, and miscellaneous expenses during the same period. The 2.6 percent increase from 2011 to 2012 is also lower than the average annual increase of 4.4 percent since 1960.

The report notes geographic variations in the cost of raising a child, with expenses the highest for families living in the urban Northeast  - the 9-state northeast region, which includes Connecticut, Maine, Massachusetts, New Hampshire, New Jersey, New York, Pennsylvania, Rhode Island, and Vermont -followed by the urban West and urban Midwest. Families living in the urban South and rural areas have the lowest child-rearing expenses.report child expense

The report, issued annually, is based on data from the Federal government's Consumer Expenditure Survey, the most comprehensive source of information available on household expenditures. There is also  an interactive web version of the report where individuals can easily enter the number and ages of their children to obtain an estimate of costs through age 17.

Housing accounted for the largest share of total child-rearing expenses. For the middle and highest income groups (for households with the expense), child care and education was the second largest expenditure on a child, accounting for 18 and 23 percent of child-rearing expenses, respectively. For the lowest income group, child care and education accounted for 14 percent of total child-rearing expenses (again, for households with the expense). For lower income families, child care may be provided by relatives or friends at no cost due to affordability issues, the report pointed out.

Expenses per child decrease as a family has more children. Families with three or more children spend 22 percent less per child than families with two chchild expensesildren. As families have more children, the children can share bedrooms, clothing and toys can be handed down to younger children, food can be purchased in larger and more economical quantities, and private schools or child care centers may offer sibling discounts.

Among the largest potential costs in child-rearing is the cost of a college education, which was not included in this study, which only included direct parent expenses through age 17. The College Board estimated that in 2012-2013, annual average (enrollment-weighted) tuition and fees were $8,655 at 4-year public colleges (in-State tuition) and $29,056 at 4-year private (non-profit) colleges; annual room and board was $9,205 at 4-year public colleges and $10,462 at 4-year private colleges. For 2-year colleges in 2012-2013, annual average tuition and fees were $3,131 at public colleges. These college costs may be offset by financial aid.

The report concluded, as only a government report could, by stating: “The direct and indirect costs of raising children are considerable, absorbing a major share of the household budget. On the other hand, these costs may be outweighed by the benefits of children.”

The full report is available on the web at www.cnpp.usda.gov. A video highlighting the report is at http://www.youtube.com/watch?v=Di14Y3kTbHE

Achievement Gap Persists Despite Progress Reflected in High School Graduation Rates

The academic achievement gap is alive and well and living in Connecticut.

While the high school graduation rate in the state has edged upward for the third consecutive year in 2012, 15.2 percent - 43,883 students – in the cohort of the class of 2012 failed to complete high school in four years.  This is down from 17.2 the previous year, according to the State Department of Education’s newly released data.  The state’s graduation rate is 84.8 percent – the percentage of students who graduate high school within four years.

Of the 15.2 percent of students who failed to graduate in four years, just over one-third - 5.4 percent - was still enrolled when their fellow students received their diplomas.  Overall, the disparity in graduate rates among whites, blacks and Hispanics was pronounced:

  • The graduation rate of Hispanic students (68.6 percent) is 22.7 percent lower than that of White students (91.3 percent); the corresponding gap between Black/African American students (73 percent) and their White counterparts is 18.3 percent.
  • The graduation rate for low-income students (those eligible for free lunch) is 66.6 percent, whch is 26.5 percent lower than that of students not eligible for any lunch subsidies (93.1 percent).
  • The graduation rate for English Language Learners (62.7 percent) is 23.2 percent lower than that of their non-ELL peers (85.9 percent).

The graduation rate for Hispanics increased 4.4 percent last year over 2011, and it increased 1.8 percent for Black students, reflecting the state’s progress in narrowing the longstanding gap.

However, “just 54.2 percent of Hispanic males and only 57.6 percent of Black males who are eligible for free lunch graduated high school within four years,” the department reported, pointing out the demographic with the greatest disparities.

The report also noted that the high school graduation rate remains higher for males than females in Connecticut , 88.3 percent compared with 81.5 percent.  Anclass seatsd the graduation rate improved more for females (2.3 percent) than males (1.9 percent) from 2011 to 2012.

Across the state’s 188 high schools, the graduation rate was above 90 percent in 100 high schools, 40 high schools had a graduation rate of between 80 and 90 percent, and 38 high schools had a graduation rate of less than 80 percent.

Graduation rates are calculated according to the Adjusted Cohort Graduation Rate method, which was developed by the National Governors Association and is considered to be the most precise method. These rates represent the percentage of students who graduated with a regular high school diploma in four years or less. It is based on individual student level data, excludes 9th grade repeaters, late graduates, and accounts for transfers in and out of the graduating class over the four-year period.

By way of comparison, in North Carolina, 80.4 percent of students graduated high school within four years, somewhat below Connecticut’s overall 84.8 percent.  However, among students of color, North Carolina’s numbers outpace Connecticut.  In North Carolina, 73 percent of Hispanic students now graduate in four years, compared with 68.6 percent in Connecticut.  Among black students, the percentage graduating in four years is 74.7 percent in North Carolina, compared to 73 percent in Connecticut.