Connecticut “Ideas Worth Spreading” Resonate in Massachusetts in TED Talks

TED came to Springfield, Massachusetts this month with a decidedly Connecticut flavor, as a quarter of the featured speakers offering “ideas worth spreading,” hailed from the “still revolutionary” state.

Of the 16 “TED talks” on the agenda during a day-long program sponsored by and held at the headquarters of Mass Mutual, four of the speakers were from Connecticut, and left the specially selected audience intrigued, impressed and inspired.

keishaWell known worldwide, TED is a nonprofit which began decades ago with a conference bringing together people from three worlds: Technology, Entertainment, Design. Since then its scope has become considerably broader, and “TED Talks” – widely available on the web – have become a global phenomenon, watched by tens of millions.

TED conferences “bring together the world's most fascinating thinkers and doers, who are challenged to give the talk of their lives.”  That’s precisely what occurred at TEDx in Springfield, where in addition to speakers touting the possibilities for that post-industrial urban center, a wide array of innovative subjects were featured under the theme “Driving innovation through diversity and inclusion.”

The Connecticut quartet at TEDx Springfield:

  • Keisha Ashe is co-founder and CEO of ManyMentors, a nonprofit science, technology, engineering and math STEM) mentoring organization that connects minority and female middle and high school students with encouraging and suppormaureen connolly phototing near-age mentors in the STEM fields.  “If they never know, they’ll never go,” is the guiding phrase of the initiative, reflecting the fact that many women and minority students are not encouraged to pursue the STEM fields, and are often unaware of the career potential or their own aptitude for the STEM careers.  Ashe is a Ph.D. candidate in Chemical Engineering at UConn.
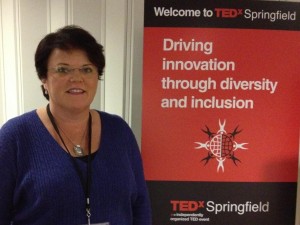
  • Maureen Connolly is an event planning professional with extensive national and international experience across diverse markets, and a visionary and passionate leader skilled at creating high impact programs with measurable results.  She is the foremost advocate for utilizing public celebrations as a means of extending social capital by having the community, rather than the event, at the core of planning.  She has written on the enduring transformational potential of public celebrations, and offers that “now is the time to harness that collective energy and accumulated social capital as a catalyst for social change” that will develop collaborations with the potential to breathe new life into hard-pressed cities.david ryan polgar
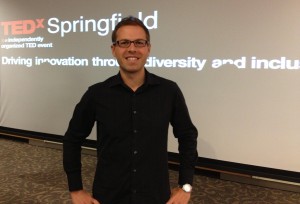
  • David Ryan Polgar is a Connecticut-based writer/attorney/educator and highly regarded tech ethicist who speaks on the topics of information overload, digital diets, and creativity.  He is an award-winning columnist for Seasons magazine, and has been featured in national media. Polgar speaks and writes about the ethical, legal, sociological, and emotional issues surrounding our relationship to technology.  He has created a “Mental Food Plate” as an approach to achieving deeper levels of thinking, and explores the imperative for an industry to develop that will serve as a counterbalance to the burgeoning technologies that “we can’t stop consuming.”
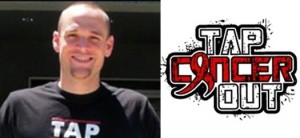
  • Jon Thomas is the founder of Tap Cancer Out, a Brazilian Jiu-Jitsu nonprofit and host of the most philanthropic martial arts events in the world.  Jon Thomas and his wife Becky run the Stratford-based nonprofit “in the slivers of spare time between their jobs in advertising.”  The nonprofit was founded out of a desire to respond to the devastation of cancer through a sport that Thomas was deeply involved with.  The organization raises funds – all donated to the Leukemia & Lymphoma Society - through hosting fundraising tournaments, direct donations, merchandise sales and sponsorships.tap cancer out

The TED website points out that “TED is best thought of as a global community, welcoming people from every discipline and culture who seek a deeper understanding of the world.”  TEDx Springfield was organized by Jae Junkunc of Hartford, from Mass Mutual's Enterprise Risk Management Group, with support of a 15-member team that developed the program over six months.

TED includes the award-winning TED Talks video site, the Open Translation Project and TED Conversations, the inspiring TED Fellows and TEDx programs, and the annual TED Prize. The TEDx program gives communities, organizations and individuals the opportunity to stimulate dialogue through TED-like experTEDx logoiences at the local level. The TED Conference provides general guidance for the TEDx program, but individual TEDx events are planned and coordinated independently.

A TEDx session in Hartford in June included talks by David Fink of Partnership for Strong Communities, Steven Mitchell of East Coast Greenway, Donna Berman of Charter Oak Cultural Center, and Rich Hollant of CO:LAB, among sixteen local speakers.

WNBA Leads Major Sports in Gender, Racial Diversity; Baseball Mirrors Society Best

The WNBA received a combined grade of A+ for race and gender diversity, after earning and A+ for race and an A+ for gender in the 2013 WNBA Racial and Gender Report Card, produced by The Institute for Diversity and Ethics in Sports (TIDES) based at the University of Central Florida.

The study provides an analysis of the racial breakdown of the players and management in the league office and at the team level. It also looks at team general managers, coaching staffs and other support personnel.

Meanwhile, the Institute’s comparison of the racial breakdown of players in major league baseball, the National Football League and the National Basketball Association, alswnba_logo_detailo released this month, shows that baseball has a demographic breakdown that more closely reflects the nation’s demographics. But the most diverse league – in terms of players as well as the front office – is the WNBA.

Richard Lapchick, the director of TIDES and primary author of the report, said, “The WNBA continues to set the standard for racial and gender diversity amongst all professional leagues.”

Among the key statistics compiled by TIDES highlighting the WNBA:racial-diversity-in-professional-sports_5255f9324cb41

  • At 67 percent, women held the highest percentage of assistance coaching positions in the history of the WNBA, setting a new mark for the second consecutive year.
  • The percentage of people of color holding professional level staff positions in the WNBA League Office increased from 29 to 33 percent while the percentage of women increased by 8 percentage points.
  • WNBA players of color increased by five percentage points in 2013.
  • Nine women and seven people of color had ownership positions on a WNBA franchise in 2013.  Most were limited partners.
  • The number of women in the top management role increased from two to five women CEO/Presidents from 2012 to 2013.

Locally, of the 24 individuals highlighted on the Connecticut Sun website as members of the team staff, 12 are women and two are individuals of color.  The CEO and VP/General Manager are men, and the head coach, Anne Donovan, is a woman.

Laurel J. Richie, tmlb-logohe first woman of color to become president of a professional sports league, continued the WNBA’s tradition as professional sports’ most diverse organization.  Richie, a veteran marketing executive, brought more than three decades of experience in consumer marketing, corporate branding, public relations and corporate management, when she was appointed President of the WNBA, in 2011.

Many would argue that baseball is no longer "America's Pastime", but strikingly the racial composition of the average major league team corresponds almost perfectly to their proportions in American society, the Institute noted.“It truly is the game that looks like America the most, the other major sports leagues do not even come close,” the organization pointed out, as reflected in an Infographic on the website visually.

The WNBA Racial and Gender Report Card is the third report issued thus far in 2013 after the releases of the reports on Major League Baseball and the National Basketball Association earlier this year.

CT is Top 10 State in Percentage of Seniors in Workforce;Both Men and Women Highly Ranked

Connecticut is among the nation’s leading states in the percentage of senior citizens – men and women age 65 or older – still in the workforce.  The Land of Steady Habits placed in the top ten for both men and women, and showed increases in the percentage of seniors in the workforce compared with 2000, reflecting a national trend.

Connecticut is ranked 9th in the nation in the percentage of female senior citizens in the workforce, with 14.7 percent.  The state is 7th nationwide in the percentage of male senior citizens in the workforce, with 23.8 percent.

Looking at the percentage of senior female workers, the top ten are AlasTop 10 words over white backgroundka (with 20.7%), Nebraska, District of Columbia, South Dakota, Wyoming, New Hampshire, Hawaii, Maryland, Connecticut and North Dakota.  The lowest percentage was in Michigan at 9.2 percent.

In Connecticut, 9.2% of women age 65-69 are working, 3.3% of women age 70-74, and 2.2% of women 75 years old or older.  The overall percentage of women seniors in the workforce in Connecticut increased from 9.9% in 2000 to 14.7% in 2011.

Using U.S. Census data, Bloomberg.com ranked the U.S. states and the District of Columbia based on thworkinge percentage of female seniors employed.  Figures are calculated by dividing the number of females aged 65+ and employed by total population of females aged 65+.   The male population was calculated in a similar fashion.

Connecticut ranked 7th in the nation in the percentage of male senior citizens in the workforce.  Data for male senior citizens indicate that in Connecticut, the overall percentage in the workforce is 23.8 percent, with 13.3% of those age 65-69, 5.6% of those 70-74 and 4.4% of male seniors age 75 or older still working.

The top ten states in the percentage of male senior citizens in the workforce are District of Columbia, Nebraska, South Dakota, Kansas, North Dakota, Maryland, Connecticut, Vermont, Alaska and Massachusetts.  The lowest percentage was in West Virginia, with 13.5 percent.

CT Residents Are Driving Less, Reflecting National Trend

Connecticut residents have cut their per-person driving miles by 3.45 percent since 2005, while the nation’s long term driving boom appears to have ended, according to a report by the ConnPIRG Education Fund. The decline in driving is a national trend, with 46 states including Connecticut having reduced per-person driving since the middle of the last decade.

The 31-page report, “Moving Off the Road: A State-by-State Analysis of the National Decline in Driving,” is based on the most current available government data. The average number of miles driven by Americans is in its eight consecutive year of decline, led Moving Off the Road Thumbnailby declines among Millennials. Connecticut has had the slowest decline in driving in New England, but has the second lowest vehicle miles traveled per person in region, behind Rhode Island. The national trend in driving peaked in 2005.

“It’s time for policy makers to recognize that the driving boom is over. We need to reconsider expensive highway expansions and focus on alternatives such as public transportation and biking—which people increasingly use to get around,” said Abe Scarr, Director of the ConnPIRG Education Fund.

“The Millennial generation is leading the decrease in driving and will be using and paying for our transportation system for years to come.  It is critical that Connecticut plans a system that reflects how people are getting around and want to get around,” said Scarr.  The report noted that “the evidence suggests that the nation’s per-capita decline in driving cannot be dismissed as a temporary side effect of the recession.”

Earlier this year, Governor Malloy and Department of Transportation Commissioner James Redeker launched a multi-year strategic planning process, Transform CT, which aims to “improve economic growth and competitiveness, build sustainability, and provide a blueprint for a world-class transportation system.”  TransformCT_published_Cycle_Small

Transform CT has established an interactive website to gather public input which has collected nearly 300 comments, suggestions or ideas to date, and will be updated with topics and polls regularly as the strategic plan is developed over 18-20 months. In addition, a series of events will be held throughout the fall to engage the public on the future of transportation in Connecticut.

 “Connecticut’s investment in critical transit projects like CTfastrak and the New Haven-Springfield commuter rail line show that transportation decisions better reflect changing travel preferences of residents,” said Ryan Lynch, associate director for the Tri-State Transportation Campaign, a non-profit policy organization.

The Tri-State Transportation Camcars on hwaypaign, a 501(c)(3) non-profit organization dedicated to reducing car dependency in New York, New Jersey, and Connecticut, celebrates its 20th anniversary with a fundraising benefit in New York City on November 7.  The Campaign was formed in the early nineties as a response to the mounting economic and environmental costs of automobile and truck dependence and promising reforms in federal transportation policy. Among the organization’s board members is Norman Garrick, Director of the Center for Transportation and Urban Planning at the University of Connecticut.

North Dakota, Nevada, Louisiana and Alabama are the only states in the nation where driving miles per capita in 2011 were above their 2004 or 2005 peaks, the ConnPIRG report found.  Meanwhile, since 2005, double-digit percent reductions occurred in a diverse group of states: Alaska, Delaware, Oregon, Georgia, Wyoming, South Carolina, the District of Columbia, Pennsylvania, Indiana and Florida.

The states with the biggest reductions in driving miles generally were not the states hit hardest by the economic downturn, according to the ConnPIRG report. The majority—almost three-quarters—of the states where per-person driving miles declined more quickly than the national average actually saw smaller increases in unemployment compared to the rest of the nation, according to the report.

Sports Statistics Conference Features Sabermetrics As Part of National, Global Focus on Influences of Stats

Connecticut-based ESPN is among the sponsors for the upcoming New England Symposium on Statistics in Sports, to be held on September 21 at Harvard University, that will include a panel discussion to feature Eric Van, sabermetric baseball operations consultant for the Boston Red Sox, Ben Baumer, who handled statistical analysis for the New York Mets from 2004 through 2012, and Vince Gennnaro, a consultant to a number of Major League Baseball teams during the past decade.

Panel moderator is Andy Andres, head coach and lead instructor of the MIT Science of Baseball program and Fenway Park datacaster/stringer for mlb.com.    Featured speakers are Jim Albert of Bowling Green State University, on “Assessing Streakiness in Home Run Hitting,” and Richard Smith, of the University of North Carolina, who will present for the first-time a statistical model for predicting the finish times of individuals who were running in the 2013 Boston Marathon but were unable to complete the race, as previously reported by Connecticut by the Numbers.

NESSISThe Symposium is a meeting of statisticians and quantitative analysts connected with sports teams, sports media, and universities to discuss common problems of interest in statistical modeling and analysis of sports data. The symposium is part of a year-long series of programs and events around the world during the International Year of Statistics.

In addition to the featured presentations, the scheduled presentations at the Sept. 21 Symposium will focus on statistical research and analysis conducted in areas including:

  • statistics-based revisions to defensive alignments in the NBA,
  • how weather affects the knuckleball,
  • whether crossing helps or hurts scoring in premier soccer, and
  • trends such as match time and game duration in professional tennis.

Co-chairs of the conference are Mark Glickman, Senior Statistician at Boston University and Scott Evans, Senior Research Scientist at Harvard.   Registration is now open for the day-long symposium.

ESPN operates a Stats & Info blog that shares with fans the information that the ESPN Stats & Information Group provides to its production teams around the company. The Stats & Info blog's content is a must-read at ESPN - on-camera talent, producers, bloggers,ESPN stats & info columnists and editors use Stats & Info insight on a daily basis. Individuals can subscribe to the blog for around-the-clock notes, stats and trends, using a blend of traditional statistics and the advanced metrics that the network describes as  the "next level."

Industry sponsors Sports Data Hub, ESPN Stats & Info, RStudio and Revolution Analytics, as well as the Harvard Statistics Department, the Boston Chapter of the American Statistical Association, and the Section in Sports of the American Statistical Association are providing support for the conference.

National Outreach Symposium in November

Sports are but one aspect of the growing use of statistics throughout everyday life.  The U.S. government’s Bureau of Labor Statistics is working with other federal agencies to host an outreach symposium November 13 and 14, 2013 to celebrate the International Year of Statistics 2013.

The goal of IYSTATLogothis two-day event is to present an overview of statistical methodologies and how they can be applied to diverse applications in econometrics, demography, medicine, agriculture, energy, transportation, and more. The audience for the planned symposium, to be held in Washington, D.C., will come from a diverse background of users and consumers of government statistics, data, and analyses.

The objectives of the International Year of Statistics initiative and  awareness campaign are to increase public understanding of the power and impact of statistics on all aspects of society, and nurture statistics as a profession, especially among high school and college students.

Organizers of the year-long effort – with than 2,000 participating organizations world-wide - note that “statistics have powerful and far-reaching effects on everyone, yet most people are unaware of their connection—from the foods they eat to the medicines they take—and how statistics improve their lives.” In Connecticut, participating organizations include the University of Connecticut and Connecticut by the Numbers.

More People Working From Home in Connecticut, Nationally

“Technologically-enabled opportunities for telework could be one factor contributing to the reduction in driving,” according to a report issued by ConnPIRG which has identified a drop in driving frequency in nearly every state in the nation, including Connecticut.

The report, “Moving Off the Road: A State-by-State Analysis of the National Decline in Driving,” notes that “the internet and other communications technologies have enabled many people to perform work from home that could only be done in an office previously. Email, conference calls, videoconferencing, and shared digital files have made it far easier for people to “telecommute” from home. In this way, telework might reduce household driving by eliminating commuting trips.”

The number of people who work from home a majority of the time stood at 4.3 percent in 2011.Counting a broader measure of all workers who report that they perform some of their job from home at least one day a Home-iconweek, 9.5 percent did so by 2010, up from 7 percent in 1999.

The most recent National Household Travel Survey indicates that 9 percent of city commuters telecommute even once per month, compared to 14 percent of suburban commuters and 10 percent of rural and town commuters, the report indicated.

According to the report, it is more common for people to work from home in New England and the entire West, except Nevada. One reason for differences may be the industrial make up of states, since working from home is more feasible in some types of work than others. The following figure bears out the ambiguous relationship between working from home and the volume of driving.

 ConnPIRG Education Fund, a 501(c)(3) organization, works to protect consumers and promote good government. ConnPIRG Education Fund offers an independent voice that works on behalf of the public interest, investigating problems, crafting solutions, educating the public, and offering meaningful opportunities for civic participation.

The new ConnPIRG analysis and report found that after sixty years of almost constant increases iworking from home mapn the annual number of miles Americans drive, since 2004 Americans have decreased their driving per-capita for eight consecutive years. Driving miles per person are down especially sharply among Millennials, America’s largest generation that will increasingly dominate national transportation trends.

The website Global Workplace Analytics reports that regular telecommuting grew by 73% between 2005 and 2011 compared to only 4.3% growth of the overall workforce (not including the self-employed). Growth within different sectors of the workforce varied widely:

  • Federal employees - 424% growth
  • State government employees - 114% growth
  • Not-for-profit employees - 85% growth
  • For profit employees - 63%
  • Local government employees - 67%

While many conjectured that telecommuting would decline during the recession, it actually grew by 11.4% from 2008 to 2011.   Based on current trends, with no growth acceleration, regular telecommuters will total 4.9 million by 2016, a 69% increase from the current level, according to Global Workplace Analytics, which conducts independent research and consult on emerging workplace issues and opportunities.

CT is Among Leaders in Long Marriages, Less Popular for Divorcees

It seems that Connecticut is a great place for a long marriage and those who have never been married, and not so popular for divorced individuals.  Data indicate that Connecticut ranks #12 in longest married residents, #14 in never-married residents, #32 in currently married residents and #33 in divorced residents –as a percentage of population, comparing the 50 states and Washington, D.C.

Bloomberg Visual Data ranked the U.S. states and the District of Columbia based on the median duration of current marriages in years which was calculated by averaging the medians for males and females for each state, using the 2011 U.S. Census American Community Survey data.marraige stats

The top ten states for longest marriages, based on the median duration of current marriages in years, were South Dakota (23.1 years), West Virginia (23.0), Maine (22.8) , North Dakota, Pennsylvania and Vermont (22.4), Iowa (22.1) Montana, Wisconsin(21.8), Nebraska (21.7) and Delaware 21.5).  Tied with Connecticut at #12 is Michigan, at 21.4 years.

In every state in the nation, at least a quarter of residents ages 15 and older have never married.  Far outdistancing the field is the District of Columbia, where 58 percent have never married – the only instance where that number exceeds half the population.  Next highest is New York, with 37.7 percent, followed by California, Massachusetts, Rhode Island, Maryland, Illinois, Louisiana, New Jersey Mississippi, Delaware, Pennsylvania, Georgia.  Connecticut is next, with a third of the population – 33.1 percent – never having been married.Wedding_rings

When comparing the estimated percentage of those currently married, Connecticut ranks at #32, with 48.4 percent.  Topping the list is Utah with 56.2 percent, Idaho at 55.5 percent and New Hampshire at 53.6 percent.

New Jersey and New York have the lowest percentage of divorced people in the U.S., at #49 and #50 respectively in the estimated percentage of divorced residents.  Connecticut ranked at #33, with 10.7 percent of the population (age 15+) being divorced.  The most divorced residents?  Nevada at 14 percent, followed by Maine at 13.7 percent and Arkansas and New Mexico, tied at 13.4 percent.

Connecticut Ranks #4 in Back-to-School Stores

With students now settling into their classrooms and the hectic back-to-school shopping mostly in the rear view mirror, we learn that Connecticut ranks #4 among the nation’s states in the number of back-to-school retail stores per square mile.

The Land of Steady Habits is outpaced only by New Jersey, Rhode Island and Massachusetts as retail meccas for pre-school year shoppers, just ahead of Maryland, Delaware, New York and Florida.

Connecticut has 3,477 back-to-school retailers, for an average per square mile of .718, according to a Bloomberg Visual Data using NAICS data.  The data defines an establishment is a single physical location at which business is conducted. Retail totals were only for establishments identified in the following NAICS sectors and subsectors: electronics and appliance stor4es; clothing and clothing accessory stores; sporting goods stores; hobby, toy and game stores; musical instrument and supplies stores; bookstores; general merchandise stores; and office supply and stationery stores.

Alaska and Wyoming had the smallest number of retailers, at 661 and 678 respectively, as well as the smallest number per square mile. (Alaska was .001)

Connecticut’s annual tax-free week for clothing and footwear under $300 was conducted Aug. 18 through Aug. 24 at stores across the state, just prior to the start of the school year in most communities. On average, it is estimated that families spend nearly $700 on back to school purchases. The state expects to lose about $7 million to $8 million in revenue from the week of tax-free shopping.

According to the National Retail Federation projections prior to the back-to-school shopping season, the biggest portion of back-to-school shoppers’ budgets will go toward new apparel and accessories: 95.3 percent of those with school-age children will spend an average of $230.85 on fall sweaters, denim and other chic pieces of attire. Additionally, families will spend on shoes ($114.39) and school supplies ($90.49). Fewer families with children in grades K-12 will purchase electronics (55.7%), and those that are going to invest in a new tablet or smartphone are going to spend slightly less than last year.

back to school

CT Worst in Nation for Unemployed, Near Bottom in GDP Growth - But Not Miserable

Connecticut is the worst state in the nation for the unemployed, according to data compiled by Bloomberg news.  The state ranked last among the 50 states and District of Columbia on the difficulty of life for the unemployed based on three equally weighted criteria: income replacement, the unemployment pool and income disparity, based on data compiled from U.S. Bureau of Economic Analysis, U.S. Bureau of Labor Statistics, and U.S. Census.

According tbea_logo_460o the business news service, the ten most challenging states for unemployed residents are Connecticut, New Jersey, District of Columbia, California, Maryland, Alaska, New York, Virginia, Delaware, Massachusetts and New Hampshire.

The best states – at the opposite end of the data compilation – are North Dakota, Utah, Iowa, New Mexico, Oklahoma, Arkansas, West Virginia, Montana and Idaho.economic-indicators2

In developing the rankings, Bloomberg used the following:  Average weekly unemployment benefits was the quarterly average from 2Q 2012 to 1Q 2013. Personal Income per capita was calculated by dividing 2013 preliminary total personal income by state data from the Bureau of Economic Analysis by the state population from the Census as of mid-year 2012. Unemployment rates were the July 2012 to June 2013 seasonally adjusted 12-month average figures for the civilian non-institutional population. Household income ratios were from the U.S. Census Bureau, 2011.  The three scores were averaged for the final ranking.

Connecticut also ranked third from the bottom on Gross Domestic Product growth between 2008 and 2012, according to a companion Bloomberg report of data from the U.S. Bureau of Economic Analysis.  Only Arizona and Nevada had a worse track-record during the period.  Connecticut was one of ten states to experience negative GDP growth during the years of the comparison.  The state’s GDP dropped to 197.2 billion last year, from 202.5 billion in 2008.  The most dramatic increase in GDP was in North Dakota, where GDP grew 35 percent.  Next was Texas, with a 12 percent increase, followed by Oregon, West Virginia, Alaska, Louisiana, Utah, Nebraska, Maryland and Indiana.

There was some good news for the Land of Steady Habits in recent data.  Connecticut ranked #13 among the "least miserable" states in the nation.  Which are the most miserable states?  Louisiana, Mississippi, Arkansas, West Virginia, New Mexico, SoutCT welcomes youh Carolina, Alabama, Nevada, Tennessee and Kentucky.  All of which seems to indicate that a state can have solid GDP growth and still be relatively miserable - particularly for the unemployed.

Thirteen variables from the United Health Foundation's America's Health Rankings were isolated to determine each state's Misery Score. Among them:  Air pollution levels refer to micrograms of fine particles per cubic meter. High school graduation rates refer to percent of incoming ninth graders who graduate within four years. Poor health days refer to the number of days in which a person could not perform work or household tasks due to poor mental or physical health. Personal income refers to income from all sources and is not inflation adjusted.

The least miserable states were – from the top - Minnesota, North Dakota, New Hampshire, Vermont, Massachusetts, Hawaii, Iowa, Nebraska, Utah, Wisconsin, Wyoming, South Dakota – and then Connecticut, at lucky #13.

State Lottery Shows Strength in Connecticut, Land of Steady Habits

What would you do if you won the lottery?  According to a new survey, you’d go to work.  That's true not only in the Land of Steady Habits, but nationwide.

Two-thirds of American workers say they would continue working even if they won $10 million in the lottery, while 31% say they would stop, according to a new Gallup poll, released earlier this month. The desire to keep working after enjoying a financial windfall is higher today than in three earlier Gallup measures, all prior to the 2008-2009 recession, the polling firm reported.

Additionally, most American workers who predict they would continue working even after winning the lottery say they would want to stay at the same job rgallup pollather than seek a new job. The roughly 2-to-1 ratio in favor of keeping the same job versus getting a new one is about the same as in 2004, but slightly higher than in 2005 and 1997.

Bloomberg News has reported that lottery players in the U.S. spend an average of $396 a year purchasing lottery tickets, with residents of Massachusetts, Georgia and New York leading the way.  Using data from this analysis, Bloomberg identified which states see the highest and lowest payout ratios. Connecticut tops  neither list. On average, Massachusetts players spend $861, Georgians spend $471 and New Yorkers spend $450 on lottery tickets.  At the bottom in per person spending, on average, are Oklahoma ($71), Montana ($61) and North Dakota ($47).

In fiscal year 2012, players in Connecticut won $659.9 million in prize money. At the same time the CT Lottery provided a record $310 million to support the services and programs founded by the state’s General Fund including public health, libraries, public safety, education and more, according to state lottery officials. Connecticut’s first lottery btop 3egan in 1972, and was the fourth in the nation.

According to the quasi-public Connecticut Lottery Corp.'s most recent annual report, released in May, the lottery achieved record sales totaling nearly $1.1 billion in fiscal year 2012, an increase of $65.1 million from the previous fiscal year, the Day of New London reported.  The lottery credited a number of factors for its total sales increase, including higher sales of instant tickets and higher sales of multistate games, such as Powerball, Mega Millions and Lucky for Life. Also, 2012 was a leap year, meaning an extra day for sales.

For the first time in 15 years in fiscal year 2013 (which ended on June 30), the lottery is bringing in more revenue ($16 million) than both Foxwoods and payoutsMohegan Sun, WTNH-TV reported last week.  Lotteries are ubiquitous.  In North America every Canadian province, 43 U.S. states, the District of Columbia, Mexico, Puerto Rico, and the U.S. Virgin Islands all offer government-operated lotteries. Elsewhere in the world, according to NASPL, publicly-operated lotteries exist in at least 100 countries on every inhabited continent.

According to the U.S. Bureau of Economic Analysis, only seven U.S. states don't run lotteries: Alabama, Alaska, Hawaii, Mississippi, Utah, Wyoming, and Nevada. Of the 43 states that do run lotteries, the average payout is just under 60% of the revenue dollars collected. Using U.S. Census data, Bloomberg reported that of the estimated $50 billion spent on lottery tickets in 2010, only $32.8 billion was returned in prize money.

A previous Gallup Poll on Gambling in America found that 57% of American adults reported buying a lottery ticket in the past 12 months. People with incomes of $45,000 to $75,000 were the most likely to play -- 65 percent had played in the past year -- while those with incomes under $25,000 were the least likely to play at 53 percent. Further, people with incomes in excess of $75,000 spend roughly three times as much on lotteries each month as do those with incomes under $25,000, the National Association of State and Provincial Lotteries (NASPL) points out.