Connecticut Ranks #13 in Workers Employed Here Who Live Elsewhere

The percentage of Connecticut workers who live outside the Constitution State is among the highest in the country, ranking 13th overall, at 6.4 percent.  Data from the American Community Survey of the U.S. Census Bureau indicates that Delaware has the largest percentage of workers who reside outside the state, at 14.8 percent. (The District of Columbia exceeds all the states, at 72.4map-usa percent.)

In examining the top commuting flows from state of residence to workplace state, Connecticut ranks at #14, with 66,652 people traveling from their homes in Connecticut to work in New York.  The leading residence-to-workplace combination is New Jersey to New York, with 396,520 workers commuting from the Garden State to the Empire State for their jobs.  The other top pairs are Maryland to D.C., Virginia to D.C., New York to New Jersey, and Pennsylvania to New Jersey.

The Survey’s analysis points out that “information about commuting activity between two specific geographic areas helps define commuting patterns and provides a gauge of economic interconnectedness.”

The top 15 states, and the percentage of their workers who live outside the state’s borders, are:

  1. D.C.                        72.4%
  2. Delaware             14.8%
  3. Rhode Island      12.8%
  4. North Dakota     11.6%
  5. New Hampshire 10.8%
  6. West Virginia     10.0%
  7. Maryland             9.1%
  8. Kansas                  8.4%
  9. Kentucky             7.8%
  10. Missouri               7.4%
  11. Vermont              7.1%
  12. Virginia                 6.8%
  13. Connecticut       6.4%morning traffic
  14. New York            6.4%
  15. Massachusetts  6.3%

 The statistics in the survey, which was issued earlier this year, reflects 2011 data.  The report also noted that among U.S. workers who did not work at home, 8.1 percent had commutes of 60 minutes or longer.  New York had the highest rage of “long commutes” at 16.2 percent, followed by Maryland and New Jersey at 14.8 percent and 14.6, respectively.  In Connecticut, 6.4 percent of workers working in the state have a commute of 60 minutes or longer.

The American Community Survey (ACS) is a nationwide survey designed to provide communities with reliable and timely demographic, social, economic, and housing data for the nation, states, congressional districts, counties, places, and other localities every year. It had a 2011 sample size of about 3.3 million.

Attractive Candidates Have Evolutionary Advantage, Study Finds

Leaders of Connecticut’s Democratic and Republican parties declared victory in last week’s municipal elections around the state, and each had solid examples to back up their claims.  Writing in the Journal Inquirer, one columnist summed it up, stating that  “as usual the municipal elections were determined by local issues and personalities and both parties had successes and failures.”

 But was there a factor that crossed party lines and helped determine winners?  Were local issues and personalities only part of the story?  Was it the pretty faces that won the day, in a string of election upsets (and some less surprising results) that propelled proponenPsychological Sciencets of both political parties into mayoral offices in cities and towns across the landscape?

In a new article in the journal Psychological Science, “people’s preferences for good-looking politicians may be linked to ancient adaptations for avoiding disease,” wrote Andrew Edward White, a doctoral candidates in social psychology, and Douglas T. Kenrick, a professor of psychology, both at Arizona State University.  “Modern humans,” they write, “may have a vestigial tendency to prefer attractive leaders when disease threats are looming.” (Flu season is approaching?)

The basis of their work is that “our ancesnew mayorstors frequently confronted devastating epidemics that wiped out many of the members of their groups; at such times, having a healthy leader might have been particularly important,” they wrote recently in The New York Times.

Their study, which tested their hypothesis in a series of tests of varying approaches and reviewed past voting patterns, produced these findings:  People who said they were concerned with disease were more likely to desire that a more attractive person take charge.  And the preference for attractive group leaders goes above and beyond the more general preferences for attractive group members.   In one segment of the study, for example, they found that “in congressional districts with elevated disease threats, physically attractive candidates are more likely to be elected.” Their study abstract points out that “experimentally activating disease concerns leads people to especially value physical attractiveness in leaders.”

In their research paper, titled “Beauty at the Ballot Box:  Disease Threats Predict Preferences for Physically Attractive Leaders,” they conclude that “the link between disease and leader preferences aligns with other new findings showing that disease concerns are connected in functional ways to a host of human decisions,” noting that their work is part of a “larger program of research exploring how human decision making reflects the influence of our evolutionary past.”

Photo montage:  First-term winning candidates of Mayoral elections in Connecticut on November 5, 2013.

Majority of Students in 17 States Are Low Income, Study Finds; Connecticut Schools Among Most Income Diverse, Except in Cities

Echoing concerns that “a house divided against itself cannot stand,” a new study is raising alarm about the dramatically increasing percentage of low income students in American public schools – and the implications for the education of a generation of school children.

A new study from the Southern Education Foundation shows that 17 U.S. states have reached an unenviable tipping point: the majority of students in their public school systems receive free lunches — effectively indicating that the public school systems in these states can now be described as institutions that mostly serve the poor, rather than public institutions that serve a representative cross-section of their state’s population.

As states coast-to-coast reach that new imbalance – particularly in the South and West – the Northeast, including Connecticut, continue to have the smallest percentages of low income students in their public schools, according to the most recent data used in the study, from 2011. The states with majority-poor school systems include almost the entire South, as well as Oregon, Nevada, and California.

The study pointed out that “from 2001 through 2011, the numbers of low income students in the nation’s public schools grew by 32 percent – an increase of more than 5.7 million children. As a result, low income students attending the nation’s percent low income in schools
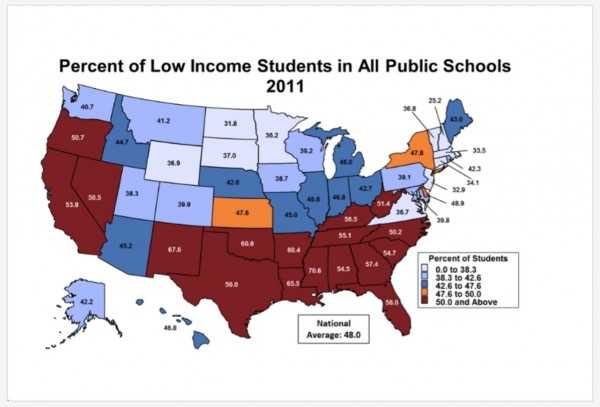
public schools moved from 38 percent of all students in 2001 to 48 percent in 2011.”

In Connecticut, the percentage of low income students in public schools was only 34 percent, among the lowest percentages in the nation.  Only four states had a lower or equal percentage – New Hampshire (25%), North Dakota (32%), New Jersey (33%) and Massachusetts (34%).

The largest percentage of low income students were in Mississippi (71%), New Mexico (68%), Louisiana (66%), Oklahoma (60%), Arkansas (60%), Georgia (57%), Kentucky (57%), Florida (56%), Alabama (55%), Tennessee (55%), South Carolina (55%) and California (54%).

Overall, the rates of low income students in the public schools, by region, was 53 percent in the South, 50 percent in the West, 44 percent in the Midwekids at school-st and 40 percent in the Northeast.  The national average was 48 percent. As the report pointed out, “in 2011 the nation stood within only two percentage points of enrolling a majority of low income students in public schools across 50 states.”

The study  also compared the rates of low income students in cities, suburbs and rural areas in each state.  In each of the nation’s four regions, a majority of students attending public schools in the cities were eligible for free or reduced lunch.

The Northeast had the highest rates for low income school children in cities: 71 percent. The next highest rate, 62 percent, was found in Midwestern cities. The South had the third highest percentage of low income students in the cities – 59 percent.  In Connecticut, 62 percent of students in the cities were low income students, compared with 26 percent in the suburbs and 13 percent in rural areas.

“Low income students are concentrated in the nation’s cities but are by no measure confined to only cities,” the study noted.  “Forty percent or more of all public school children in the nation’s suburbs, towns and rural areas are low income students.”

by region The report, released in October 2013,  indicated that low income students “generally are more likely to score lowest on school tests, fall behind in school, fail to graduate, and never receive a college degree,” and yet “the growth in the number of low income students far out-stripped the growth in per pupil spending in public schools during the last decade in every region of the country, except the Northeast.”  The nations per pupil expenditure (adjusted for inflation) in public schools increased by only 14 percent – less than half the rate of growth in the numbers of low income students,” according to the report.

The study concludes by stating that “The trends of the last decade strongly suggest that little or nothing will change for the better if schools and communities continue to postpone addressing the primary question of education in America today: what does it take and what will be done to provide low income students with a good chance to suc556419_282077021867473_1934636139_n
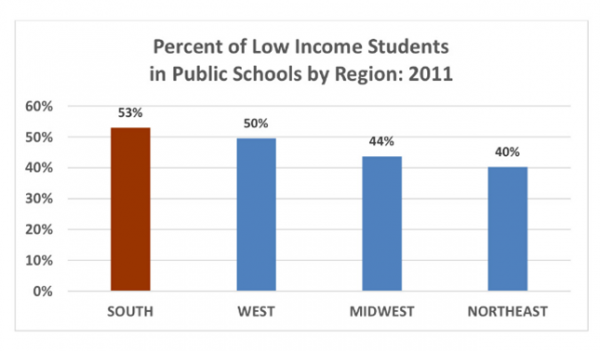
ceed in public schools? It is a question of how, not where, to improve the education of a new majority of students.”

The Southern Education Foundation’s mission is to advance equity and excellence in education for low income students and students of color.  The Foundation’s “core belief is that education is the vehicle by which all students get fair chances to develop their talents and contribute to the common good.”

CT Drops Among States But Exceeds National Average in Opportunities Available to Residents

A new report and analysis focusing on four “impact areas” of daily life – opportunity, economy, education and community - has determined that Connecticut exceeds the national average in each category, by at least five percentage points and as much as nearly seven.  Overall, the state ranked 13th in the U.S., with a score of 56.9 out of 100 in the study's index, designed to measure economic, academic, civic and other key factors.  The state ranked 10th a year ago, and is the only state to fall out of the top 10.

The top 10 states in the latest analysis are Vermont, Minnesota, North Dakota, New Hampshire, Nebraska, Iowa, Massachusetts, New Jersey, South Dakota and Maryland.   In addition to Connecticut, three other states (Montana, Oregon and Pennsylvania) dropped as many as three slots in the state-by-state rankings.

According to the report, developed by Measure of America  and Opportunity Nation, Connecticut did better than the national average in  mean household income, the number of banking institutions, and the percentage of households with high speed internet.  The state also exceeded the national average in the percentage of 3- and 4-year olds attending preschool and the percentage of the population (age 25 and older) with an associate degree or higher.  The unemployment rate in Connecticut was higher than the national average, but the percentage of the population with earnings below the poverty line was less than the average nationally.

Perhaps surprisingly, the percentage of students who graduate from high school on time (within four years) is below the national average – 75.1 percent in Opportunity-Nation-LogoConnecticut as compared with 78.2 percent nationally.

The Opportunity Index focuses on the conditions present in different communities and is designed to connect economic, academic, civic and other factors together to help identify solutions to lagging conditions for opportunity and economic mobility.  From preschool enrollment to income inequality, from volunteerism to access to healthy food, expanding opportunity depends on the intersection of multiple factors, Opportunity Nation's website explains.  The Index is designed to provide policymakers and community leaders with a powerful tool to advance opportunity-related issues and work, advocate for positive change and track progress over time.  

In the area of community health and civic life, the level of volunteerism among Connecticut residents exceeds the national average, as does the   number of primary care providers (per 100,000 population) and the percentage of adults who are involved in social, civic, sports and religious groups.  Violent crime is below the national average and the percentage of youth, ages 16-24, not in school and not working is also below the national average, at 12.3 percent as compared with 14.6 percent nationwide.

Nationally, almost 6 million young people are neither in school nor working, according to the study - almost 15 percent of those aged 16 to 24 nationwide who are neither employed or in school, the Associated Press reported.  In Connecticut, 12.3 percent of those aged 16 to 24 are not working either at a job or in class, the study found.

The study also determined that 49 states have seen an increase in the number of families living in poverty and 45 states have seen household median incomes fall in the last year, the AP reported.

13

More Children Killed, Wounded by Guns Across US; Study Suggests Handguns in Households Key Culprit

The conclusions and the statistics, in a study presented to the American Academy of Pediatrics were stark and sobering:

  • Hospitalizations and in-hospital deaths for children with gun shot wounds are increasing in the U.S.  Currently, over 7,500 children are annually hospitalized for gun shot wounds, including over 500 in-hospital deaths.
  • While recent policy proposals to limit military-style semi-automatic assault weapons are important, handguns remain the leading injurious agent and may be a more efficacious target.
  • There was a significant relationship between percentage of household gun ownership and percentage of gun shot wounds occurring in the home.chart_gundeaths_article_0
  • Policies designed to reduce the number of household firearms, especially handguns, may reduce childhood gun shot wounds. Household gun ownership and safety practices vary widely by state.

In “United States Gunshot Violence—Disturbing Trends,” researchers from Boston and Michigan reviewed statistics from the Kids’ Inpatient Database (KID) from 1997, 2000, 2003, 2006 and 2009 (for a total of 36 million pediatric hospital admissions), and estimated state household gun ownership using the most recent Behavioral Risk Factor Surveillance System data (2004).

Between 1997 and 2009, hospitalizatichild, gun
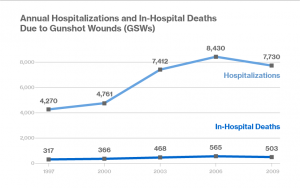
ons from gunshot wounds increased from 4,270 to 7,730, and in-hospital deaths from 317 to 503, the researchers found.  The study also found a significant association between the percentage of gunshot wounds occurring in the home and the percentage of households containing any firearms, loaded firearms and unlocked loaded firearms.

“Handguns account for the majority of childhood gunshot wounds and this number appears to be increasing over the last decade,” said lead study author, Arin L. Madenci, MD, MPH, University of Michigan Medical School. “Furthermore, states with higher percentages of household firearm ownership also tended to have higher proportions of childhood gunshot wounds, especially those occurring in the home,” Madenci told MSNBC.  Madenci, and his colleague, Dr. Christopher Weldon, a surgeon at Boston Children’s Hospital, conducted the research.

Among homes with childrenacademy_of_pediatrics_logo, rates of gun possession ranged from a national low of 10 percent in New Jersey, for instance, to 62 percent in Montana, the researchers found.

According to the Connecticut Office of Child Advocate, between January 1, 2001 and December 31, 2012 (a 12-year period), 94 children in Connecticut died from gunshot wounds. During that period 924 children were injured by guns. Nearly half, 44 percent, died in Hartford, New Haven or Bridgeport, or towns nearby the report noted.  Just over one-third (36 percent) involved children between 2 and 14 years old.  The datawas issued a month after the murder of 20 school children and six adults in Newtown.  "The circumstances of the other 74 child deaths and the vast majority of injuries from guns in this state," the Child Advocate report said, " are very different - single incidents ... with roots in factors underlying community violence."

“Policies designed to reduce the number of household firearms, especially handguns, may more effectively reduce the number of gunshot injuries in children,” said Dr. Madenci.


Stamford is #1 in USA in Workers with College Degree; Geography Key to Job Prospects

Stamford ranks first in the nation in the percentage of workers with a college degree, according to a  book that features an analysis of  the influences of geography on jobs, highlighting tremendous disparities that exist in cities across the country and citing innovation as a key jobs driver.

 “The sheer size of the differences between American communities is staggering," the book stated. " Stamford, Connecticut, the city with the largest percentage of college-educated workers in the United States, has five times the number of college graduates per capita as the city at the bottom, Merced, California.”

The New Geography of Jobs, written by Enrico Moretti, a professor of Economics and the University of California, ranked 306 of the nation’s metropolitan areas.  In the ranking, Waterbury was among the metropolitan areas with the smallest share of workers with a college degree, at 15 percent.

Stamford, with 56 percent, led the list, topping Washington, DC (49%), Boston (47%), Madison (47%) and San Jose (47%), which rounded out the top five metropolitan areas in the country.  Completing the top 10 metropolitan areas with the largest share of workers with a college degree is Ann Arbor (46%), Raleigh-Durham(44%), San Geograpgy-Jacket-ImageFrancisco-Oakland (44%), Fort Collins-Loveland, Colorado (44%), and Seattle-Everett, Washington (42%).  Yuma, AZ and Merced, CA, both at 11 percent, ranked last.

Moretti’s research and analysis reveals that the “new geography of jobs is benefitting centers of innovation,” and “among the beneficiaries are the workers who support the idea creators.”  He indicates that “for every new innovation job in a city, five additional non-innovation jobs are created, and those workers earn higher salaries than their counterparts in other urban areas.”

According to the book, the average salary of college graduates in Stamford is $133,479 and the average salary of high school graduates is $107,301.  Moretti points out that “the more college graduates there are (in a metropolitan area) the higher the salaries for high school graduates are.”  Overall, “the earnings of a worker with a high school City of Stamfordeducation rise by about 7 percent as the share of college graduates in his city increases by 10 percent,” a statistical analysis indicates.

Morelli also notes that the education level of the workforce not only impact salaries, but also the level of charitable contributions.  “Among large U.S. metropolitan areas, charities in five brain hubs – Stamford, Boston, Raleigh-Durham, Washington, D.C., and New York – receive the highest contributions relative to their population.”

The book also ranks Stamford as the metropolitan area with the second highest cost of living in the nation, behind only San Jose, CA, and just ahead of San Francisco-Oakland-Vallejo, California.  Also in the top 20 cities with the heist cost of living is Bridgeport, at number 17.

The New Geography of Jobs was published by Houghton Mifflin Harcourt in 2012. Moretti is Professor of Economics at the University of California, Berkeley where he holds the Michael Peevey and Donald Vial Career Development Chair in Labor Economics. He is the Director of the Infrastructure and Urbanization Program at the International Growth Centre (London School of Economics and Oxford University).

CT Should Look to New York, Aging Workforce, Urban Centers to Rebuild Economy

Connecticut would be foolish not to take greater advantage of the fact that nearly one-third of the state is within the financial orbit of New York City as it looks to rebuild its economic strength – while not overlooking the potential for entrepreneurial activity across the state.

Those were among the lead suggestions of a panel of economists and entrepreneurs at the University of Hartford looking at job prospects for today’s 20-somethings, in a program sponsored by CT Mirror.

Daniel Kennedy, Senior Economist in the Office of Research at the state Department of Labor emphasized that the strongest economic growth in the state in the years to come will be in Fairfield County, and evidence of that trend is already present in the current economic recovery.

Wayne Vaughn, president of Hartford-based Fuscient, which he launched in 1997, said the state should “play to its strengths,” in looking to Fairfield County.  He said that New York City's immense economy "bleeds over into one-third of our state."  He also called on the state’s colleges and universities to step up efforts to match students with mentors in the business community, to improve their workforce readiness.

The state’s college graduates should not sell the state short, offered Katelyn Anton, Community Manager of New Haven-based Independent Software, and a key contributor to Whiteboard, a popular blog for the technology and entrepreneurial community in the state.  “Connecticut is one of the ripest locations in the world,” for start-up ventures, she said, panelnoting the growth of co-working spaces in New Haven, Hartford, Bridgeport, Manchester and other communities, and the numerous incubator opportunities that individuals “can tap into.”

Connecticut Business and Industry Association (CBIA) economist and vice president Peter Gioia predicted that the state’s economy is “on the cusp of turning the corner,” noting that between 15 and 20 percent of today’s workforce will be retired within five years – creating job vacancies and opportunities for young people.  He predicted that as the workforce ages out of the market, the state’s workforce will need electrical line workers, plumbers, electricians, commercial loan officers, actuaries and financial planners, and some of that need is already apparent.

Gioia praised the state’s recent efforts to bolster the University of Connecticut and the state’s community colleges, underscoring the correlation between “where students go to school and where they get their first job.”  If students stay in the state for college, Connecticut businesses will ultimately benefit.

Kennedy said the state’s prolonged economic recovery is characterized by continued “demand deficient unemployment,” which is more structural than merely a reaction to the national downturn that began in 2008.  He indicated that even as some sectors are improving, many millennials remain underemployed -college graduates working in service, rather than professional, industries.

“More people are working, but they’re not making as much,” said Orlando Rodriguez, a senior policy fellow at Connecticut Voices for Children.  “For every job we lose in the financial industry, it takes eight and a half jobs in the restaurant industry.”

Rodriguez also raised a cautionary note, stating that Connecticut should be particularly concerned about young people in the state’s urban centers who do not attend college, and often are unable to obtain a first job. While statewide unemployment hovers around 8 percent, it can run as high as 40 percent among 18-24 year olds in Bridgeport and other urban communities. “Connecticut’s future,” Rodriguez said, “is in urban areas.”

Gioia was strongly critical of Congressional inaction on immigration reform, stating that the nation’s economy would be strengthened by a comprehensive policy.  “Immigrants are much more likely to start a business, and become net employers of Americans.”  He said the policy of educating foreign students, but not permitting them to then remain in the U.S., as “ridiculous.”  He also cited Canada as an example of a nation that has been more welcoming of immigrants, to the benefit of the nation’s economy.

Vaughn said that while his biggest challenge in doing business in Connecticut is retaining talent, the growth of technology in business transactions offers businesses here significant opportunities.  “Where your business is located doesn’t dictate who your customers are,” he said.

The discussion was the second of nine panels on a range of topics sponsored by The Connecticut Mirror to be held around the state in coming months.  It was moderated by Brett Ozrechowski, CEO-Publisher of the CT News Project, which operates CT Mirror.  Next month, discussions will be held  Nov. 7 at Fairfield University focused on measuring good teaching and Nov. 18 at the University of New Haven on the topic of the clean energy economy.

Connecticut “Ideas Worth Spreading” Resonate in Massachusetts in TED Talks

TED came to Springfield, Massachusetts this month with a decidedly Connecticut flavor, as a quarter of the featured speakers offering “ideas worth spreading,” hailed from the “still revolutionary” state.

Of the 16 “TED talks” on the agenda during a day-long program sponsored by and held at the headquarters of Mass Mutual, four of the speakers were from Connecticut, and left the specially selected audience intrigued, impressed and inspired.

keishaWell known worldwide, TED is a nonprofit which began decades ago with a conference bringing together people from three worlds: Technology, Entertainment, Design. Since then its scope has become considerably broader, and “TED Talks” – widely available on the web – have become a global phenomenon, watched by tens of millions.

TED conferences “bring together the world's most fascinating thinkers and doers, who are challenged to give the talk of their lives.”  That’s precisely what occurred at TEDx in Springfield, where in addition to speakers touting the possibilities for that post-industrial urban center, a wide array of innovative subjects were featured under the theme “Driving innovation through diversity and inclusion.”

The Connecticut quartet at TEDx Springfield:

  • Keisha Ashe is co-founder and CEO of ManyMentors, a nonprofit science, technology, engineering and math STEM) mentoring organization that connects minority and female middle and high school students with encouraging and suppormaureen connolly phototing near-age mentors in the STEM fields.  “If they never know, they’ll never go,” is the guiding phrase of the initiative, reflecting the fact that many women and minority students are not encouraged to pursue the STEM fields, and are often unaware of the career potential or their own aptitude for the STEM careers.  Ashe is a Ph.D. candidate in Chemical Engineering at UConn.
  • Maureen Connolly is an event planning professional with extensive national and international experience across diverse markets, and a visionary and passionate leader skilled at creating high impact programs with measurable results.  She is the foremost advocate for utilizing public celebrations as a means of extending social capital by having the community, rather than the event, at the core of planning.  She has written on the enduring transformational potential of public celebrations, and offers that “now is the time to harness that collective energy and accumulated social capital as a catalyst for social change” that will develop collaborations with the potential to breathe new life into hard-pressed cities.david ryan polgar
  • David Ryan Polgar is a Connecticut-based writer/attorney/educator and highly regarded tech ethicist who speaks on the topics of information overload, digital diets, and creativity.  He is an award-winning columnist for Seasons magazine, and has been featured in national media. Polgar speaks and writes about the ethical, legal, sociological, and emotional issues surrounding our relationship to technology.  He has created a “Mental Food Plate” as an approach to achieving deeper levels of thinking, and explores the imperative for an industry to develop that will serve as a counterbalance to the burgeoning technologies that “we can’t stop consuming.”
  • Jon Thomas is the founder of Tap Cancer Out, a Brazilian Jiu-Jitsu nonprofit and host of the most philanthropic martial arts events in the world.  Jon Thomas and his wife Becky run the Stratford-based nonprofit “in the slivers of spare time between their jobs in advertising.”  The nonprofit was founded out of a desire to respond to the devastation of cancer through a sport that Thomas was deeply involved with.  The organization raises funds – all donated to the Leukemia & Lymphoma Society - through hosting fundraising tournaments, direct donations, merchandise sales and sponsorships.tap cancer out

The TED website points out that “TED is best thought of as a global community, welcoming people from every discipline and culture who seek a deeper understanding of the world.”  TEDx Springfield was organized by Jae Junkunc of Hartford, from Mass Mutual's Enterprise Risk Management Group, with support of a 15-member team that developed the program over six months.

TED includes the award-winning TED Talks video site, the Open Translation Project and TED Conversations, the inspiring TED Fellows and TEDx programs, and the annual TED Prize. The TEDx program gives communities, organizations and individuals the opportunity to stimulate dialogue through TED-like experTEDx logoiences at the local level. The TED Conference provides general guidance for the TEDx program, but individual TEDx events are planned and coordinated independently.

A TEDx session in Hartford in June included talks by David Fink of Partnership for Strong Communities, Steven Mitchell of East Coast Greenway, Donna Berman of Charter Oak Cultural Center, and Rich Hollant of CO:LAB, among sixteen local speakers.

WNBA Leads Major Sports in Gender, Racial Diversity; Baseball Mirrors Society Best

The WNBA received a combined grade of A+ for race and gender diversity, after earning and A+ for race and an A+ for gender in the 2013 WNBA Racial and Gender Report Card, produced by The Institute for Diversity and Ethics in Sports (TIDES) based at the University of Central Florida.

The study provides an analysis of the racial breakdown of the players and management in the league office and at the team level. It also looks at team general managers, coaching staffs and other support personnel.

Meanwhile, the Institute’s comparison of the racial breakdown of players in major league baseball, the National Football League and the National Basketball Association, alswnba_logo_detailo released this month, shows that baseball has a demographic breakdown that more closely reflects the nation’s demographics. But the most diverse league – in terms of players as well as the front office – is the WNBA.

Richard Lapchick, the director of TIDES and primary author of the report, said, “The WNBA continues to set the standard for racial and gender diversity amongst all professional leagues.”

Among the key statistics compiled by TIDES highlighting the WNBA:racial-diversity-in-professional-sports_5255f9324cb41

  • At 67 percent, women held the highest percentage of assistance coaching positions in the history of the WNBA, setting a new mark for the second consecutive year.
  • The percentage of people of color holding professional level staff positions in the WNBA League Office increased from 29 to 33 percent while the percentage of women increased by 8 percentage points.
  • WNBA players of color increased by five percentage points in 2013.
  • Nine women and seven people of color had ownership positions on a WNBA franchise in 2013.  Most were limited partners.
  • The number of women in the top management role increased from two to five women CEO/Presidents from 2012 to 2013.

Locally, of the 24 individuals highlighted on the Connecticut Sun website as members of the team staff, 12 are women and two are individuals of color.  The CEO and VP/General Manager are men, and the head coach, Anne Donovan, is a woman.

Laurel J. Richie, tmlb-logohe first woman of color to become president of a professional sports league, continued the WNBA’s tradition as professional sports’ most diverse organization.  Richie, a veteran marketing executive, brought more than three decades of experience in consumer marketing, corporate branding, public relations and corporate management, when she was appointed President of the WNBA, in 2011.

Many would argue that baseball is no longer "America's Pastime", but strikingly the racial composition of the average major league team corresponds almost perfectly to their proportions in American society, the Institute noted.“It truly is the game that looks like America the most, the other major sports leagues do not even come close,” the organization pointed out, as reflected in an Infographic on the website visually.

The WNBA Racial and Gender Report Card is the third report issued thus far in 2013 after the releases of the reports on Major League Baseball and the National Basketball Association earlier this year.

CT is Top 10 State in Percentage of Seniors in Workforce;Both Men and Women Highly Ranked

Connecticut is among the nation’s leading states in the percentage of senior citizens – men and women age 65 or older – still in the workforce.  The Land of Steady Habits placed in the top ten for both men and women, and showed increases in the percentage of seniors in the workforce compared with 2000, reflecting a national trend.

Connecticut is ranked 9th in the nation in the percentage of female senior citizens in the workforce, with 14.7 percent.  The state is 7th nationwide in the percentage of male senior citizens in the workforce, with 23.8 percent.

Looking at the percentage of senior female workers, the top ten are AlasTop 10 words over white backgroundka (with 20.7%), Nebraska, District of Columbia, South Dakota, Wyoming, New Hampshire, Hawaii, Maryland, Connecticut and North Dakota.  The lowest percentage was in Michigan at 9.2 percent.

In Connecticut, 9.2% of women age 65-69 are working, 3.3% of women age 70-74, and 2.2% of women 75 years old or older.  The overall percentage of women seniors in the workforce in Connecticut increased from 9.9% in 2000 to 14.7% in 2011.

Using U.S. Census data, Bloomberg.com ranked the U.S. states and the District of Columbia based on thworkinge percentage of female seniors employed.  Figures are calculated by dividing the number of females aged 65+ and employed by total population of females aged 65+.   The male population was calculated in a similar fashion.

Connecticut ranked 7th in the nation in the percentage of male senior citizens in the workforce.  Data for male senior citizens indicate that in Connecticut, the overall percentage in the workforce is 23.8 percent, with 13.3% of those age 65-69, 5.6% of those 70-74 and 4.4% of male seniors age 75 or older still working.

The top ten states in the percentage of male senior citizens in the workforce are District of Columbia, Nebraska, South Dakota, Kansas, North Dakota, Maryland, Connecticut, Vermont, Alaska and Massachusetts.  The lowest percentage was in West Virginia, with 13.5 percent.