Connecticut's downtowns have a wealth of potential to redevelop under-utilized buildings into housing above commercial space - if mixed-use development can be encouraged through financing and favorable regulations, according to a new report from the Connecticut Main Street Center (CMSC).
The report comes at the conclusion of the first year of Come Home to Downtown, a pilot program CMSC established to encourage and facilitate viable, interesting housing opportunities while revitalizing downtown neighborhoods. The initiative was contracted by the Connecticut Housing Finance Authority (CHFA) to promote housing in Connecticut's downtowns.
Three communities - Middletown, Torrington and Waterbury - as well as three property owners and their buildings, were selected as the focus of the program’s inaugural year. CMSC chose buildings typically found throughout Connecticut so they could serve as models for other towns. As a result, most of the findings expressed in the report apply to any Connecticut downtown wishing to maximize the potential of its existing infrastructure.
Among the key findings, the report indicates that mixed-use development is among the most challenging, and private owners are often in a “catch-22” as they seek financing. Downtown management capacity is critical to the success of mixed-use development, the study found. In addition, the CMSC report explains that even when zoning regulations promote redevelopment, they are often not enough to enable mixed-use growth and a severe lack of financing impedes the growth of much-needed mixed use development.
"CMSC's report provides insights that will guide future housing development on Main Streets across Connecticut. The first year of the Come Home to Downtown program is not only creating opportunities to establish new rental housing in downtown neighborhoods, it's creating a model for other communities to follow," said Eric Chatman, President & Executive Director of CHFA, which has contracted with CMSC for a second year of the pilot program, which will focus on finding and creating financing.
The report's seven key findings are:
1. There is a huge amount of potential for accommodating mixed-use development - which both saves and generates monies - in Connecticut's downtowns. According to the U.S. Environmental Protection Agency, the infrastructure costs to service compact, dense development like that found  in mixed-use neighborhoods are one-third to one-half lower than in suburban areas. It has been estimated that every downtown in Connecticut has at least one building that is under-utilized, containing a store or restaurant on the first floor, but with upper floors that are vacant or used for storage that could instead generate income if converted to apartment homes.
2. Mixed-use development is one of the hardest types to accomplish. There are several reasons why this is the case: these buildings are usually older and in need of greater rehabilitation; they are in need of complex financing from multiple sources; combine several uses in one building (such as housing and retail space); and are often owned by people with little to no redevelopment experience.
3. A severe lack of financing impedes the growth of mixed-use development. Because these deals are so intricate and multi-faceted, financing for the total development costs rarely exists from traditional sources.
4. Education and outreach to owners of possible mixed-use property is needed. Property owners are often unprepared for the complex process of redeveloping their building and unaware of the potential benefit in doing so. Very often, they also need assistance learning how to become landlords and attract good tenants.
5. Private-owners are in a catch-22 when it comes to obtaining financing. With regard to apartment homes located in mixed-use buildings, private owners can either apply for subsidies if they place income/affordability restrictions on the apartments, or the units are not restricted, but there is no subsidy for apartments at the same rental rate.
6. Even when zoning regulations promote redevelopm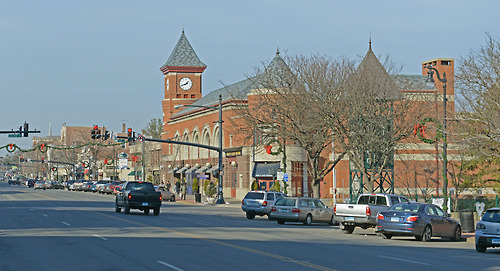 ent, they are often not enough to enable mixed-use growth. Favorable zoning regulations are important, but they cannot create mixed-use development by themselves. Each of the pilot communities had zoning policies that allowed for buildings with a mix of uses - a practice which should be commended and encouraged - but there were still significant impediments to promoting this type of growth. In addition, lessening current on-site parking requirements as a whole will also help promote housing in our downtowns.
7. Downtown management capacity is critical to the success of mixed-use development. Any community interested in promoting revitalization of its downtown should consider enhancing its management function by becoming a resource center for mixed-use development, including convening key stakeholders, collecting data, offering education and information and coordinating development incentives.
"There is now a better understanding of what the next steps need to be, and a greater appreciation of the importance of the public-private partnership that is necessary to overcome the challenges and achieve reuse of these properties," Rose Ponte, Torrington's former Director of Economic Development, said about the new report.
Engaging an expert team of consultants, CMSC worked with municipal officials and the building owners to develop viable redevelopment options including: determining what financing would likely be needed for redevelopment; performing an assessment of zoning and regulatory requirements; reviewing the downtown management function; and measuring the downtown's walkability. Specific recommendations for improving the buildings, including a recommended floor plan designed to attract new residents and bring market rate housing downtown, was also provided to each property owner.
Once rehabilitated, these buildings will create 60 new units of rental housing in downtown Middletown, Torrington and Waterbury, as well as make approximately 25,000 square feet of commercial and retail space available. The total development cost to renovate all three buildings is estimated to be $11.4 million.
"You see it on an almost daily basis - news articles and reports showing the demand, especially among Millennials and Baby Boomers who want to live in walkable, interesting places. It doesn't seem to matter if the downtown is large or small, as long as they can live there and get around without a car to go to the movies, grocery store or coffee shop, that's where people want to be these days," said John Simone, CMSC President & CEO.
In the pilot program’s second year, CMSC will choose two new communities while continuing to work with the property owners and municipal officials in Middletown, Torrington and Waterbury.


 e for Highway Safety reports that 29 states and the District of Columbia have additional license renewal procedures for older drivers, often age 65 or 70 and older. In Connecticut, people 65 and older may choose a 2-year or 6-year renewal cycle. A personal appearance at renewal generally is required. Upon a showing of hardship, people 65 and older may renew by mail. There are no additional requirements for older drivers, according to the Insurance Institute.
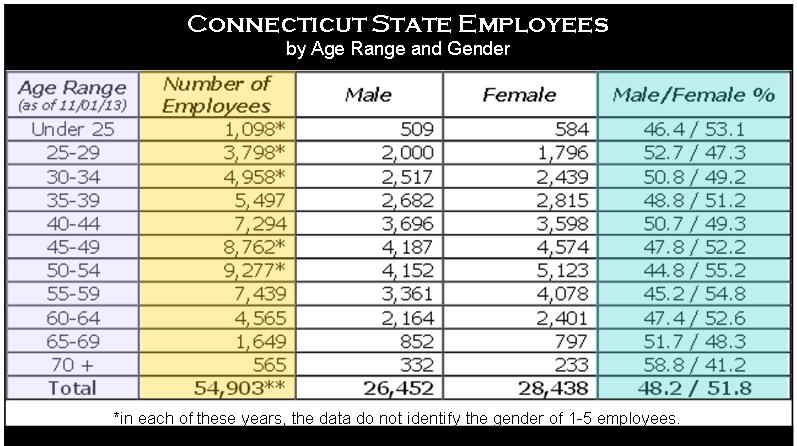 tate governments across the country are growing at a considerably slower rate than the private sector – which is true in Connecticut as well, where public sector jobs have been shed in recent years.
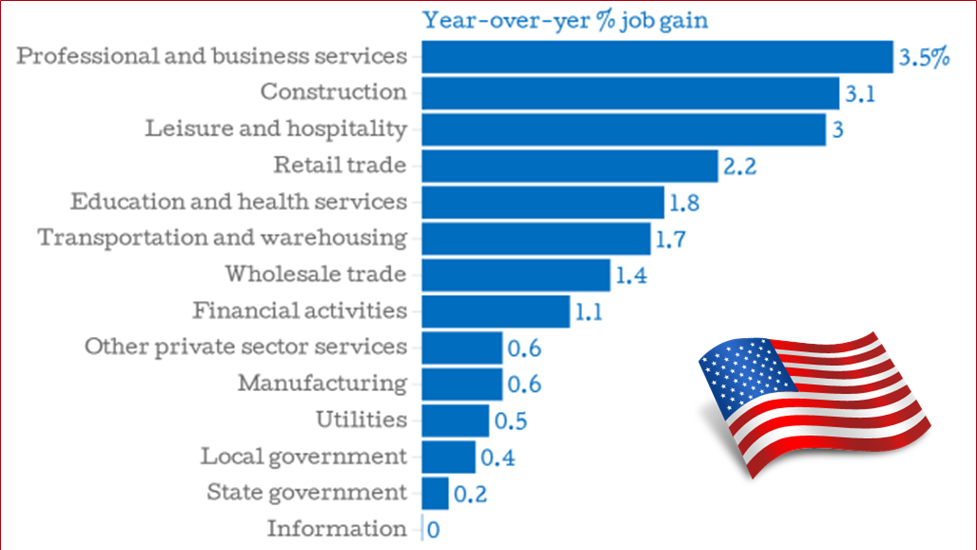
 rence of municipal leaders devoted solely to exploring entrepreneurship.
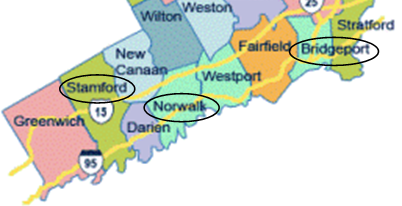
 sbury in 2013 and 2011, and Cheshire in 2013 and 2011. Single appearances were made by Norwalk, Stamford, Portland, Tolland, Greenwich, South Windsor, Fairfield, and most recently, Brookfield.
 Hartford at #55. The town was joined by Stamford at #78, Hamden at #87, and Norwalk at #90.


 percent.)
 ts of both political parties into mayoral offices in cities and towns across the landscape?
 tors frequently confronted devastating epidemics that wiped out many of the members of their groups; at such times, having a healthy leader might have been particularly important,” they wrote recently in
 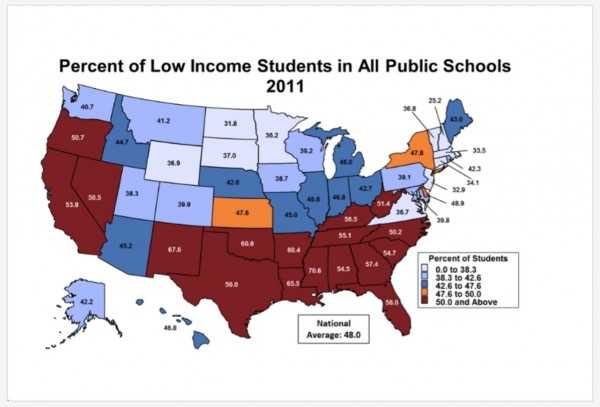 public schools moved from 38 percent of all students in 2001 to 48 percent in 2011.”
 st and 40 percent in the Northeast. The national average was 48 percent. As the report pointed out, “in 2011 the nation stood within only two percentage points of enrolling a majority of low income students in public schools across 50 states.”
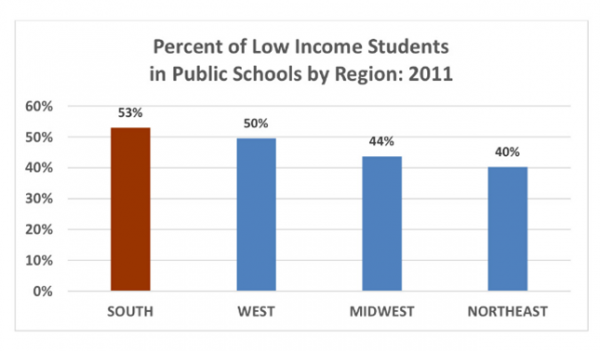
 ceed in public schools? It is a question of how, not where, to improve the education of a new majority of students.”