Who Knew? Northeast is Hotbed of Entrepreneurial Activity, For Some More than Others
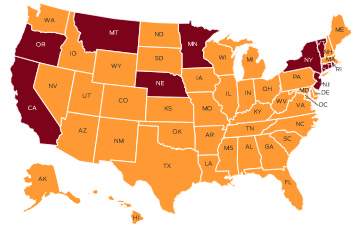
Takes one to know one. Or, more accurately, know one and you may become one. That’s the bottom line of an exploration into entrepreneurship by a Kauffman Foundation researcher, who found that the Northeast is the best place to catch the entrepreneurial bug. As Connecticut sinks increasing dollars into initiatives to encourage entrepreneurship, develop jobs, and turn ideas into businessentrepreneurses (often with state financial incentives) the report offers guidance of factors influencing the frequency of entrepreneurial launches.  Connecticut Innovations,  established and supported by state government,  helps Connecticut businesses grow through creative financing and strategic assistance,  and is the nation's sixth most-active early stage investor.

The survey indicated that the likelihood of a person knowing entrepreneurs varied widely by location, income, gender, and age. Respondents were much more likely to know entrepreneurs if they were male, had modest income, or were middle-aged. And they were much less likely to know entrepreneurs (or be entrepreneurs) if they were female, had a higher income, or were located in the Midwest or South.

The study suggests that there could be “material increases in entrepreneurship simply through doing a better job of exposing people to existing entrepreneurs, especially peers or contemporaries.” Entrepreneurship grows, the study found, where it is planted.

Key factors to consider when attempting to encourage entrepreneurship, according to the study:

  • Women have less exposure to growth entrepreneurs than men
  • The young have much more exposure to growth entrepreneurs
  • People in lower income strata are much less likely to be exposed to growth entrepreneurs

The study concluded that “In all cases, an individual’s exposure to entrepreneurs—and to growth entrepreneurs in particular—may increase his or her likelihood of being one. Entrepreneurship can be viral, but must be introduced early and often in environments where it is least often seen.”

The study distinguished between entrepreneurial companies and “growth entrepreneurial companies,” those companies growing more than 20 percent a year and with more than $1 million in sales, generate more employment and contribute more to wealth and GDP than do slower-growing ventures.

The likelihood of a respondent reporting knowing an entrepreneur by Region 
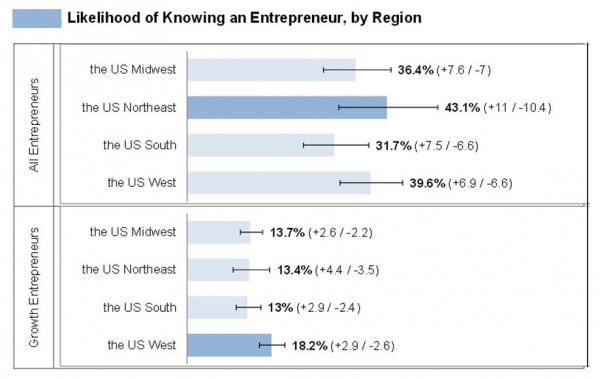
in the United States was 36.7 percent. The likelihood of knowing a growth entrepreneur was considerably lower, at 15.4 percent.

When broken down by gender, the likelihood of males knowing an entrepreneur was 39.9 percent, females 35.8 percent. For growth entrepreneurs, the gender gap was considerably wide, 24.8 percent to 12.1 percent.

A year ago, CTNext, Connecticut’s innovation ecosystem managed by Connecticut Innovations (CI), announced the launch of the Entrepreneur Innovation Awards (EIA), a competitive pitch process that provides awards up to $10,000 to entrepreneurs in Connecticut for growth-related activities. CI helps innovative companies in four key ways: by offering equity, debt, grants and strategic guidance.

A month ago CTNext announced the winners of the latest round of EIA awards; Connecticut-based companies and entrepreneurs, received $10,000 for their project ideas. CI also selected David Wurzer, formerly a senior managing director at CI, to be chief investment officer and executive vice president. As part of his new role, Wurzer will be responsible for the management of the investment function, staffing needs, portfolio and risk management, outreach to stakeholders, budget planning and performance measurement.

The study “Getting the Bug: Is (Growth) Entrepreneurship Contagious?” was conducted by Paul Kedrosky of the Kansas City-based Kauffman Foundation, and is aimed at providing data to guide efforts across the country to grow entrepreneurship. The survey, which categorizes responses of 2,000 individuals by age, income, gender, and location, was done via Consumer Google Survey.

Tolland County is Healthiest in Connecticut, Fairfield Next, Report Finds

The healthiest county in Connecticut is Tolland County, according to a new report analyzing health data from nearly every county in the country. The 2014 County Health Rankings & Roadmaps ranked Connecticut’s eight counties by health outcomes and health factors. According to the report, health outcomes represent how healthy a county is while health factors represent what influences the health of the county.

county_health_ranking_300In health outcomes, Tolland County led the way, followed by 2)Fairfield County, 3)Middlesex County, 4)Litchfield County, 5)New London County, 6)Hartford County, 7)Windham County and 8)
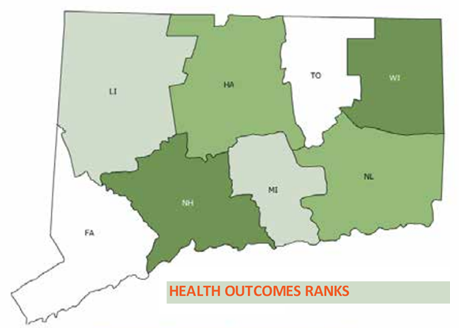
health outcome ranksNew Haven County.

In health factors, Middlesex County ranked first, followed by Tolland County, Fairfield County, Litchfield County, New London County, Hartford County, New Haven County and Windham County.

The County Health Rankings & Roadmaps program helps communities identify and implement solutions that make it easier for people to be healthy in their schools, workplaces and neighborhoods, according to study authors. The Robert Wood Johnson Foundation collaborated with the University of Wisconsin Population Health Institute on the state-by-state analysis and report, which measured the health of nearly every county in the nation.

The report website includes “county snapshots” - detailed data for each county, in each of the health factors and health outcomes. Comparisons between counties, and the statewide numbers, are also available.ranks

Health factors data included in the analysis are health behaviors, such as tobacco use, diet and exercise, and alcohol and drug abuse; clinical care, including access to care and quality of care; social and economic factors, including education, employment, income, safety and family support; and physical environment, including air and water quality, housing and transit. Health outcomes date included length of life, and quality of life, with factors such as physical health and mental health.

The report website provides specific data in each of the categories, and ranks Connecticut’s eight counties in each factor. This year’s Rankings release marked the fifth anniversary of the first national release of the County Health Rankings.

Hartford Ranked #35, New Haven #39 in Income Inequality Among US Cities; Bridgeport-Stamford-Norwalk Is Nation's Most Disparate Region

A new analysis ranking the cities with the greatest income inequality includes Hartford and New Haven in the top 50.– and the Bridgeport-Stamford-Norwalk metropolitan area is the metro region with the largest income disparity in the nation.

The major cities with the most dramatic income inequality in their population are, ranked in order:  Atlanta, New Orleans, Miami, Jackson (Mississippi), Gainesville (Florida), Tampa, Cincinnati, Athens (Georgia), Providence, Berkeley and Boston.  Seven of the top 11 are cities in the Southern U.S.

Among New England cities, Providence ranked #9, Boston at #11, Cambridge at #12, Hartford at #35, and New Haven at #39.  Among other major cities, New York ranked #13 and Washington, D.C. ranked #15.

Bloomberg ranked 300 U.S. cities with populations of at least 100,000income-inequality-shutterstock_146836310 
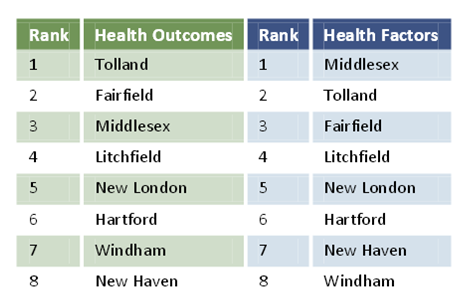
based on their level of income inequality and identified the 50 with the greatest inequality. The media outlet also ranked the top 20 metropolitan areas with the greatest income disparity.

On that list, Bridgeport-Stamford-Norwalk ranked as the metro area with the most income inequality in the nation.  Among the 20 regions with the greatest disparity, one-quarter are in Florida – including Naples-Marco Island at #2 and Gainesville at #3.  College-Station-Bryan (Texas) was #5 and New York-Northern New Jersey was #5 on the list of metro areas. 

They methodology for the analysis was use of the “Gini coefficient,” which is calculated by the U.S. Census from household income share by quintiles, used to measure distribution of wealth. It ranges from zero, which reflects absolute equality, to one, complete inequality.

Hartford’s Gini coefficient was 0.5176, New Haven’s was 0.5144.  By comparison, Atlanta’s was 0.5882, and Providence 0.5445.  New Haven’s income inequality improved slightly, by 5.4 percent, since 2008, while Hartford’s disparity grew slightly, by just over 1 percent, according to the data.

The Bridgeport-Stamford-Norwalk region had a Gini coefficient of 0.5459.

It was reported that in New Haven, 26.1 percent of the population was living in poverty; in Hartford the figure was 38 percent.  In Hartford, 54 percent of household income was in the highest quintile, while 2 percent was in the lowest quintile.  In New Haven, 38 percent was in the highest quintile while 2.5 percent placed in the lowest.

In the ranking of the 50 cities with the most income inequality, Hartford was between Lafayette, Louisiana and Cleveland, OH.  New Haven ranked between Charleston, S.C. and Tulsa, OK on the list.

The average score for the United States was 0.4757. In 2013, a person living alone making less than $11,490 was classified as in poverty. The threshold increased by $4,020 for each additional household member, Bloomberg reported.

Encore Entrepreneurs – Over 50 and Building New Businesses

Mix a relatively slow economy and a shortage of jobs with a large number of aging boomers looking for meaning and purpose in their work. The result is a growing number of “encore entrepreneurs” seeking to launch income-generating ventures that make a positive difference in their communities.

That has led the U.S. Small Business Administration (SBA) and AARP to launching a strategic alliance to provide counseling and training to entrepreneurs over the age of 50 who want to start or grow a small business.   AARP

April is Encore Entrepreneur Mentor Month, and would-be “encore entrepreneurs” will have the opportunity to connect with a number of organizations and community leaders for advice and assistance in their endeavors as part of seminars held as part of the AARP-SBA initiative.

Next up in Connecticut:  a free seminar, Want to Start or Grow a Small Business?, at the Hartford Public Library on Wednesday, April 23, 2-4 PM, at 500 Main Street.  Space is limited. Interested individuals can register online or call toll-free 877-926-8300.   There will also be a session in New Haven on May 15.

For many Americans born between 1946 and 1964, retirement has a very different meaning than it did a generation ago.   According to a USA Today/Gallup poll, 63% of American adults plan to work in retirement; two-thirds say enjoyment of work is the key reason. With years of valuable work experience, maturity, and plenty of energy at their disposal, today's older workers are increasingly finding financial and personal fulfillment in running their own small businesses.entrepreneur

New research released by Encore.org (formerly Civic Ventures) and funded by the MetLife Foundation shows:sba-logo-300x121

  • Approximately 25 million people – one in four Americans ages 44 to 70 – are interested in starting businesses or nonprofit ventures in the next five to 10 years.
  • More than 12 million of these aspiring entrepreneurs are potential encore entrepreneurs who want to make a positive social impact as well as a living.  Potential encore entrepreneurs have realistic financial expectations and plan local, small ventures to meet needs in their communities.
  • These aspiring entrepreneurs bring a lot of experience to the table, including an average of 31 years of work experience and 12 years of community involvement. Additionally, five out of six report having management experience – 15 years on average.

A 2010 survey by the Kauffman Foundation found that Americans 55 to 64 start new business ventures at a higher rate than any other age group, including 20-somethings. Fully 23 percent of new entrepreneurs were age 55 to 64, up from 14 percent in 1996.

The first event in Connecticut was held in Bridgeport in late January, followed by Danbury in early April.  An additional program is slated for New Haven on May 15 (2 to 4 PM) at Gateway Community College.

In Search of Adventure: A Children’s Book Diversity Mystery

In 2012, 93 percent of children’s books written that year were written about white characters, according to a study by the Cooperative Children’s Book Center.  There were 3,600 children’s books written that year.

Apparently the hue and cry were insufficient to change the inertia of insensitivity to the range of skin colors on American children.  A similar study in 2013, recently highlighted in The New York Times, found the following:  of 3,200 children’s books published last year, just 93 were about black people and 57 were about Latinos.  The Cooperative Children’s Book Center is at the University of Wisconsin. PowerpointGraphic1

A well-circulated illustration by Tina Kugler, spurred by the 2012 numbers, highlighted them:

  •   3% were about Africans/African Americans; 1.8% were written by Africans/African Americans
  •   1.5% were about Latinos; 1.6% were written by Latinos
  •   Less than 1% were about American Indians; less than 1% were written by American Indians
  •   2% were about Asian Pacifics/Asian Pacific Americans; 2.3% were written by Asian Pacifics/Asian Pacific Americans

Back in 2008, a study by Brigham Young University found that “characters depicted in Newbery winners are more likely to be white, male and come from two-parent households than the average U.S. child,” according to published reports.  The Newberry Award is the annual top honor for children’s literature.

At the time, Bloomberg News reported the following:  The Chicago-based American Library Association has awarded the Newbery Medal to one book annually since 1922. All Newbery books remain in print, underscoring their enduring nature. Their popularity with teachers and parents means that for many younger children, Newbery medalists are a primary way they learn about the world and how to relate to others.

Writing in The New York Times, author and illustrator Christopher Myers pointed out last month that children “are much more outward looking.  They see books less as mirrors and more as maps.  They are indeed searching for their place in the world, but they are also deciding where they want to go.  They create, through the stories they’re given, an atlas of their world, of their relationships to others, of their possible destinations. … Children of color remain outside the boundaries of imagination.  The cartography we create with this literature is flawed.”

The National Education Association has added to its website “50 Multicultural books every child should read.”  The most recent title, for children from preschool to age 12, was written in 2009.diversity_tinakugler

Locally, Eastern Connecticut State University associate professor of English Dr. Raouf Mama is recipient of the 2008 National Multicultural Children's Book Award from the National Association of Multicultural Education.  The author of children’s books and master storyteller, a native of Benin, Dr. Mama performs African and multicultural stories, blending storytelling with poetry, song, music, and dance.   An orator out of the African oral tradition, he also lectures on African literature and African folklore and conducts workshops on storytelling and creative writing, and the power of folktales as multicultural teaching and learning tools, especially as tools for teaching literacy skills, creative writing, and public speaking.

When the American Association of School Librarians had their National Conference & Exhibition in Hartford last fall, the issue was on the agenda.  One of the conference session’s dealt specifically with multicultural children’s literature.  Led by acclaimed children’s book author Kelly Starling-Lyons and author Gwendolyn Hooks, the session was directed to “school librarians who want to build or expand their collections with multicultural titles.”

Conference attendees from across the country who were attending the biannual event were “invited to come celebrate a showcase of great books by African American children's book creators.”  Hooks and Starling Lyons saluted titles that have been featured on The Brown Bookshelf blog.

The conference theme during those November days in Hartford:  Rising to the Challenge.

image_race

Spring Flu Hits Connecticut and Northeast Harder than Rest of USA

Not only does winter refuse to quit in Connecticut, the flu season is also slow to recede, with a second wave hitting the region this month.  According to data monitored by the state Department of Public Health, Connecticut is one of only a handful of states where flu cases have remained widespread well into April.

Overall, more than 5,000 cases of various strains of flu have been reported in Connecticut since the start of flu season last fall, with the largest number coming in New Haven County, followed by Hartford and Fairfield Counties.

The latest “Flu View” map from the national Centers for Disease Control and Prevention (CDC) indicate while flu season appears to have ended across most of the nation, Connecticut is one of less than a half-dozen states that continue to have “widespread” influenza activity.

flu CT
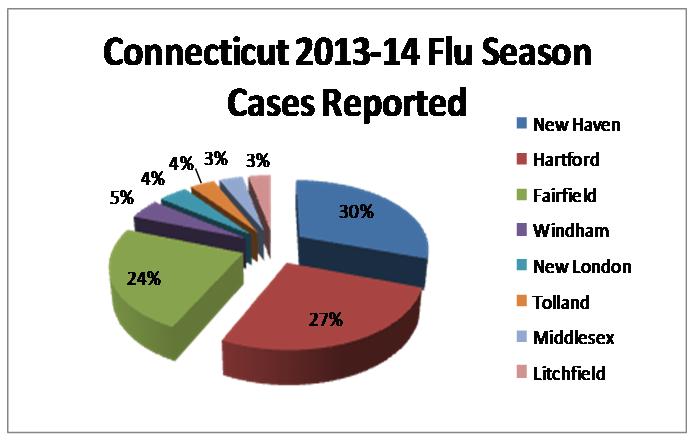
Connecticut is joined by regional neighbors New York, Massachusetts, New Jersey and Delaware in the recent spike in flu cases.  New York has recently been reporting its highest volumes of the entire flu season.  The states of Maine, New Hampshire, Rhode Island and Oklahoma have the next highest level of flu cases, according to the CDC data.

The most recent data, for the week ending April 5, indicates that statewide emergency department visits attributed to the “fever/flu syndrome” have recently increased in Connecticut and continue at a level near or above 5 percent statewide during the last 16 weeks.  The CDC reports that the region including Connecticut, Maine, Massachusetts, New Hampshire Vermont and Rhode Island is one of only two in the nation with “elevated” out-patient flu levels as of early April; the other region with elevated levels includes New York and New Jersey.  The rest of the nation is characterized as being at “normal” levels of flu incidence.

flu view

A total of 5,162 positive influenza reports have been reported for the current season, which is due to conclude, for data collection purposes, next month.  The initial peak in January brought record emergency volumes to some facilities, including Hartford Hospital.  This year’s second wave, is occurring later than a year ago, into April.  Last year's second wave occurred in March.

Influenza has been reported in all eight Connecticut counties since the start of flu season: New Haven (1,559 reports), Hartford (1,384), Fairfield (1,221), Windham (242), New London (220), Tolland (186), Middlesex (179), and Litchfield (171).

This month, Connecticut influenza activity continues to be classified geographically as “widespread” according to the state Department of Health, and many regions in the state are experiencing a second wave of flu activity, led by the influenza B strain, often referred to as “spring flu.”

In Connecticut, the Department of Public Health (DPH) uses multiple systems to monitor circulating influenza viruses. During the influenza season, weekly flu updates are posted from October of the current year, through May of the following year.

Last winter’s flu season brought 57 flu-related deaths to Connecticut, all were among patients at least 55 years of age including 48 (84%) who were greater than 65 years old. The year-long stats, reflecting August 2012 – August 2013, reflected flu instances from residents of all eight Connecticut counties and included: 4,177 from Fairfield County, 2,789 from New Haven County, 1,915 from Hartford County, 672 in Windham, 638 New London, 613 Middlesex, 388 Litchfield, and 319 from Tolland County.  Last year’s total was 11,511 confirmed flu cases, with the number of cases peaking twice, in the week ending Jan. 12, predominantly Type A flu, and the week ending March 23, predominantly Type B.

All data for the current flu season are considered preliminary and are updated with available information each week starting in October and ending in May; a final report will be available from DPH before the start of the next season.


Pilot Project Boosts Voter Engagement in Latino Community

It turns out, all that was necessary to improve voter engagement and turnout was asking – and repeated, substantive, and informative reminders.  The results of a pilot study in Hartford’s Latino community may provide critical insight into how to improve voting levels in the state’s ethnic or urban communities, as the next election season beckons.

In 2012-13, the Hartford Votes~Hartford Vota Coalition conducted a Latino Voter Engagement Initiative with the support of a grant obtained by Hartford Public Library, a founding member of the Coalition.  The goal of the initiative was to increase historically low voter engagement in Hartford’s Latino community.  It did.

The initiative includevoted traditional voter registration activities, but because voter registration by itself tends not to result in higher voter engagement, additional activities were also included in the initiative.  Among them:  candidate forums, public programs on relevant topics, production and distribution of publications such as voter guides, canvassing portions of Hartford neighborhoods, conducting a reminder to vote campaign, and civics classes in Hartford high schools.

In addition, a number of meetings were held with leaders and others from Hartford’s Latino community.  None of the conversations or interactions were partisan.  They focused exclusively on the electoral process, the importance of exercising the right to vote, and providing basic information about public issues.  The results of the initiative were impressive:

  • Voter Registration:  392 Hartford Latinos were registered to vote.
  • Voter Information: 174 Hartford Latinos attended three candidate forums and two public programs.  Three publications were produced (Hartford Voters Guide, Citizens Guide, and Guide to the Hartford Board of Education) in English and Spanish and over 4,000 copies were distributed.
  • Voter Education: 124 Hartford Latinos participated in the neighborhood canvass; 172 Hartford Latino high school students attended civics classes.

According to a sample survey conducted at the end of the project, 44 percent of Hartford Latinos with whom program organizers interacted reported an increase in their voter engagement.  For example, they registered to vote, they voted, or they attended a candidate forum or public program related to major public issues during the project period.

Project organizers concluded that “we identified and demonstrated a successful strategy that can help address the very complex problem of low voter engagement (among Latinos 1_Percentage_Increaseand others):  people vote and get involved in greater numbers when they are encouraged to do so through face-to-face contact, and multiple contacts are more effective than single contacts.”

The neighborhood canvass produced especially notable results:

  • 54 percent of Latinos who were inactive voters (i.e., they had never voted before or were registered but had not voted in the 2008 and/or the 2010 elections) who participated in the neighborhood canvass reported that they voted in 2012 as a result of the interaction.
  • 64 percent of all Latinos who participated in the neighborhood canvass reported that they voted in 2012 as a result of the interaction.
  • Those who were spoken with twice voted at a rate 21 percent higher than those that only had one interaction
  • 2012 voter turnout among all people included in the neighborhood canvass was 9.1 percent higher than overall turnout in voting districts in which an informational canvass was conducted, and 6.7 percent higher than turnout citywide.

 In addition, thirteen high school civics classes were conducted in four different Hartford schools in May and June 2013, which were attended by 172 Latino students. According to evaluation forms completed by most of the students, 91 percent said the class helped them understand more about civics and 82 percent said they were more likely to vote or take action in their community as a result of having taken the class.  Comments ranged from “I made my voice heard through my vote” to “I didn’t do it for politics but because people motivated me.”

 The Hartford experience has been corroborated by similar research in Detroit and Arizona, according to project organizers.  The Coalition’s goal in 2014 is to secure resources that will enable it to ramp up the successful strategies identified through the pilot project and as a result have greater impact.

“Through these strategies,” they suggest, “we can play a significant role in reducing the effects of low voter engagement, which is a major threat to our democracy.”

Connecticut Ranks #48 in Federal Income Tax Refunds

Connecticut ranks #48 in the nation in income tax refunds its residents receive from the federal government.  Just over 11 percent of the taxes paid by state residents to the federal government are refunded to them, a percentage that is better than only the states of Delaware and Minnesota, and the District of Columbia.

By comparison, Mississippi residents receive more than three tbiggest tax refundsimes that percentage.  One third of the taxes paid by Mississippi residents – 34.84 percent – come back in refunds.  West Virginia residents receive 30 percent of the taxes they paid, South Carolina 26.27 percent and Alabama 26 percent.  Bloomberg.com reviewed Internal Revenue Service (IRS) data and ranked the 50 states and the District of Columbia based on the percentage of gross individual income taxes withheld or paid that were returned as refunds the following year.

Figures are for a five-year period: fiscal years 2007 through 2011 for tax collections and fiscal years 2008 through 2012 for refunds. For both collections and refunds, data include individual income tax withheld, individual income tax payments, FICA taxes, SECA taxes, unemployment insurance taxes, railroad retirement taxes and estate and trust income taxes. Refunds include interest.Tax-Refund

Connecticut’s gross total individual federal income tax collected between 2007 to 2011 was $206.31 million.  Total individual income tax refunded from the federal government between 2008 to 2012 was $23.56 million.  Joining Connecticut among the states with the lowest percentage refunded, in addition to Minnesota and Delaware, are Massachusetts, New Jersey, Ohio, New York and Nebraska. 


Connecticut Ranks Third Among Least Tax-Friendly for Retirees

“The Constitution State is a tax nightmare for many retirees.” That is the thumbnail summary for Connecticut, which ranked third among the 10 Least Tax-Friendly States for Retirees, according to a list compiled by the business and personal finance publication Kiplinger’s.

Worst in the nation, according to the list, is Rhode Island, followed by Vermont, Connecticut, Minnesota and Montana.  The publication used data from state tax departments, Commerce Clearing House and the Tax Foundation to develop the rankings. “Some states offer attractive tax benefits to woo retirees,” the publication indicated. “Then there are these ten states that are stingy with retirement tax breaks.”

Kiplinger’s pointed out that “Conneticut’s “real estate taxes are the second-highest in the nation, according to the Tax Foundation.”  Rhode Island was described as “particularly tough on retirees,” and retirees in Vermont should “prepare to pay lofty taxes,” according to Kiplinger.

  1. Rhode Islandtax friendly map
  2. Vermont
  3. Connecticut
  4. Minnesota
  5. Montana
  6. Oregon
  7. Nebraska
  8. California
  9. New Jersey
  10. New York

“When you're living on a fixed income, every penny counts, which makes these states particularly unwelcoming for retirees,” the publication noted.  Most of the states tax at least a portion of Social Security benefits. Some also have higher-than-average income taxes. Others make up for low income and sales taxes with high property taxes. The survey also considered  estate and  inheritance taxes.

The tax friendliest state for retirees is Alaska, which has no income tax, no sales tax and no inheritance tax. Alaska is followed by Wyoming, Georgia and Arizona.

Connecticut’s high cost of living —  more than 30% higher than the national average, according to Sperling’s Best Places.  However, “high prices and taxes don’t deter retirees who like the scenery and who want to stay close to children, grandchildren and lifelong friends in the nearby metropolitan areas,” according to MarketWatch, a service of the Wall Street Journal, published this week.  The data compiled by Kiplinger’s Senior Associate Editor was first reported last summer.

Kiplinger is a Washington, D.C.-based publisher of business forecasts and personal finance advice, available in print, online, audio, video and software products.  The company’s best-known publications are The Kiplinger Letter, a weekly business and economic forecasting periodical for people in management, and the monthly Kiplinger's Personal Finance magazine.

International Migration Growth Keeping Population Numbers Steady

The Hartford region ranked third in the nation among metropolitan areas showing significant international migration amidst near-stagnant overall population change during the past three years.  The New Haven-Milford and Norwich-New London regions also ranked in the top 20 nationally among metro regions with less than one percent overall population growth but strong international migration.

The overall population change for the three metro areas in Connecticut were two-tenths of a percent population growth in the Hartford region, and virtually no change at all for New Haven and Norwich-New London region, each having zero percent population growth over the past three years.

The migration into the Hartford region from outside the U.S. during the three years was 16,251 people, behind only to Chicago and Detroit among the 20 metro areas where overall population change was at or near zero.  The New Haven metro area ranked 7th, with an international migration total of 10,717 and Norwich – New London was 19th, with 4,008.

During the past three years, the Norwicworld-map-background1h-New London region total population change reflected a net loss of 95 people, New Haven had a net loss of 187 people and Hartford region saw a slight increase of 2, 827 people.migration

The analysis of U.S. Census data by Governing magazine indicates that in some American cities, international migration far outpaced population gains from natural change (births and deaths) and domestic migration.  The three Connecticut metropolitan areas were among those that experienced little to no change in total population, but welcomed sizable tallies of residents from abroad.

The analysis indicated 20 metro areas across the country where total population change between 2010 and 2013 was at or near zero, while international migration was substantial – and made up, or nearly made up, for population declines to due domestic migration or natural factors. Among the other metro regions were Providence, St. Louis, Cleveland, Springfield, Pittsburgh, Rochester, Buffalo and Trenton.

Across the U.S. between 2010 and 2013, metro areas welcomed a net total of 2.6 million residents from international migration. Over the same three-year period, net domestic migration increased by just 382,000 as those who did move mostly relocated to other metro areas, the magazine reported.

The Census Bureau’s international migration estimates include not only foreign immigrants, but natives moving back home and movement of members of the military.

The country’s largest immigration hubs welcomed significant numbers of residents from abroad. Since 2010, the New York City-Newark metro area gained nearly 400,000 residents from other countries, followed by the Miami-Fort Lauderdale-West Palm Beach, Fla., area (+164,000) and the Los Angeles-Long Beach-Anaheim (+156,000) area.

According to the data, Hartford lost 18,917 people to domestic migration while it picked up 16,251 people through international migration, nearly off-setting the departing over the past three years.