Fraud Watch Aims to Limit Costly Scams Targeting Elderly

Connecticut state agencies are collaborating, in concert with private sector organizations, to protect senior citizens from elder abuse.  In issuing an Executive Order, Governor Malloy directed agencies to identify ways to increase public awareness, reporting and social network support of elder abuse victims, consider ways to improve programs for elder abuse victims, and identify best practices in elder abuse prevention, detection and intervention. Recent surveys by AARP underscore the susceptibility of seniors to identity theft and fraud, reporting that seniors were likely to have engaged in behaviors including:fraud

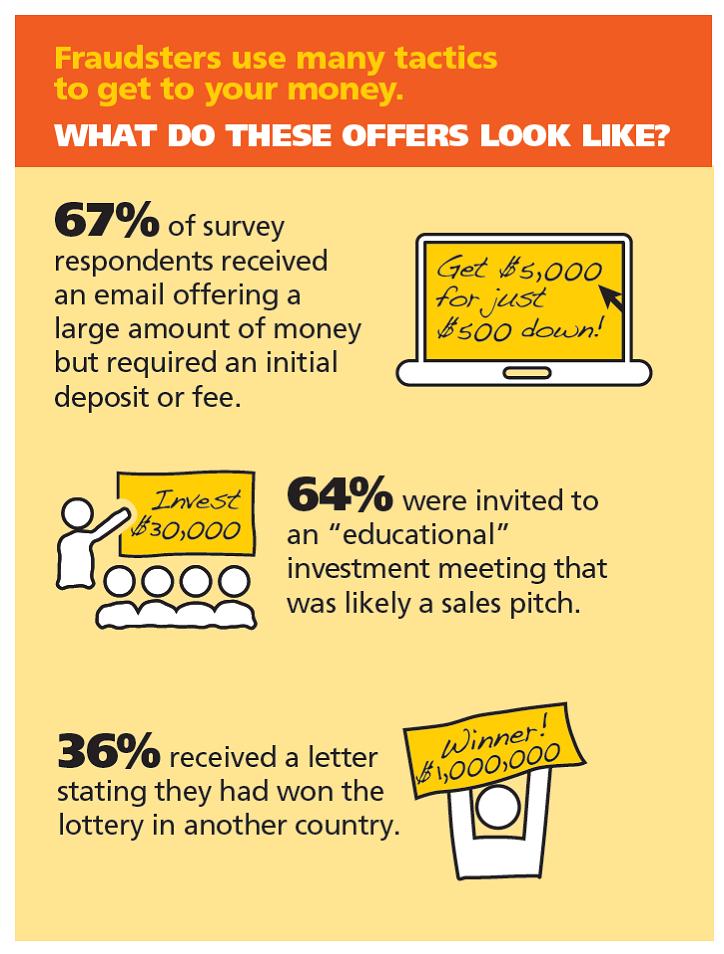
  • Clicked on pop-up ads – 26 percent of victims and 10 percent of non-victims said they had done so in the previous seven days;
  • Opened an email from an unknown person – 27 percent of victims and 17 percent of non-victims said they had done so in the past seven days;
  • Signed up for free trial offers – 18 percent of victims and 8 percent of non-victims had done so in the previous week.

Fraud victims were also found to have experienced the following life experiences, which may have impacted the susceptibility statistics cited:

  • Sixty-six percent of victims and 42 percent of non-victims said they “often or sometimes feel isolated.”
  • Twenty-three percent of victims and 10 percent of non-victims said they had experienced loss of a job.
  • Forty-four percent of victims and 23 percent of non-victims said they had suffered a “negative change in financial status” in the past two years. fraud watch

Connecticut AARP is a member of the state’s Elder Justice Coalition Coordinating Council, which convened this summer, and one of the 16 agencies appointed by the Commissioner of the State Department on Aging to work on elder justice issues.  AARP is leading the Consumer Fraud Education workgroup which has hit the ground running with the recent launch of the AARP Fraud Watch Network – a national campaign that connects people to experts, law enforcement and people like them who can help them spot and avoid scams.

As part of the CT Elder Justice Coalition, AARP Connecticut is working with state, federal and community organizations across the state utilizing Fraud Watch Network resources to educate older adults and their families about scams and provide tools and information to prevent identity theft and fraud.

Fairfield Chief of Police, Gary MacNamara, representing the CT Police Chiefs Association and a member of the CT Elder Justice Coalition, stated, “Police officers understand efforts to prevent our community members from being victims is really important.  The first step in prevention is awareness.  The AARP Fraud Watch Network provides a great place for older adults and families to get accurate information and become aware of the threat.”seniorlady-570x230

Last fall, a survey of nearly 2,400 U.S. adults age 40 and older conducted by the FINRA Foundation revealed that financial fraud solicitations are commonplace.  Many Americans are unable to spot fraudulent sales pitches, and older Americans (age 65 and older) are particularly vulnerable.

Specific findings include:

  • Over 80 percent of respondents have been solicited to participate in potentially fraudulent schemes, and over 40 percent of those surveyed cannot identify some classic red flags of fraud.
  • More than 8 in 10 respondents were solicited to participate in a potentially fraudulent offer. And 11 percent of all respondents lost a significant amount of money after engaging with an offer.
  • More than 4 in 10 respondents found an annual return of 110 percent for an investment appealing, and 43 percent found "fully guaranteed" investments to be appealing.
  • Americans age 65 and older are more likely to be targeted by fraudsters and more likely to lose money once targeted.

According to AARP volunteer and Executive Council member, Byron Peterson, “Identity theft, investment fraud and scams rob hard-working Americans of billions of dollars each year – with older adults often the biggest targets.  Through the AARP Fraud Watch Network, we’re arming people with information about what makes them vulnerable and giving them access to the tools they need to outsmart con artists before they strike.”AARP

The FINRA Foundation's survey found that 64 percent of those surveyed had been invited to an "educational" investment meeting that was likely a sales pitch. Additionally, 67 percent of respondents said they had received an email from another country offering a large amount of money in exchange for an initial deposit or fee. Upon being solicited for fraud, older respondents were 34% more likely to lose money than respondents in their forties.

In collaboration with partner agencies and organizations, AARP staff and volunteers are making fraud prevention presentations to community groups and encouraging all residents to sign up for watchdog alerts and stay abreast of current scams through the AARP Fraud Watch Network.  Available free of charge to AARP members and non-members alike, and people of any age, the Fraud Watch Network provides an array of educational information and access to individuals who share experiences and provide expertise.

CT's Population Remarkably Stable for a Century, Data Shows

Connecticut’s nickname as the Land of Steady Habits, is well-earned, as evidenced by a review of population origin during the past century.   Connecticut's domestic migration pattern has been remarkably steady through the decades, and most of the change has been due to immigration, according to data compiled by The New York Times. The hundred year comparison:  In 1900, 57 percent of the state’s residents were born in Connecticut.  A century later, in 2000, a nearly identical 55 percent of the state’s pCT bornopulation was born in Connecticut.

The percentage of Connecticut residents born outside the United States was as high as 29 percent in 1910, steadily declined to a low of 10 percent in 1970 and 9 percent in 1980 and 1990, and then began to slowly climb, reaching 11 percent in 2000 and 14 percent in 2012.

The breakdown of Connecticut’s population origins, between 1900 and 2012, as reported in The New York Times, is currently:

  • 55 percent born in Connecticut,
  • 14 percent born outside the U.S.
  • 10 percent born in New York,
  • 6 percent born in other states in the Northeast,
  • 4 percent born in Massachusetts,
  • 4 percent born in states in the South,
  • 3 percent born in other U.S. states (excluding the Northeast, South and Midwest),
  • 3 percent born in Midwest states,
  • 2 percent born in states in the Western U.S.

In 1900 and 2000, four percent of the state’s residents were born in neighboring Massachusetts.

By way of comparison, the percentage of Massachusetts’ population born in the Bay State was 55 percent in 1900 and 63 percent in 2012.  In New Hampshire the percentage of native born was 60 percent in 1900 and 42 percent in 2012 – when one quarter of the population, a robust 25 percent, were born in neighboring Massachusetts.  In Rhode Island, the population was 51 percent native born in 1900 and 57 percent in 2012.  Only 9 percent of Rhode Island’s recent population was born in Massachusetts.

The states with the lowest percentage of their population born in-state are Nevada, 25 percent; Florida, 36 percent; Arizona, 38 percent; Wyoming, 40 percent; and Alaska, 42 percent.

On the opposite end of the spectrum, 79 percent of Louisiana’s population was born in the state; 77 percent of Michigan’s; 75 percent of Ohio’s and 74 percent of Pennsylvania’s.

The largest immigrant population, by percentage?  California at 28 percent, New York at 25 percent, Florida at 23 percent and Nevada at 21 percent.

An interactive feature highlights the state-by-state data on the Times website.USA map

Pay Equity Gap Between Men and Women Begins As Children, Studies Show

The stubborn pay equity gap between men and women – larger in Connecticut than some neighboring states – apparently has its roots in childhood. National surveys indicate that parents are more likely to give their sons an allowance than their daughters. Among all young people surveyed, 67 percent of boys compared with 59 percent of girls say they get an allowance from their parents, according to Junior Achievement USA® (JA) and The Allstate Foundation’s 2014 Teens & Personal Finance Survey.allowance hand

A study by the University of Michigan Institute for Social Research found that girls do two more hours of housework a week than boys, while boys spend twice as much time playing. The same study confirmed that boys are still more likely to get paid for what they do: they are 15 percent more likely to get an allowance for doing chores than girls.  Study Director Frank Stafford indicated that the trend continues into adulthood. allowance graphic

Writing this month in the National Journal, Connecticut Congresswoman Rosa DeLauro pointed out that “right now, women make less than men in nearly every occupation for which wage data are tracked. One year out of college, women are paid 18 percent less than their male counterparts. Ten years out of college, the wage gap leaves women earning 31 percent less.  Over a 35-year career, these earnings discrepancies swell to exceedingly large sums. Across the entire workforce, the average career-long pay gap is $434,000. For college-educated women, the pay deficit averages $654,000.”

Earlier this year, CT Mirror reported that “women in Connecticut earn about 78 percent of what men make.  Numbers from the 2012 Census show that Connecticut's gender wage gap is wider than in many other states in the Northeast; and that, within the state, the gender difference varies as well. The most pronounced gap…is in Fairfield County.”

In a November 2013 report, the Governor’s Gender Wage Gap Task Force indicated that “Connecticut still has a long way to go before the gender wage gap is eliminated.”  The 14-member task force found that that “more mothers than ever before are the sole or primary breadwinners of their families. Yet, women in Connecticut are more likely than men to live in poverty and below the self-sufficiency standard. 24% of households in Connecticut headed by women with children fall below the federal poverty level. Eliminating the wage gap would provide critical income to these families.”

The report also indicated that “among all full-time, year-round workers, Connecticut women earn, on average, 22%-24.2%less than men. This gap is even more pronounced among minority women. Understanding this inequity is not a simple matter. Many factors contribute to the overall wage gap including education and skills, experience, union membership, training, performance, hours worked and the careers women and men choose. However, even after these factors are controlled for, an estimated wage gap of 5-10% remains.”

In 2012, the National Partnership for Women and Families reported that “If the wage gap were eliminated, a working woman in Connecticut would have enough money for approximately:

  • 109 more weeks of food
  • 7 more months of mortgage and utilities payments
  • 14 more months of rent
  • 44 more months of family health insurance premiums
  • 3,410 additional gallons of gas

The Connecticut Task Force issued a series of recommendations to address the pay equity gap, focused on current workplaces, businesses, training and education.  Apparently, efforts need to begin sooner, when youngsters begin household chores and ask for an allowance.

gender gap map

CT Women Underrepresented Among Top Earners; 4th Widest Gap in US

In only three states in the nation are women more underrepresented among the top 1 percent of wage owners, when compared with the state’s overall female population. Connecticut ranks 4th – after South Dakota, New Hampshire and Wyoming – in underrepresentation of women among the top earners in the state. Connecticut has a ratio of 6 men for every woman in the state’s top 1 percent of wage earners. South Dakota has the widest gap and largest ratio, at 8.2.

In Connecticut, 51.3 percent of the state’s population is female, yet only 14.4 percent of the top 1 percent of wage earners in the state are women. That is a gap of 36.9 percent, ranking the state fouTheOnePercentrth.  In Wyoming the gap is 37.1 percent, in New Hampshire 38.6 percent, and in South Dakota, 39 percent. In South Dakota, with the widest gap, only 10.9 percent of the wage earners in the top one percent are women.

On the other end of the spectrum, the gap in Delaware is 10.6 percent, in Hawaii 16.8 percent, Rhode Island 17.8 percent and Vermont 21.7 percent. The ratio of males to females among the top one percent earners is 1.4 in Delaware, 2.0 in Hawaii, 1.9 in Rhode Island and 2.5 in Vermont, compared with Connecticut’s 6.0.

Bloomberg ranked the U.S. states and the District of Columbia on the extent to which females are underrepresented in the 1% income bracket, utilizing U.S. Census data.

Connecticut also had the nation’s second highest threshold income to gain entry into the one percent club, at $429,793. Only Alaska, at $500,052 was higher. Just slightly lower than Connecticut was the District of Columbia, New York, New Jersey, North Dakota and Minnesota ($387, 414). At the opposite end of the states tally was Wyoming, with an income of $244,207 placing individuals in the state’s top one percent of earners.

In the percentage of women in the overall population, Connecticut ranked 10th, at 51.3 percent. Only 10 states have more men than women in their population. Alaska has the highest percentage of men, at 52.1, and the District of Columbia the highest percentage of women, at 52.7. Following closely behind are Rhode Island and Mississippi, both with 51.7 percent of their population being female.

Using data from the U.S. Census, Bloomberg calculated the approximate 99th percentile, or top 1%, of inflation-adjusted wage or salary income figures for those ages 16 and older and employed. Gender information was extracted and the gap between the percentage of females in the 1% bracket and the percentage of females in the state's population was calculated.

Hartford Region Improves Among Nation's Best Performing Cities in 2013

The Hartford region was the state’s only metropolitan area to improve its ranking relative to other metropolitan areas around the country in an analysis of job growth and regional economic factors in 2013 that ranked the nation’s top 200 Best Performing Cities. The top ranked Connecticut metropolitan area was Hartford-West Hartford-East Hartford, which ranked #85 among the nation’s top 200, an improvement in ranking from #93 the previous year.state map

Connecticut’s other major metro areas dropped in the rankings: Bridgeport-Stamford-Norwalk dropped to #106 from #94 in 2012, New Haven-Milford fell to #142 from #109 , and Norwich-New London ranked #187, falling from #152 the previous year.

Best Performing Cities Index Report (PDF)The 2013 Milken Institute Best-Performing Cities Index ranks U.S. metropolitan areas by how well they are creating and sustaining jobs and economic growth. The components include job, wage and salary, and technology growth.

Topping the list of Large Cities were Austin-Round Rock–San Marcos, Texas and Provo-Orem, Utah followed by San Francisco-San Mateo-Redwood City, CA, San Jose-Sunnyvale-Santa Clara, CA and Salt Lake City, UT. Rounding out the top 10 were the metropolitan areas of Seattle, Dallas, Houston, Boulder, and Greeley, CO.

Biggest gainers on the list include Hagerstown-Martinsburg, Md.-W.V. (70th, up 100 slots); Tulsa, Okla., (42nd, up from 118th), and Phoenix, (66th, up from 122nd). Within the top 25 metro areas, Texas claimed seven spots; Colorado and California each had four.

The website interactive features offer a means of comparing cities in the various economic factors.  In most years, according to the study authors, the factors evaluated in the index give a good indication of the underlying structural performance of regional economics.

A nonprofit, nonpartisan economic think tank, the Milken Institute works to improve lives around the world by advancing innovative economic and policy solutions that create jobs, widen access to capital, and enhance health.

New Haven - Milford Has Nation's Highest Concentration of Italian Heritage

The New Haven-Milford metropolitan area has the highest concentration of individuals of Italian heritage in the nation. In an analysis that ranked ancestries on the estimated percentage of U.S. population and then identified the three metropolitan areas with the highest concentration of each ancestry or origin, Bloomberg Businessweek determined that the concentration of individuals of Italian heritage made up just under 24 percent of the population in the New Haven – Milford area. The next highest concentration was in Kingston, New York, and Poughkeepsie – Newburg – Middletown, New York, each with just over 20 percent of their population of Italian heritage. Overall, the largest eHello-my-name-is_1267913358thnic populations across the country are German (15.6% of the population), Irish (11%), Mexican (10%), English (8%), Italian (5%), Polish (3%) French (2%) Scottish (1% and Puerto Rican (1%).

The Census Bureau defines ancestry as a person’s ethnic origin, heritage, descent or “roots,” which may reflect their place of birth, place of birth of parents or ancestors and ethnic identities that have evolved within the United States. Data for European, Middle Eastern, Arab and Sub-Saharan African ancestries were directly captured by ancestry questions in the Census Bureau’s American Community Survey.

The largest concentration of individuals of German descent was in Bismark, ND (60%) and the largest population of Irish was in Ocean City, New Jersey (30%) – followed by Barnstable, MA at 27 percent and Boston-Cambridge-Quincy at 24 percent.

Bangor, Maine had the highest concentration of individuals of Scottish ancestry, at 6 percent and the largest Puerto Rican population by percentage was in Vineland, Millville-Bridgetown, New Jersey at 14 percent and Orlando-Kissimmee-Sanford, Florida, at 12 percent.

In the data, South American ancestries were calculated using data from the "Hispanic or Latino origin by specific origins" tables, while Asian ancestries were calculated from "Asian race & ethnicity" tables. American Indians and Alaskan Native ancestries were counted only if individuals identified with specific tribes. Spaniards only included people who specifically identified their ancestry as Spaniard.

CT Ranks 4th in Participation in Summer Meal Programs for Low-Income Children

Participation in Summer Meal Programs for low-income children increased in Connecticut in 2013 as compared with the previous summer, with 26.4 percent of low-income children receiving summer meals on an average day in July 2013. This represents an increase of 2.4 percent from the previous summer and ranks CT 4th in the nation for participation. summerfoodwebbutton2012The numbers are increasing nationally as well as in Connecticut. In 2013, for the first time in a decade, the number of low-income children eating summer meals saw a substantial increase year-over-year, according to a report by the Food Research and Action Center (FRAC). Nearly three million children participated in the Summer Nutrition Programs in July 2013, an increase of 161,000 children, or 5.7 percent, from July 2012.

FRAC measures the success of Summer Nutrition Programs at the national and state levels by comparing the number of children receiving summer meals to the number of low-income children receiving school lunch during the regular school year. The programs grew to serve 15.1 children for every 100 low-income children who participated in school lunch during the 2012-2013 school year, a modest increase from the 14.3 per 100 served in the 2011-2012 school year.

Print

End Hunger Connecticut! noted that summer meals in Connecticut still only reached 26.4 students for every 100 low-income children who received regular school year school meals in the 2012-2013 school year. The number of sites increased slightly, from 217 to 236.

“When the school year ends, millions of low-income children lose access to school meals, including about 147,587 in Connecticut. It is in Connecticut’s best interest to ensure that such children have adequate nutrition during the summer so they stay healthy, active and return to school in the fall ready to learn,” Lucy Nolan, Executive Director, End Hunger Connecticut!, said. “While we are extremely proud of our place nationally, we still have a lot of work to do.”

Ranked just above Connecticut in participation were the District of Columbia, New Mexico and New York. Rounding out the top 10 were Vermont, Arkansas, Idaho, Delaware, Maine and Massachusetts.

To further increase the number of Connecticut children who participate in summer meals programs, End Hunger Connecticut! convened partners, community leaders and volunteers to distribute multilingual flyers, posters and other promotional materials at the start of the summer to promote Connecticut’s federally funded free summer meals program.

This year marks the third consecutive year that End Hunger Connecticut! has coordinated ‘blitz days’ in communities across the state to drive summer meals participation. Results of the initiative will be known later this year.

Increasing participation means more nutritious food for hungry children, but it also means more federal funding for communities, officials noted. If every state had reached the goal of 40 children participating in Summer Nutrition in July 2013 for every 100 receiving free or reduced-price lunch during the 2012-2013 school year, an additional 4.8 million children would have been fed each day, and states would have collected an additional $365 million in child nutrition funding in July alone, they point out.

FRAC report
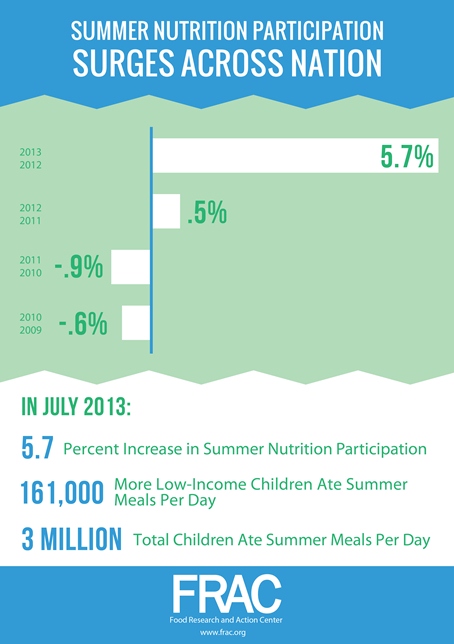
The Summer Nutrition Programs, which include the Summer Food Service Program and the National School Lunch Program, are designed to fill the food gap for the thousands of low-income Connecticut children who rely on school breakfast and lunch during the school year. These programs provide free meals at participating summer sites at schools, parks, other public agencies, and nonprofits for children under 18.

Connecticut families can find nearby summer meal sites at www.ctsummermeals.org, by calling toll free2-1-1 or by texting ‘CTMeals’ to 877-877.These tools are instrumental for families to find the closest free meals in their communities.

FRAC measures national summer participation during the month of July, when typically all children are out of school throughout the month and lose access to regular school year meals. The national report, including Connecticut data, is available online at www.frac.org

UConn is One of 10 Colleges Selected for Program to Recruit Minority Male Teachers

According to data collected by the American Association of Colleges for Teacher Education (AACTE), 80 percent of PK-12 teachers nationwide are white, middle-class women, and more than 40 percent of public schools have no teachers of color. Studies by the National Center for Education Statistics report that 2 percent of public school teachers are black males and fewer are Hispanic males. Forty percent of Connecticut public school students will never have a teacher who is not white, according to the Capitol Region Education Council (CREC), noting that "although minority students account diverseteachersfor over a third of Connecticut's public school students, only 7 percent of the state's teachers and 2 percent of the administrators in Connecticut's public schools are minorities."
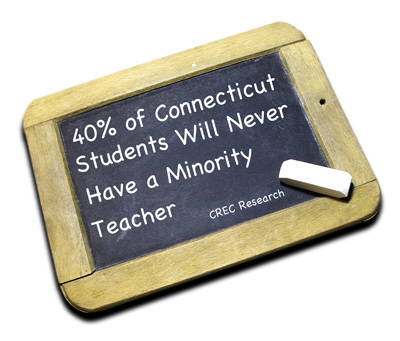
If those numbers are to change and reflect a more diverse teacher population, recruitment of teacher candidates will be a pivotal component, education officials point out.

With that objective in mind, the University of Connecticut has been selected as one of 10 universities nationwide to participate in a program that seeks to increase the diversity of the teacher candidate pool. The Neag School of Education at UConn as part of the Networked Improvement Community (NIC), an AACTE initiative aimed at recruiting more black and Hispanic men into teacher preparation programs.

UConn, a member of the 800-member AACTE, was selected to participate in the organization’s first Networked Improvement Community project, which seeks to increase the diversity of the nation’s teacher candidate pool. The other institutions selected are Boston University, California State University Fullerton, Florida Atlantic University, MidAmerica Nazarene University, Northeastern Illinois University, University of Arkansas at Little Rock, University of Saint Thomas, Western Kentucky University, and William Paterson University of New Jersey.

Saroja Barnes, senior director for professional issues at AACTE, says universities were selected for the program based on great diversity within the school districts and community they serve, alignment of the project’s goals to the existing strategic initiatives and mission of the institution, and strategic attention to enrollment trends.chalkboard-MINORITY

According to a study last year by the American Association of Colleges for Teacher Education, 82 percent of candidates who received bachelor’s degrees in education in 2009-10 and 2010-11 were white. By contrast, census figures show that close to half of all children under 5 in 2008 were members of a racial or ethnic minority, The New York Times reported.

In the 2013 study, AACTE surveyed close to 700 colleges and universities that train just under two-thirds of new teachers, finding that few candidates graduate with credentials to teach math, science, special education or English as a second language, all subjects that experts say are increasingly important to prepare students for jobs and to meet the demands of an increasingly diverse student population.

A report by the Center for American Progress, Increasing Teacher Diversity: Strategies to Improve the Teacher Workforce indicated in 2011 that “increasing the number of teachers of color is not only a matter of a philosophical commitment to diversity in career opportunities.

Teachers of color provide real-life examples to minority students of future career paths. In this way, increasing the number of current teachers of color may be instrumental to increasing the number of future teachers of color. And while there are effective teachers of many races, teachers of color have demonstrated success in increasing academic achievement for engaging students of similar backgrounds.”  Adds CREC, "It is important that all children have access to positive role models from a variety of backgrounds in order to be successful in an increasingly global society."

Thomas DeFranco, Dean of the Neag School, says goals for expanding the diversity of teacher preparation within the Neag School of Education align closely with the objectives of AACTE. Those efforts, according to UConn Today, include the creation of the Teacher Prep Academy in Bulkeley High School in Hartford; designation of an academic advisor specifically charged with recruiting minority students into the Integrated Bachelor’s/Master’s Program; and providing a variety of scholarship opportunities, such as the Connecticut State Minority Teacher Incentive Grants.

More than 50 member institutions in 25 states applied to be a part of the inaugural NIC and 10 were selected following a rigorous review by the AACTE Committee on Professional Preparation and Accountability.

Child Support Caseloads Climb; Distributions to Families, Children Drop - Opposite of National Trend

From fiscal year 2012 to fiscal year 2013, Connecticut’s child support caseload increased, administrative expenditures climbed, and collections distributed to children and families dropped, setting the state apart from national trends. During the FY2013, total child support collections nationwide increased by one percent from the previous year, to $31.9 billion. The amount distributed to children and families increased by 1.7 percent over FY2012, according to data compiled by the federal Office of Child Support Enforcement and reported by the National Conference of State Legislatures. child support chart

Connecticut’s caseload – 206,221 total cases – ranked the state 28th in the nation, the same position as a year ago. The previous year, Connecticut’s caseload was 202,736. Total distributed collections dropped to $242,343,350 in FY2013 from $245,369,851 in FY201child support wall2.

Nearly 95 percent of the amount collected was distributed to the family while just 5 percent was retained by the state as reimbursement for public assistance, according to the nationwide data. At the same time, caseloads and administrative expenditures decreased nationwide.

In Connecticut, however, the volume of cases increased by just under 3,500. Expenditures climbed from $69,637,919 to $73,001,269.

The largest caseloads in FY2013 were in Texas (1.42 million), California (1.29 million), Michigan (996,000), New York (918,000), Ohio (899,000), and Florida (855,000).

Each year, the federal Office of Child Support Enforcement (OCSE) releases a report detailing information about financial and statistical program achievements based on quarterly and annual data. OCSE compiles this information from status reports submitted by states and tribes detailing program performance.

The complete OCSE FY2013 Preliminary Report is available online.

Best Places for Home Ownership? Glastonbury, Enfield, Terryville Top List

The best places for home ownership in Connecticut are in Glastonbury, Enfield and Plymouth, according to an analysis that included home ownership rates, monthly homeowner costs, median household income, home value and population growth. Glastonbury Center, the Southwood Acres section of Enfield and the Terryville section of Plymouth were ranked as the top three slices of Connecticut for home ownership in the analysis by the website nerdwallet.com, which provides analysis on financial and consumer issues. Rounding out the top 10 were the Kensington section of Berlin, Simsbury Center, Cos Cob, Trumbull, Windsor Locks, Orange and North Haven.home map

NerdWallet looked at 60 communities in Connecticut with populations of at least 5,000 to determine what places were the best for homeownership. Overall, the pointed out that “although its median home value is substantially higher than the national average, Connecticut’s proximity to New York and Massachusetts, and its many commuting options, make the state a top destination for homeownership.”

Of the top three, the website pointed out:

  • With a two-year population growth of 6.95% and an unemployment rate of just 1.4%, Glastonbury Center has all the signs of a top home destination.
  • Up north, near the border with Massachusetts, Southwood Acres is within driving distance of Hartford and Springfield, Mass., and boasts the highest homeowner rate among our top 10.
  • Terryville is the largest village within the town of Plymouth. It has shown relatively strong population growth (2.57%), and is the most affordable median home value among our top 10.

The next ten on the list of best places for home owneership in Connecticut include: 11. Shelton (city), 12. Newington, 13. Stratford, 14. Wethersfield, 15. West Hartford, 16. Bethel, 17. Riverside section of Greenwich, 18. East Haven, 19. Milford (city), and 20. Winsted.

The analysis focused on three main questions:

Are homes available? They looked at the area’s homeownership rate to determine the availability of homes. Areas with a high homeownership rate led to a higher overall score. (A low homeownership rate was seen as indicating competitive inventory, more options for renters rather than buyers and expensive housing.)

Can you afford to live there? They looked at median household income, monthly homeowner costs and median home value to assess affordability and determine whether residents could live comfortably in the area. Monthly homeowner costs were used to measure cost of living. Areas with high median incomes and low cost of living scored higher.

Is the area growing? The website’s analysis measured population growth to determine if the area is attracting new residents and showing signs of solid growth. This was seen as a signal of a robust local economy - another attractive characteristic for homebuyers.

Homeownership rate and population change from 2010 to 2012 each made up 33.3% of the total score, using data from the U.S. Census American Community Survey 5-year estimates. Selected monthly owner costs as a percentage of median household income made up 16.7% of the total score, and median home value made up 16.7% of the total score.


top 20