State Report Calls for Tax Incentives, Better Insurance, Greater Flexibility to Improve Care for Rapidly Growing Older Population

A new report by the state legislature’s Commission on Aging, examining state funding and support for home and community-based care for older adults and individuals with Alzheimer’s Disease, has issued more than a dozen recommendations, including establishment of a Dependent Care Tax Credit, release of funds to support home modifications, and extension of paid sick leave to cover care of elderly relatives.  Incentives for employers to offer long-term care insurance coverage are also suggested. The Commission on Aging is a nonpartisan public policy and research office of the Connecticut General Assembly.  A law passed by the legislature last year charged the Commission with studying private sources of funding available to elderly persons and persons with Alzheimer's disease in need of home or community-based care, including the cost effectiveness of such programs funded by the state with recommendations on which state programs should be expanded.aging report

Connecticut is the 7th oldest state in the nation.  Over 70,000 people age 65 and older live with Alzheimer’s Disease or another dementia, and disabilities affect 10.4 percent of all Connecticut residents – nearly 400,000 people. Due to factors including aging demographics and consumer choice, demand for home-care based services is expected to “increase exponentially in coming decades,” according to the report. Between 2010 and 2040, Connecticut’s population of people age 65 and older is projected to grow by 57 percent, with less than 2 percent growth for people age 20 to 64 during the same period.seniors 2

The 23-page report noted that “informal caregivers are the backbone of the long-term service and support system. It is estimated that the economic value of the care provided by unpaid caregivers is $5.8 billion in Connecticut. Supporting caregivers is a cost effective means of reducing the reliance on costly formal care system.”  The report went on to caution that “without support, caregivers are likely to become emotionally and physically ‘burnt-out’ and find few options” short of turning to institutional care.

The report recommends amending the state tax code to include a Dependent Care Credit where the tax filer can receive a credit for care expenses incurred while a caregiver is working. Home care and adult day care costs are cited as examples of work‐related expenses that may be eligible.

To provide further support to informal caregivers, the report calls on the legislature to extend paid sick leave for those caring for an aging parent or other relative.  Connecticut’s law currently allows paid sick leave to be used for a worker’s own illness or injury, or to care for the worker’s child or spouse.  It does not extend to cover workers who care for a parent or other relative. aging population

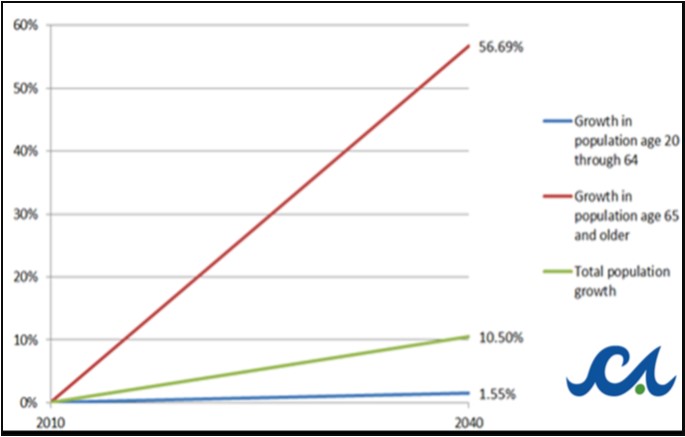
Policies that “allow for flexibility” in work schedules are also urged, cited studies have shown such schedules not only are “an import way to support a caregiver but also… positively affect recruitment and retention efforts.”

The report urges the authorization of $6 million in bond money for home modifications and adaptive technology, which was allocated by last year’s legislature, and development of a list of “vetted home repair and home modification contractors and programs” to improve the likelihood that individuals would be able to “age in place.”

The goal, the report indicated, would be to “enable them to function with greater independence in the home, remain in the community and reduce the need for human assistance. Simple modifications include adding nonslip strips to bathroom floors or other smooth surfaces, improving lighting, providing telephones with large numbers and letters, and installing grab bars. More complex (and expensive) modifications include installing ramps, chair lifts, stair glides, widened doorways, roll-in showers, and lowered countertops.”

Among the other recommendations, the report urges professional development for those whose job it is to care for individuals with Alzheimer’s and dementia, to align with changing demographics in the state’s population.

seniorsThe report also suggests that policy makers “explore the possibility of incenting employer-based long-term care insurance coverage.”  In 2009 almost 25,000 employers in the U.S. offered long-term care insurance to their employees – just 35 percent of the 7.5 million insurance policies in effect.  In addition, the report encourages the Connecticut Congressional delegation to support a federal tax deduction for long-term care insurance, and urges policy makers to consider making reverse mortgages “a more viable option.”

Additionally, the report also considers advances in technology in the care of older residents.  It describes “telehealth” as a mode of delivering health care, public health and certain non-clinical services using electronic communications technology, stating that it “represents an opportunity for Connecticut to improve access to care, coordination, quality and outcomes for individuals, all while reducing cost, promoting local economic health, and offering a patient-centered approach.”  The Commission on Aging calls on Connecticut to join at least 21 other states that have telehealth parity laws for private insurance, meaning that providers can collect reimbursement for telehealth services.RdN-XMIb_400x400

The report, “Study of Funding and Support for Home and Community-Based Care for Older Adults and Persons with Alzheimer's Disease,” also recommends that the state “address service challenges specific to housing, transportation and behavioral health,” including conducting “walkability audits” to assess sidewalks, crosswalks, and pedestrian access to essential services.  It also suggests that the state “explore the use of taxi vouchers, public and private paratransit services, paid and volunteer driver services, on-demand car rental services and other forms of transportation in the growing “shared mobility” economy.


School Suspensions Down, But Students of Color, Low Income Receive Disproportionate Share

There’s good news and bad news in a new analysis of suspensions, expulsions, and arrests of students in Connecticut schools.  The report, by Connecticut Voices for Children, found that overall significantly fewer students have been excluded from the classroom in recent years, but that suspension, expulsion and arrest rates were much higher for minority students, special education students, and students from poorer districts.arrested The report also found that “many of these discipline measures were used for behaviors that were probably not criminal and could likely have been handled within the school.”  Stressing that “children learn best when they are in school,” the report indicated that “arrests, expulsions, and suspensions are often costly, ineffective, and unnecessary.”

Connecticut Voices for Children is a research and advocacy organization that works to improve opportunities for the state’s children, youth and families. The report, “Keeping Kids in Class: School Discipline in Connecticut, 2008-2013,” uses data provided by local school districts, found that in 2013, 7.4 percent of all students received at least one expulsion or suspension, down from 8.5 percent as recently as 2011.

First, the good news:

  • The number of students arrested, expelled, and suspended in Connecticut has decreased significantly in recent years. In the 2013 school year, Connecticut schools arrested 35 percent fewer students, expelled 31 percent fewer students, and gave out of school suspensions to 47 percent fewer students than in 2008.

The not-so-good news:

  • Despite the overall reduction in these “exclusionary” school discipline practices, many students are still removed from the classroom for non-criminal behaviors that could, in the view of Connecticut Voices, be managed in the classroom. “School policy violations” – such as skipping class, insubordination, or using profanity – were involved in 9 percent of student arrests, 6 percent of expulsions, 50 percent of out-of-school suspensions, and 79 percent of in-school suspensions in 2013.report

From 2008-2013 the percentage of students suspended out-of-school fell from 4.9% to 2.7%. During the same time period, the percentage of students suspended in-school increased from 4.9% to 5.2%.

Of particular concern was the data related to students of color and those with limited financial resources or disability:

  • In 2013, black students were 4.7 times more likely to be arrested, 4.9 times more likely to be expelled, and 6.5 times more likely to be suspended out-of-school than white students.
  • Hispanic students were 3.1 times more likely to be arrested, 2.6 times more likely to be expelled, and 4.4 times more likely to be suspended out-of-school than white students.
  • Special education students were arrested at 3 times the rate of general education students, and they were 1.8 times more likely to be expelled, and 2.6 times more likely to receive out-of-school suspensions.
  • Students in the poorest urban areas were arrested nearly 23 times more often, expelled over 17 times more often, and suspended out-of-school 24 times more often than students in the wealthiest suburban areas.suspensions

Based on the data, the report makes a series of recommendations for the state Department of Education and policymakers to consider, including:

  • Require districts with police stationed in schools to create a memorandum of agreement between the schools and police that sets ground rules concerning arrests. Promote police and educator training, such as that provided by the state’s Juvenile Justice Advisory Committee, which offers instruction to officers and educators in understanding and responding productively to adolescent behavior.
  • Implement preventive strategies and alternative discipline measures to reduce racial and other disparities and ensure those excluded from school are provided equal opportunities.
  • Establish and support community collaborations across the state. National studies show that engaging all stakeholders in the discipline process positively impacts student behavior and achievement.

The top 10 reasons for expulsion in 2013:  1) drug/alcohol/tobacco, 2) weapons, 3) fighting/battery, 4) personally threatening behavior, 5) school policy violations, 6) theft/theft related behaviors, 7) verbal confrontation/conduct unbecoming 8) violent crimes against persons, 9) sexually related behavior, and 10) property damage.

The report concludes that “the disproportionate rate by which students of color and students from poorer districts are excluded from school may in fact contribute to widening the achievement gap; students from less privileged backgrounds will continue to perform worse than their more advantaged peers if they are excluded from the classroom in the first place.”

The report also recommends expanding access to behavioral and mental health services and utilize Juvenile Review Boards (JRBs), locally-run groups that offer a diversionary alternative to the court system for youth who have committed minor delinquent acts or misdemeanors.  In addition, it calls for improving data collection by clearly defining “student arrests” (not currently defined by the state) and collecting and publishing data on all student arrests (currently not required for all incidents resulting in arrests).

“This report tells us that many schools in Connecticut have reformed their disciplinary practices and reduced student arrests, expulsions and out-of-school suspensions,” said Ellen Shemitz, Executive Director of Connecticut Voices for Children. “Yet these reforms have not benefited all children equally. How can we hope to reduce the yawning achievement gap when school disciplinary practices push minority children out of school at disproportionate rates?”

CT Ranks Last in Job Creation, Poll of Workers in 50 States Reports

To say that the latest Gallup Poll on state-by-state job creation reflects little good news for Connecticut would be an understatement.  Connecticut ranked last in the survey for 2014, which is determined based on full- and part-time workers' reports of whether their employer is hiring and expanding the size of its workforce, not making changes, or letting people go and reducing its workforce. “Connecticut has consistently ranked in the bottom tier for job creation, and its position at the very bottom in 2014, along with continued low ratings of other New England states and neighboring New York, suggests that is unlikely to change in 2015,” the survey summary predicted.

It marked the second time this month that Gallup reported diminished economic rankings for Connecticut.  The national poll’s economic confidence report, based on Gallup Daily tracking interviews with 176,702 national adults conducted from January through December 2014, indicated that Connecticut dropped out of the top 10 and into the middle-of-the-pack among the nation’s 50 states.  Leading the nation in “economic confidence” were Minnesota, Maryland and California.    Gallup by state

The newly released 50-state survey on job creation placed Connecticut at the bottom of the pile, as workers reported the worst hiring climate, although still net positive.  All 50 states had positive net hiring scores, and all but three -- West Virginia, Alaska and New Mexico -- have markedly improved on this measure since these ratings hit their low point in 2009, according to Gallup’s survey.

Joining Connecticut in the bottom dozen were the New England states of Rhode Island, Vermont, and Maine, along with Neighboring New York and New Jersey, as well as Alabama, Kentucky, Mississippi, West Virginia, New Mexico and Alaska.

North Dakota maintained its position at the top of Gallup's annual ranking, with employed North Dakota residents providing a strongly upbeat report on hiring conditions where they work -- the most positive of any state.   In North Dakota, 48 percent of workers in 2014 said their employer is hiring and 12 percent said their employer is letting workers go, resulting in a +36 Job Creation Index score.worst list

By contrast, Connecticut's +16 index score reflects 33 percent of workers saying their employer is hiring and 17 percent letting go, the Gallup survey found.  Only two states – Vermont (31%) and Montana (33%) – had equal or lower percentages responding that their employer is hiring, expanding the workforce. Connecticut and Rhode Island tie for compiling the worst collective job creation scores since 2008 and are the only states to have ranked in the bottom 10 each year.gallup-poll-logo

The 2014 state-level findings are drawn from 201,254 interviews with employed adults nationwide, conducted throughout the year as part of Gallup Daily tracking. In Connecticut, 2,503 individuals were interviewed, with one-third saying their employer was hiring, nearly half (43%) reported hiring was not changing, and 17 percent saying that their employer was reducing the workforce.

Beyond North Dakota, other top states were Texas, Nebraska, Wisconsin, Iowa and South Dakota.  Michigan's presence among the states with the highest Job Creation Index scores is notable because it represents one of the sharpest turnarounds of any state in the seven years Gallup has measured job creation, according to Gallup. Michigan was among the worst-performing states in 2008 and 2009, but with significant improvements in that state's economy, it rose to about average net hiring in 2010, and has ranked among the top-performing states in each of the past two years, Gallup pointed out.

The index was up year-over-year in most states, the Gallup survey revealed, but particularly in Oklahoma, Oregon and New Hampshire, where it rose nine points each. At the same time, net hiring failed to improve in a handful of states -- North Dakota, Alaska, Hawaii, Delaware, South Dakota, Minnesota, Tennessee and Connecticut -- where the index was basically flat in 2014, the report indicated.

http://youtu.be/fLPPLHDo2FU

Racial, Ethnic Disparities Common in CT Hospital Readmissions, Study Finds

An Hispanic patient hospitalized in Connecticut for heart failure is 30 percent more likely than a White patient to end up back in the hospital within a month, according to a study published in Connecticut Medicine, the journal of the Connecticut State Medical Society.  The study also found that a Black patient hospitalized for chest pain is 20 percent more likely to be readmitted within 30 days after discharge. The study was based on an analysis of the Connecticut Hospital Inpatient Discharge Database -admissions to Connecticut hospitals from 2008-2012. The findings, the study noted, “should serve as a catalyst for further investigation of the interplay between patient characteristics, hospital practices, community-based resources, and insurance coverage” in fostering “racial and ethnic disparities in health and healthcare.”medical journal

The multi-year study discovered significant and pronounced disparities in readmission rates for Black and Latino patients compared to White patients in 9 of 10 major diagnostic categories.

The Connecticut State Medical Society hosted a well-attended symposium last week highlighting its multi-year research into racial and ethnic disparities in readmissions.  The symposium, funded by the Connecticut Health Foundation, brought together physicians, nurses, patients, and other stakeholders from across the state. The stakeholders had an opportunity to review and discuss the CSMS research data, and also provided insight and interpretations of the disparities. The feedback will be integrated into clinical recommendations for care delivery models that may help to reduce the level of disparity in hospital readmission rates.

The symposium was designed to provide an opportunity to take a fresh look at these readmission disparities and determine more effective ways to address them. Stakeholders included physicians and other licensed health care providers; social service providers; healthcare/social service administrators, leaders, and managers; lawmakers and policy analysts; patients and their family members; healthcare consumers and patient advocates.  It focused on documenting potential best practices of the four conditions with the greatest racial and ethnic disparities in readmission rates, as determined in the study:  Uncomplicated Delivery, Joint Replacement Surgery, Heart Failure & Chest Pain, and Digestive Disorders.

logoThe study also noted that “barriers to accessing community based care among Connecticut Medicaid beneficiaries are well-documented, often leaving such patients with few options other than hospital care for both urgent and non-urgent conditions.”

The study’s authors noted that “this study adds to a growing body of evidence on disparities in hospital readmissions in several important respects.”  First and foremost, they point out, “racial and ethnic disparities observed in this study were considerably more pronounced than disparities generally reported in previous studies.”

“We’re seeing large disparities in readmissions for a number of conditions,” Robert Aseltine, the study’s lead author and professor of behavioral science and community health at the University of Connecticut Health Center, told the Connecticut Health Investigative Team (C-HIT). “There’s no one factor that jumps out. There’s no simple answer. ” Co-existing health conditions and socioeconomic status, for example, “don’t explain everything away.”hands

In March 2014, a report by Mathematica Policy Research for the Robert Wood Johnson Foundation indicated that the U.S. Department of Health and Human Services observed a year earlier that “while overall quality is improving, access is worse and there has been no improvement in lessening disparities.” The report goes on to point out that there “appears to be a shift from the concept of disparities to one of equity. The shift provides more focus on action and social justice relevant to a wide variety of subpopulations.”

In 2010, when “nearly half of U. S. physicians identify language or cultural communication barriers as obstacles to providing high-quality care,” physician adoption of practices to overcome such barriers was described as “modest and uneven, according to a national study by the Center for Studying Health System Change (HSC).

The new Connecticut study was conducted by Robert H. Aseltine, Jr, PhD, Jun Yan, PhD, Claudia B. Gruss, MD, Catherine Wagner, EdD, and Matthew Katz, MS.

CT Ranks #4 in Planned Parenthood Locations Per Capita; 17 Sites in State

Connecticut ranks #4 in the nation in the number of Planned Parenthood locations per capita, according to a state-by-state analysis. Connecticut, with a total of 17 locations in the state, ranks behind only Vermont, Alaska and Montana in the number of clinics per 100,000 women ages 15-50.  According to the analysis by Bloomberg.com, Connecticut’s estimated population of 856,016 women ages 15-50, or a ratio of 1.99 locations per 100,000 women.  Rounding out the top 10 are Iowa, Washington, Colorado, Wisconsin, New Hampshire, and Indiana.

The 17 lplannedocations in Connecticut are in Bridgeport, Danbury, Danielson, Enfield, Hartford, Manchester, Meriden, New Britain, New Haven, New London, Norwich, Old Saybrook, Stamford, Torrington, Waterbury, West Hartford and Willimantic.

The mission of Planned Parenthood is to “protect the fundamental right of all individuals to manage their own fertility and sexual health, and to ensure access to the services, education and information to realize that right,” the organization’s website points out.

Among the states with the fewest number of Planned Parenthood locations, and the lowest number per capita, are North Dakota (0 locations), Mississippi (1 location), and Alabama, South Carolina, Louisiana, and Kentucky, each with 2 locations in the state.chart

California has the most locations, with 115, followed by New York with 59, Texas with 39, Pennsylvania with 38, Washington with 33 and New Jersey and Ohio with 28.  Connecticut ranks fifteenth in the number of Planned Parenthood locations in the state.

Planned Parenthood’s website describes the organization as “your trusted source for STD/STI testing, birth control, pregnancy tests and counseling, emergency contraception and more - all in a convenient, confidential and safe environment.”  The site notes that the organization offers “a sliding fee scale based on your income” and participates with many insurance plans.

Last month, as part of Cervical Health Awareness Month, Planned Parenthood of Southern New England (PPSNE) urged women to “start the year off right by taking charge of their health with important preventive screenings, such as a Pap test, which can detect irregularities that lead to cervical cancer.”

The Centerswomen 
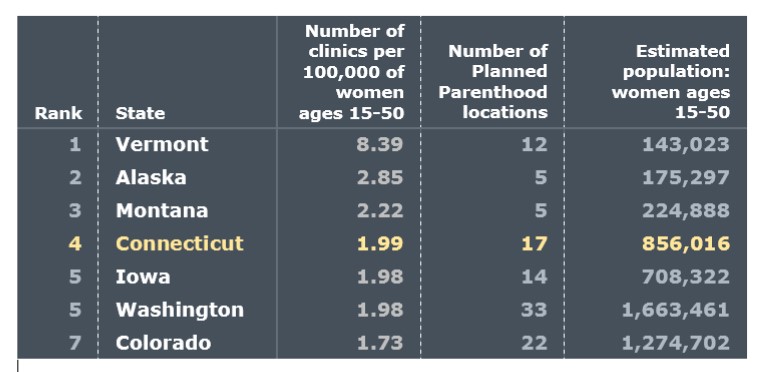
for Disease Control and Prevention (CDC) recently released new data showing that while cervical cancer screenings have been proven to save lives, about eight million women ages 21 to 65 have not been screened for cervical cancer in the past five years. More than 12,000 women in the U.S. are diagnosed with cervical cancer each year, and more than half of these cases are in women who have never been screened or in those who haven’t been screened in the past five years, according to Planned Parenthood.

The analysis ranking the states for Planned Parenthood locations uses data from the U.S. Census and Planned Parenthood, as of December 31, 2014.

Helping Families Experience Joy of Adoption Is Goal of Start-Up Nonprofit

After six long, challenging and frustrating years, and spending thousands of dollars, a Norwalk couple adopted a child.  And in that moment, a new mother vowed that she would do everything possible to make sure that others would not be prevented from experiencing the joy of becoming a parent due to a lack of financial resources. Today, her daughter is an energetic and engaging 3-year-old and she is following through on the commitment she made to herself, launching a non-profit organization named The Adoption Hope Foundation.  The organization’s mission is to help break the financial barrier of adoption by providing grants to people who hope to build their families through adoption.  The fledgling organization is about one-third of the way towards meeting their initial fundraising goal, with a GoFundMe crowdfunding campaign underway that seeks to raise $10,000 by April 15.2910715_1420349980.101_funddescription

“The thought that some people would not be able to have a family simply because of the financial barrier was heartbreaking to me.  And thinking about babies and children who would not be adopted simply because families couldn’t afford it was unacceptable.  With the average adoption costing approximately $35,000, many qualified, loving families are unable to pursue it due to the high cost.”

It was a long and winding road for Laura Loffredo.  “My husband and I struggled with infertility for six years.  We spent thousands of dollars.  We had eight failed fertility treatments and a miscarriage.  I prayed every night for a baby and the longing inside my heart was unbearable.  I was angry, bitter and heartbroken.  I couldn’t breathe.  I have often referred to this time as the darkest time of my life.”

“When we finally made the decision to adopt, it was like a light in the darkness. The first time I held my daughter in my arms when she was only a few minutes old, I was overcome with emotion,” she recalls.  “Adoption is a beautiful gift.  It is a life altering experience that has allowed me to feel the deepest kind of love imaginable. We believe that every waiting family deserves a child, and every waiting child deserves a family.”

She has spent the past two years researching how to start and run a nonprofit organization, including taking seminars offered by the Connecticut Nonprofit Association.  She has “talked to anyone who would listen – anyone who knew anything about the nonprofit world.”

Some suggested that starting a nonprofit was a tough road, but Loffredo is determined.  “I am compelled to do this - it was a calling.”  She has gained much support and encouragement from long-established nonprofit leaders and professionals in the field in Connecticut. “They have helped me tremendously by constantly answering my start-up questions and supporting me with their expertise in this area.”adoption

More information about the new nonprofit, and their efforts to raise the necessary funds to begin grant-making, are available at www.gofundme.com/adoptionhope or by contacting Laura Loffredo at loffredo.laura@gmail.com

Thinking back on the adoption process, Loffredo recalls “I felt overwhelmed by the extremely high cost of the process.  I felt blessed that we were able to afford it but immediately felt upset thinking about people who could not afford this whose dreams were to have a family. I envisioned an organization that would support adoption by providing grants to people who wanted to build their families through adoption.”

The new business is filing the legal documents required to gain non-profit status, and they expect to have 501c3  in place by June. A website is being developed, and applications for grants will soon be available.  There will be no application fee, so as not to create an additional economic burden on prospective families.  The Adoption Hope Foundation anticipates awarding $5,000 grants by the end of this year.

a quoteA home study by a social worker, along with background checks, must be completed before applications will be accepted, and grant awards will be determined by members of a board, based on criteria including need and personal circumstances, such as “why they want to build their family through adoption.” Board members already in place include individuals with backgrounds in finance, law, fundraising, and social work, whose lives have been touched by adoption. Additional board members are now being determined.

In addition to launching the nonprofit organization, Loffredo is writing a memoir about her struggle with infertility and a children’s book about adoption.  She hopes to have both volumes published within a year, with the sale of the books to be used to help support The Adoption Hope Foundation.

A report by the U.S. Department of Health and Human Services Administration for Children and Families, using the most recent data available in 2011, indicated that “approximately 136,000 children were adopted annually in the United States (in 2006 and 2007). This represents a 6-percent increase in adoptions since 2000 and a 15-percent increase since 1990.”

In a 2007 survey, the Department noted that “of the 1.8 million adopted children in the U.S., 37 percent were adopted from foster care, 38 percent joined their families through private domestic adoptions, and 25 percent were adopted internationally.”  They also reported that “overall, parents of 86 percent of adopted children report that their relationship with their child met or exceeded their expectations.”


Frontier CEO Is Half of Only “Sister Act” Among Fortune 1000; Company Opening Retail Stores

Until last year, most Connecticut residents were unfamiliar with Frontier Communications, even though the telecommunications company has operations in 28 states across the nation.  When the company purchased much of AT&T’s local operations in Connecticut in a $2 billion deal, they suddenly became a dominant player for residential and businesses customers in their home state.  But Frontier, despite its shaky hand-off from AT&T, was, and is, no small player on the national scene. On the latest list of the Fortune 1000 companies, Frontier ranks at #514.  They have hovered just above or below #500 in recent years.  The company is led by one of only 52 female CEO’s on the list, Maggie Wilderotter.  In fact, Wilderotter is half of the only sister act among the 52 – her sister is Campbell’s Soup CEO Denise Morrison, leading one of the nation’s best known brands, #315 on the Fortune 500.Frontier-logo-red

Wilderotter has served as Chief Executive Officer at Frontier since November 2004 and as Chairman of the Board since December 2005. She also served as President until April 2012.  The July/August 2013 issue of Chief Executive magazine described her as the “longest-tenured woman CEO of a Fortune 500 company.”

Sister-CEOs-480x320Denise Morrison, the subject of the lead business story in the February 2, 2015 issue of TIME magazine, has led Campbell’s since 2011.  The magazine described family dinners when Denise, Maggie and their two younger sisters were growing up, that included discussions led by their father, an executive with AT&T, in which “he taught basic business skills through childhood activities like negotiating over chores and identifying the target market when selling Girl Scout cookies.”  He “thought it was important to prepare his daughters for a business world that was growing more open to women,” the magazine reported.

The lessons were well learned.  According to Catalyst, which tracks the number of women in corporate America, women currently hold 4.8 percent of Fortune 500 CEO positions and 5.2 percent of Fortune 1000 CEO positions.  Wilderotter told TIME:  “We grew up in an environment where we would get the highest level of satisfaction from doing things people never expected us to pull off.”

Even as Frontier finds its footing among Connecticut consumers, the company’s has begun to roll out a retail store presence.  Frontier opened its second retail outlet in Connecticut, in Norwalk, last month.  The location at 2 Washington Street joins one in New London, at 200 State Street.  The company is actively pursuing plans to add two more retail stores in Connecticut by April.  Primarily geared toward residential customers, the stores are also expected to sell business products later this year.  Frontier currently has retail stores in 23 states.F09_Frontier_bf-e1418658074267-600x300

The CEO sisters, 13 months apart in age, “talk passionately about supporting women in the boardroom and the lessons they learnt from their parents which enabled them to be self-confident and have the belief that anything was possible coupled with a focus that getting a good education would give them the freedom and flexibility to do anything they wanted,” reported the business website Footdown in 2012.


http://youtu.be/nmcHRQ3y8LM

Immigration Drives Growth, Vibrancy of New Haven Region, Study Finds

If Greater New Haven is thriving, the region’s rapidly-growing immigrant population is a key reason, according to a new research study. The report, entitled Understanding the Impact of Immigration in Greater New Haven, compiles data from federal, state and local government agencies, as well as information generated locally by DataHaven and The Community Foundation of Greater New Haven. Viewed as “an important step in its effort to enhance the civic and economic participation of immigrants in Greater New Haven,” the report was undertaken to provide a snapshot of the immigrants living in Greater New Haven and Connecticut, the impact of local population change and diversity, and the community and economic impact. It is intended to help the general public, policymakers and local leaders understand the impact of immigration in the region to inform discussions and community action.UIGNH_cover_600

According to the report:

  • Approximately 1 in 8 residents of Greater New Haven is foreign-born, originating in countries in all the world’s regions.
  • While the native-born population in Greater New Haven has barely increased since 2000, immigrants settling in the area have caused rapid population growth, making New Haven the fastest-growing city in Connecticut over this period
  • About half of all immigrants are naturalized US citizens; the other half are legal permanent residents, legal temporary residents or undocumented immigrants.
  • Greater New Haven is attracting immigrants from a wide range of countries, with the greatest increases in numerical terms between 2000-2012 attributable to immigration from Mexico (3,168), India (2,729), China (2,292), Jamaica (1,532) and Ecuador (1,382).This report explores how immigration impacts the development of both Greater New Haven and Connecticut.

“It is clear from the report that the Greater New Haven community is enhanced in many ways by immigration,” says William W. Ginsberg, President & CEO of The Community Foundation for Greater New Haven. “The data demonstrate that our rapidly growing foreign-born population is successfully building productive and contributing lives here – by working, by creating small businesses that build wealth, by owning homes, by educating their children, and by contributing to the diversity and cultural richness of this community.”foreign born population

The report also cites data indicating that the immigrant population in Greater New Haven is highly-skilled, compared to other areas. Among immigrants in this region, there are more than twice as many high-skilled workers as low-skilled workers in the region, while data for the United States as a whole show slightly less than one high-skilled worker for every low-skilled worker.

From 2000 to 2012, Greater New Haven’s population as a whole increased by more than 27,000 people, according to the report. Of that growth, about 75 percent (20,165) were foreign-born residents. About half of immigrants in Greater New Haven are naturalized citizens.

The Community Foundation for Greater New Haven explored local public opinion on immigration by interviewing key stakeholders and administering an online survey to its constituents. The survey found that “although immigration is a complex issue, the Greater New Haven community widely agrees that foreign-born people contribute to the economic, cultural, and social well-being of the region.”  Nearly all (97 percent) respondents said that the issue of immigration is very or somewhat important to Connecticut.  Only 31 percent of respondents thought they understood immigration policy extremely or fairly well.

pop growth
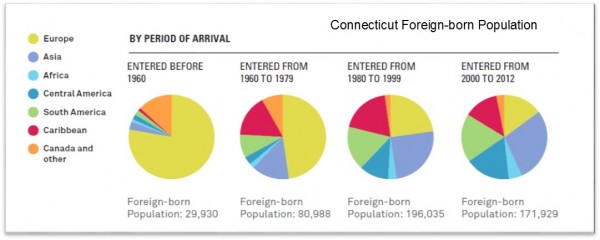
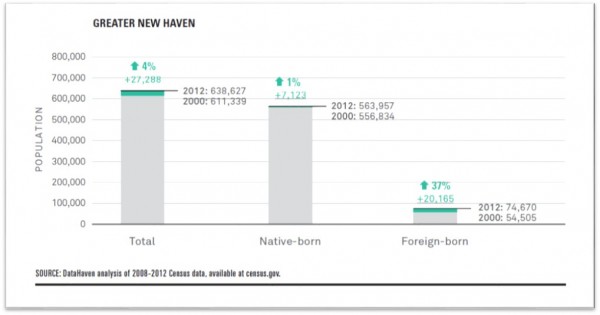
In New Haven’s neighborhoods in particular, the boost in immigrants has revitalized communities and spurred new businesses.  From 1970 to 1990, the foreign-born population in most New Haven neighborhoods remained flat or declined, and these neighborhoods suffered from overall population decline—similar to other central city neighborhoods in post-industrial cities. Since 1990, the report found, the foreign-born population in many city neighborhoods has rebounded sharply, particularly in areas such as Edgewood, West River, Fair Haven, and the Hill. These areas have seen a large influx of population and business overall.new haven map

Statewide, among Connecticut’s immigrant population entering the US since 2000, only 15 percent are Europeans. 29 percent were born in Asia, and 19 percent come from South America. By contrast, 78 percent of Connecticut’s immigrant population that entered the US before 1960 was born in Europe.

The report was compiled and written by Mary Buchanan and Mark Abraham of DataHaven, with assistance from staff at The Community Foundation.

In 2015, The Community Foundation’s work will include dedicated grantmaking and other support for nonprofits working in this area, including support for advocacy efforts on State and Federal immigration policy, efforts to identify and support emerging leaders in the immigrant community, and public education and other efforts to enhance the community’s understanding of the social, cultural and economic benefits of immigration for Greater New Haven.

“New Haven has always been a welcoming community, and the surge of immigration in recent years shows us yet again how important immigration is to the growth and success of our community,” Ginsberg added.The Community Foundation is making immigrant integration a strategic focus with the goal that immigrants in Greater New Haven, including undocumented, will achieve greater civic and economic participation and success thereby becoming more fully integrated members of a more welcoming community, the report indicates.

More information on the Foundation’s philanthropy is available at www.giveGreater.org. The report is available online at www.cfgnh.org/immigrationreport  or by calling The Community Foundation at 203-777-2386.

Connecticut Ranks #2 in Millionaires; New Jersey Drops to #3

Which state has 99,965 millionaires?  Connecticut.  How many states have a greater percentage of millionaires, based on population?  Only one. Connecticut is ranked at #2 among the states in an analysis of the number of millionaires, as a percentage of population, developed by Phoenix Marketing International.  Only Maryland has a higher percentage – and Connecticut moved up one notch this year, surpassing New Jersey, which was ranked second a year ago.

Perhaps surprisingly, it’s not all about Fairfield County.  David Thompson, Managing Director of the Phoenix Global Wealth Monitor and the lead researcher, points out that the data shows “pockets of wealth” throughout the state – in the Bridgeport-Norwalk-Stamford corridor, but also in Litchfield County, Hartford-West Hartford, and Norwich-New London.  In fact, only California has more metropolitan areas in the nation’s top 30 for millionaires per capita.top states

And while some have suggested that Connecticut’s tax structure and economy are pushing people to exit the state, millionaires seem to be quite comfortable here.  The total number of millionaires dropped slightly during the past year from 100,754 to 99,965, a loss of 789 millionaires.  New Jersey lost more individuals with investable assets over a million dollars as a percentage of population, dropping behind Connecticut.  New Jersey's total number fell from 242,647 to 232,514, a loss of more than 10,000 millionaires during 2014 (from 7.49 percent to 7.14 percent of the state's population).

“Connecticut holds on to its wealthy population.  There’s no downward trend (compared with other states),” Thompson notes.  “The tax structure isn’t so onerous, the state offers stability, and attracts industries that grow wealth.”  Thompson, a Connecticut resident, adds that the quality of life in the state, as well as its accessibility to New York and Boston also prove attractive.

Maryland has 170,248 millionaires, a ratio of 7.67 to total households.  Connecticut ranks #2, with 99,965 and a ratio of 7.23, followed by New Jersey with a ratio of 7.14 and 232,514 millionaires.  Connecticut has consistently been a top five state, placing third  in 2013, fourth in 2012, 2011 and 2010.

Among the key findings for 2014:millionaire_1890954b

  • Maryland held strong in the first position for its fourth year in a row
  • On the strength of its oil boom, North Dakota continued its meteoric rise in the millionaire rankings, moving up to number 20 in 2014. Its neighbor, South Dakota, however, was the biggest gainer this year, rising twelve points to number 26
  • The top ten states remained the same, with only slight shifts: New Jersey #3 (down one point), Hawaii, Alaska, Virginia (up one point), Massachusetts (down one point), New Hampshire, Delaware and the District of Columbia.

Besides Maryland, the top ten states remained the same, with slight shifts: Connecticut rose one notch to hold the #2 spot, followed by New Jersey (down one spot), Hawaii, Alaska, Virginia (up one position), Massachusetts (down one slot), New Hampshire, Delaware and the District of Columbia.

“The amazing rise of North Dakota in the millionaires rankings clearly demonstrates the power of an industry to quickly create wealth,” Thompson said.  But he indicated that “new industries may not be a sustainable economy,” and cited the nation’s large population centers, including those along the east coast, as more likely to retain their positions as most attractive to wealthy individuals.

There were a few notable declines in the rankings: Louisiana dropped 6 positions to number 38, Texas dropped 5 slots to number 27, erasing gains it made last year; and Georgia lost another 5 places this year for the second year in a row, falling to number 40.

Smallest percentage of millionaires?  Mississippi, Idaho, Arkansas, Kentucky, Tennessee and West Virginia.

The PMI Global Wealth Monitor (GWM) provides ongoing intelligence on the attitudes, behaviors and needs of affluent and High Net Worth consumers to leading organizations in the U.S., Canada, and Europe.

millionaires map

CT Has 3rd Lowest Percentage of Low Income Students in Public Schools, Nationwide Numbers Exceed 50 Percent

For the first time in at least 50 years, a majority of public school students across the country are considered “low-income," according to a new study by the Southern Education Foundation. While poor children are spread across the country, concentrations are highest in the South and in the West. Connecticut has among the lowest percentages in the nation. The latest data collected from the states by the National Center for Education Statistics (NCES), show that 51 percent of the students across the nation’s public schools were low income in 2013. In 40 of the 50 states, low income students comprised no less than 40 percent of all public schoolchildren. In 21 states, children eligible for free or reduced-price lunches were a majority of the students.student computers

Connecticut, which ranked tied for third, was among only ten states where the percentage of “low-income” students was below 40 percent. The states are Virginia (39%), Ohio (39%), Wyoming (38%), Minnesota (38%), Massachusetts (37%), New Jersey (37%), Connecticut (36%), Vermont (36%) North Dakota (30%) and New Hampshire (27%), which had the nation’s lowest percentage of low income (eligible for free and reduced lunches) public school students.

Thirteen of the 21 states with a majority of low income students in 2013 were located in the South, and six of the other 21 states were in the West. Mississippi led the nation with the highest rate: 71 percent, almost three out of every four public school children in Mississippi, were low-income. The nation’s second highest rate was found in New Mexico, where 68 percent of all public school students were low income in 2013.SEF

The report noted that “this defining moment in enrollment in public education in the United States comes as a consequence of a steadily growing trend that has persisted over several decades.”

In 1989, less than 32 percent of the nation’s public school students were low-income. By 2000, the national rate as compiled and calculated by NCES had increased to over 38 percent. By 2006, the national rate was 42 percent and, after the Great Recession, the rate climbed in 2011 to 48 percent, the report indicated.

The 2013 data suggests that six other states are on the verge of reaching a majority of low income students in the near future, if current trends continue. In Indiana and Oregon, 49 percent of the public schoolchildren were low income. In New York and Kansas, the rates were 48 percent. In Idaho and Michigan, rates were 47 percent.

The report concludes by stating t21 states
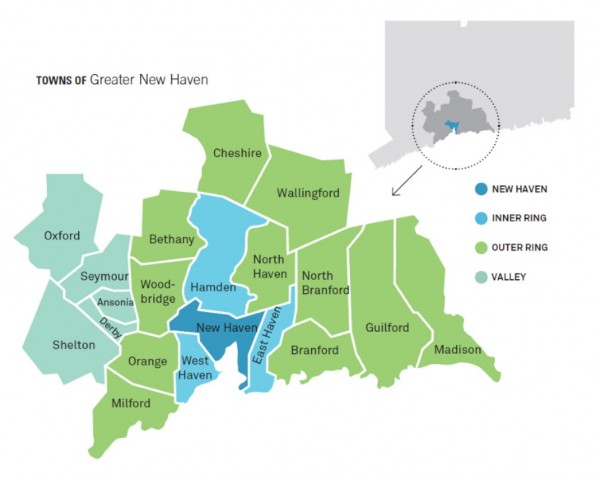
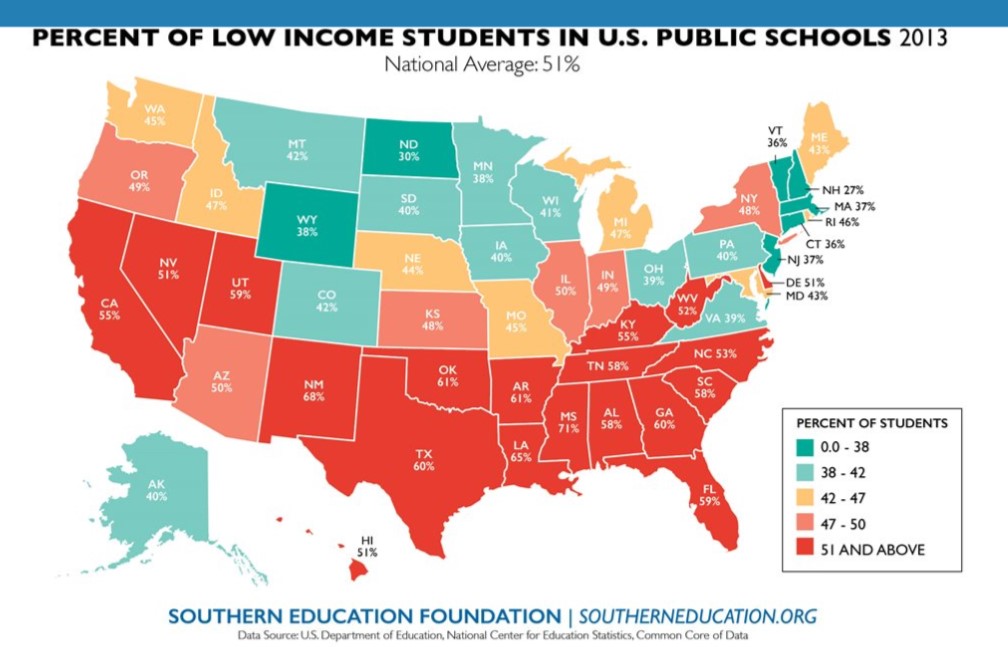
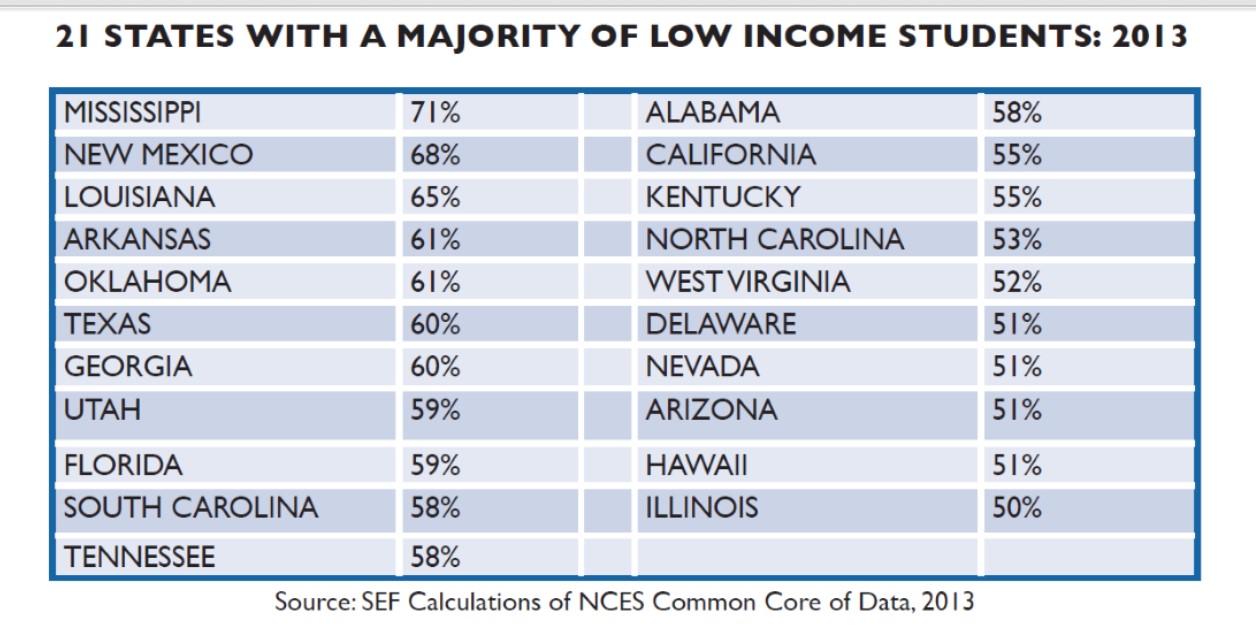
hat “The trends of the last decade strongly suggest that little or nothing will change for the better if schools and communities continue to postpone addressing the primary question of education in America today: what does it take and what will be done to provide low income students with a good chance to succeed in public schools? It is a question of how, not where, to improve the education of a new majority of students.”

Founded in 1867 as the George Peabody Education Fund, the Southern Education Foundation’s mission is to advance equity and excellence in education for all students in the South, particularly low income students and students of color. The organization's "core belief is that education is the vehicle by which all students get fair chances to develop their talents and contribute to the common good."


map