Connecticut's Small Business Friendliness Grade Drops to "D"

A new survey of small business friendliness in the nation’s states has dropped Connecticut’s overall grade from D+ to D, and given the state a failing grade in seven of eleven small business friendliness categories.  The grades dropped as compared with last year's survey. Thumbtack.com, in partnership with the Ewing Marion Kauffman Foundation, released the third annual Small Business Friendliness Survey showing that small business owners in Utah, Idaho, Texas, Virginia and Louisiana gave their states the highest rating for friendliness to small business. In contrast, small business owners gave California, Rhode Island and Illinois an "F," while New Jersey joined Connecticut in earning a "D" grade. grade D

More than 12,000 entrepreneurs nationwide participated in this year's survey - the largest of its kind and  the only survey to obtain data from an extensive, nationwide sample of small business owners to determine the most business-friendly locations.

The survey ranked states on specific categories, including: the ease of starting a business, ease of hiring, state and local business regulations, health & safety regulations, employment, labor & hiring regulations, tax code and tax-related regulations, licensing forms, requirements and fees, environmental regulations, zoning and land use regulations, and the availability of training & network programs for small business owners.thumb logos

Connecticut received a B in two categories: ease of hiring and training & network programs, and a D in one: ease of starting a business. In all other categories, Connecticut received an F for small business friendliness.

Some of the key findings for Connecticut, according to the survey of small business owners:

  • Connecticut received a D for its friendliness towards small business, one of the worst grades in the country.
  • Connecticut received the worst grade in the nation for its regulatory friendliness.
  • The state rated in last place for its health and safety, licensing, environmental regulations, and zoning laws.
  • Small businesses in Connecticut had the second worst outlook for the national economy of any state.
  • Female entrepreneurs in Connecticut rated the friendliness of their state government 9 percent higher than their male counterparts.

connecticutIn last year’s survey, Connecticut did not receive a single grade of “F.” The state’s overall grade was D+, and included an A in training & networking,  B in ease of hiring, and  B- in health & safety regulations. Other grades were D+, C- and C. In the first survey conducted, in 2012, Connecticut’s overall grade was D, and the state was not graded F any category.

"Creating a business climate that is welcoming to small, dynamic businesses is more important than ever, but rarely does anyone ask small business owners themselves about what makes for a pro-entrepreneur environment," says Jon Lieber, chief economist of Thumbtack.com. "Thousands of small business owners across the country told us that the keys to a pro-growth environment are ease of compliance with tax and regulatory systems and helpful training programs."

Some of the survey's key findings include:

  • Small businesses in Texas, Utah and Idaho have rated their states in the top five every year this survey has run, while California and Rhode Island have been rated in the bottom five every year.
  • The friendliness of professional licensing requirements was the most important regulatory issue in determining a state's overall friendliness to small businesses. Closely following licensing requirements was the ease of filing taxes.
  • Once again, tax rates were a less important factor than the ease of regulatory compliance in determining the overall friendliness score of a jurisdiction. Two-thirds of respondents said they paid their "fair share" of taxes – that is, they felt like they were neither under-paying nor over-paying.
  • Small business owners who were aware of training programs offered by their government were significantly more likely to say their government was friendly to small business than those who weren't.


Connecticut’s Taxpayer Burden Among Nation’s Highest, Report Finds

The states with low tax burdens are experiencing net immigration, and states with high tax burdens are experiencing high net outmigration, according to an analysis by Governing magazine of data from the Tax Foundation. Connecticut, which the publication lists as having among the nation’s highest taxpayer burdens, is seeing more residents leaving than arriving, the data indicates. The 15 states with high “Tax Burdens and Taxpayer Burdens” are, ranked from highest to lowest, Connecticut, New Jersey, New York, California, Illinois, Massachusetts, Maryland, Hawaii, Rhode Island, Delaware, Vermont, Kentucky, Michigan, Pennsylvania and West Virginia.

Here’s how Governing described the Tax Foundation’s latest annual study: “Across the 50 states, the share of revenue coming from local and state taxes varies significantly, as does the mix of property, sales and income taxes. When measuring the burden imposed on a given state’s residents by all state and local taxes, one cannot merely look to collections figures for the governments located within state borders. There is a significant amount of tax shifting across state lines, and this shifting is not uniform. Further, this shifting should not be ignored when attempting to understand the burden faced by taxpayers within a state.”tax burden map

That is especially true in Connecticut, where significant numbers of residents work in New York, Massachusetts and Rhode Island. Addressing these issues, the Tax Foundation estimates the total state and local tax burdens arising from all sources as a share of state income. The Tax Foundation calls this statistic the "State-Local Tax Burden." In the Tax Foundation's most recent study, covering fiscal 2011, the "State-Local Tax Burden" ranged from a low of 6.9 percent (Wyoming) to a high of 12.6 percent (New York).

According to the report, “New York residents experienced the highest burden at 12.6 percent of income. Next were New Jersey and Connecticut, where residents paid 12.3 and 11.9 percent, respectively. Rounding out the top ten in highest state-local burdens are California, Wisconsin, Minnesota, Maryland, Rhode Island, Vermont, and Pennsylvania. Connecticut taxpayers’ burden has risen 0.8 percentage points from 11.1 percent in 1977 to 11.9 percent in 2011, putting the state in third place.

New York, New Jersey, and Connecticut have occupied the top three spots on the list since 2005. The report notes that “this may be partially attributed to high levels of expenditures which must be sustained by high levels of revenue. Further, in the case of Connecticut and New Jersey, relatively high tax payments to out-of-state governments add to already high in-state payments. This is likely related to the fact that these are high income states that pay high levels of capital gains. High levels of capital gains will result in residents paying an increased share of other states’ business taxes.”

The report also indicates that “Maine and Vermont have the largest shares of vacation homes in the country, and they collect a sizeable fraction of their property tax revenue on those properties, mostly from residents of Connecticut, Massachusetts, and other New England states.”

The organization Truth in Accounting calculates "Taxpayer Burden" -- the per-taxpayer share of the money needed (or available) to pay bills. In fiscal 2011 (the same year as the latest Tax Foundation results), the "Taxpayer Burden" ranged from a low of minus-$34,100 (a surplus, in Alaska) to a high of $50,900 (in Connecticut).

tax burdenAdded Bill Bergman, the director of research for Truth in Accounting, a Chicago-based nonprofit working to “promote truthful, timely and transparent government financial reporting”: “States that rank high on both Tax Burden and Taxpayer Burden face another challenge. The third whammy is that citizens in these states are leaving for other states, taking their taxable spending, property and income with them. It seems reasonable to suspect that their choice to leave may be directly or indirectly related to state fiscal conditions.”

Nationally, state and local tax burdens dropped in 2011 as compared with 2010, largely attributable to incomes rising that year for the first time since 2008, Governing reported. The study methodology noted that “when Connecticut residents work in New York City and pay income tax to both the state and the city, the Census Bureau will count those amounts as New York tax collections, but we count them as part of the tax burden of Connecticut’s residents.”

Since 1937, the Tax Foundation’s “research, insightful analysis, and engaged experts have informed smarter tax policy at the federal, state, and local levels” the organization’s website explains.

With Hockey History, North Carolina and Connecticut Look to Baseball, Attendance Growth

North Carolina and Connecticut – two states forever linked in the cross-currents of sports by the Hartford Whalers relocation to the Tarheel State in 1997, are both using 2014 to heighten their professional baseball credentials. The City of Hartford has announced that the Double A franchise currently in New Britain will be moving to the Capitol City in 2016 in a soon-to-be-built $60 million, nearly 10,000 seat stadium. Just two months ago, the Triple A Charlotte Knights opened their newly constructed 10,200 seat $55 million downtown stadium. The Knights are an affiliate of the Chicago White Sox. Ground was broken on the new stadium in September 2012, about an 18 month construction schedule.

BB_T_Ballpark_media_7suaxdjb_lv2jd5cuThe first Knights game took place on April 11, 2014. (photo at left) The stadium features a two-level club with skyline views as well as a VIP, climate-controlled club with full service bar. In addition to corporate suites, there are 987 club seats at the new Charlotte stadium. Of those, 170 on the upper level sell for $41.50 per game, or nearly $3,000 per season. The remaining 817 club seats, at $21 per game, sell for about $1,500 annually.  All of the club seats were sold out 10 months prior to the season opener, according to the Knights website.  Season tickets require either a two- or four-year commitment. Naming rights to the stadium were sold to BB&T Corporation in 2012. Published reports also indicate that multiple new hotels are expected to open in the area around the stadium in the coming years, along with restaurants and retail.

The Charlotte team’s website reports that “National ballpark consultants conservatively estimate that in its first year BB&T Ballpark should draw at least 600,000 fans just for baseball.” In addition to obtaining corporate sponsorships, among the fundraising initiatives along the way in Charlotte were commemorative bricks sold to be placed in the stadium’s entrance, at a cost of between $90 to $195, containing individual messages determined by purchasers. A portion of the sales went to local charities in Charlotte.

Comparing Attendance Numbers, Possibilities

The Rock Cats drew more than 307,000 fans to their 6,100-seat stadium in New Britain last year, ranking sixth in the 12-team Eastern League. The Knights were last in attendance in the Class AAA International League last year, with an average of 3,803 per game, down from a high of 4,736 in 2006, according to the Charlotte News Observer. In 2013, the New Britain Rock Cats averaged 4,653 fans per game, which ranked 59th among baseball’s minor league teams. Charlotte ranked 80th. The top team in the league - and in minor league baseball - the Columbus Clippers, drew 9,212 per game.

Knights website

The AAA Pawtucket Red Sox average attendance in 2013 was 7,827, ranked #10 in minor league baseball. The Double-A Portland Sea Dogs, also a Red Sox affiliate, ranked 47th, drawing an average of 5,096 per game. Among Double-A teams, Portland ranks tenth.

The top minor league teams, based on average attendance in 2013, are in Columbus, Lehigh Valley, Indianapolis, Sacramento, Dayton, Buffalo, Louisville, Round Rock (Texas) and Albuquerque. The top Double-A teams are in Frisco, TX (7,057); Richmond, VA (6,689); Reading, PA (6,321); Tulsa, OK (5,704); Birmingham, AL (5,669); Corpus Christi, TX (5,498); Trenton, NJ (5,373) and New Hampshire (5,125).

On July 12, 2008, the Rock Cats established a franchise record for single game attendance, with a crowd of 8,115 at New Britain Stadium. The record was broken on June 27, 2009, with a crowd of 8,212. The Rock Cats reached the 8,000 mark once again on May 31, 2014 with a crowd of 8,079.

For those who wonder if there is a Triple A future for a Hartford baseball stadium, the history of Pawtucket may be of interest. The first team to be named the Pawtucket Red Sox debuted in 1970 as a member of the Double-A Eastern League, according to Wikipedia. After three seasons as a Double-A Red Sox affiliate, Pawtucket's Eastern League franchise moved to Bristol, CT in 1973 to make room for the new Triple-A PawSox. And as most Connecticut sports fans recall, the Bristol franchise then moved to New Britain in 1983, first as a Red Sox Double-A affiliate (through 1994) and then as the farm team of the Minnesota Twins.IMG_6669

And might the presence of a stadium in Hartford, rather than New Britain, cause the Red Sox to return with an affiliate in Connecticut? Apparently not any time soon. The Sox appear set in Pawtucket and Portland.

In January 2013, the Portland Sea Dogs announced an extension of their affiliation with the Boston Red Sox as the Double A minor league team. Their contract was set to end after the 2014 season but the extension through the 2018 season was announced during the Portland Sea Dogs Hot Stove Banquet by Red Sox director of player development Mike Hazen and Sea Dogs president Charlie Eshbach. Eshbach served as Eastern League President for 11 years and is the league's longest serving active member  – dating back to his tenure as general manager of the Bristol Red Sox in Connecticut, not too many years after attending college at UConn.

“We are delighted to extend our relationship with the Portland Sea Dogs for an additional two seasons,” said Hazen at the time. “We are extremely fortunate to work with some of the best people in minor league baseball in Portland. The Burke family, Charlie Eshbach, and the entire Sea Dogs organization always go above and beyond to provide support to our players and staff. With the Sea Dogs, our minor leaguers experience the ideal environment to succeed and grow.”

The Sea Dogs are now in their 21st season at Hadlock Field, their 12th as an affiliate of the Boston Red Sox. The Red Sox originally entered into an agreement with the Sea Dogs following the 2002 season, when Portland changed affiliations from the Florida Marlins.

 (photo credit: Rob Kavaler)

rankings

Higher Percentage of Part-time Workers in CT Than New York, New Jersey, Lower Than New England

Connecticut's percentage of part-time workers (22.2 percent) outpaces much of the Northeast, South, Midwest and West, according to the latest Connecticut Economic Digest (CED), produced by the state Department of Labor and Department of Economic and Community Development. In the first examination of part-time employment in more than a decade, the publication noted that part-time employment in Connecticut numbered 383,000 - 69.5 percent of which (266,000) was women. This statewide share is among the highest in the country, which had a 50-state average of 64 percent.

part time chartConnecticut’s part-time employment share of 22.2 percent is the lowest in New England but considerably greater than neighboring states in the tri-state area, which have employment shares respectively of 17.6 percent (New York) and 17.9 percent (New Jersey), the analysis by the state Department of Labor indicated.

Part-time employment is all employment that amounts to less than 35 hours per week. Since 1997 it has averaged about 20 percent of total employment in Connecticut and fell to 18.6 percent in 2000, according to the CED, before climbing.

In recent years it has gradually trended upward and was 22.2 percent of employment in 2012, the most recent year of annual average datCED
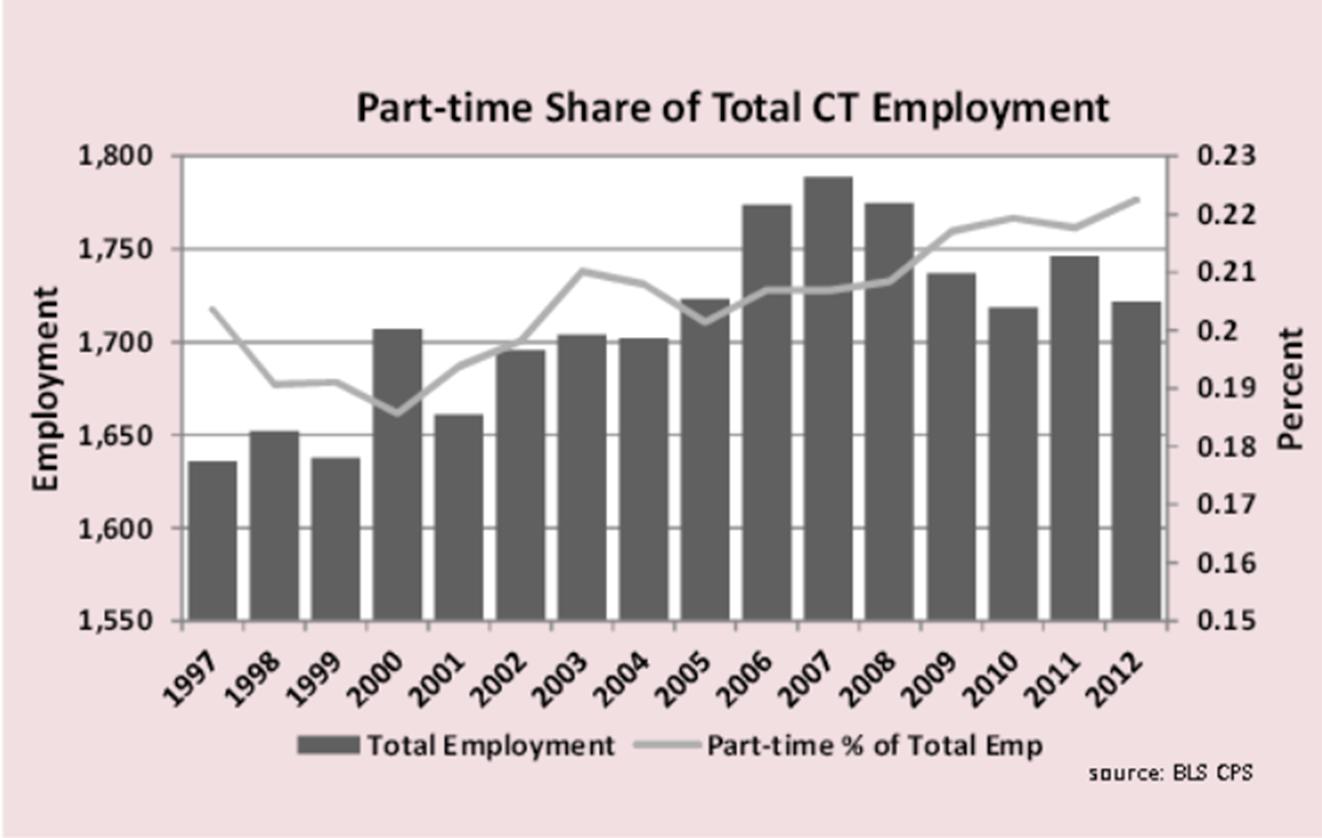
a and the basis for the analysis. The breakdown of hours worked shows that Connecticut has less under 35 hours per week employment than other New England states but more than the Northeast region overall. Part-time employment was 23.3% of all New England employment in 2012, higher than any other census division in the country. The other eight census divisions averaged 19.3% with the West- South Central division lowest at 16.4%.

While those choosing to work part time remain the bulk of part-time workers, the number of those working less than full time has grown since 2005 as more workers have their hours cut by employers or were unable to find full-time jobs during or after the recession. From 2009 to 2011, the number of workers who wanted full-time employment but could only find part-time jobs rose 37.5 percent to 33,000 from 24,000, Hartford Business Journal reported. part time 2

The report points out, however, that a majority of part-time employment in Connecticut is due to voluntary reasons, and not a result of prevailing economic conditions. In 2012, voluntary part-time employment in Connecticut was 76.4 percent of all part-time employment, in line with the 50-state average of 76.8 percent.

The industries with the lowest average weekly hours worked are leisure and hospitality, other services, and education and health services. In 2013, these industries averaged 25.8, 30.9, and 31.2 work hours per week, according to the Connecticut Economic Digest report issued in May.


Mystic Aquarium Honored at White House Ceremony with National Medal

Mystic Aquarium has earned some high profile attention this month, recognized at a White House ceremony hosted by First Lady Michelle Obama. The Institute of Museum and Library Services (IMLS) honored Mystic Aquarium as the only aquarium or zoo nationwide to receive its National Medal for Museum and Library Service for 2014. Impressively, Mystic Aquarium was one of four Connecticut finalists considered for the National Medal, along with the Hartford Public Library, Mattatuck Museum in Waterbury and Otis Library in Norwich. A total of only 30 institutions across the country were finalists, from which ten winners were ultimately chosen.

The National Medal is the nation’s highest honor conferred on museums and libraries for service to their communities. The Institute of Museum and Library Services, an independent agency of the U.S. govemedal_lg-400x405
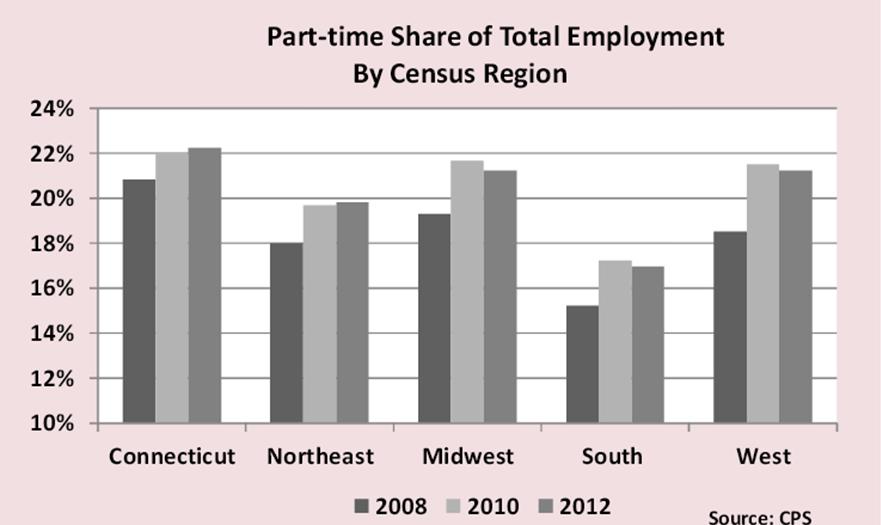
rnment with the mission to create strong libraries and museums that connect people with information and ideas, is celebrating its 20th year of saluting institutions that make a difference for individuals, families and communities.

Mystic Aquarium gives back to the community with a direct financial impact of $72.2 million annually. In addition, the aquarium buys $5 million in services and supplies from Connecticut businesses annually. The institution’s conservation efforts protect the vitality of Long Island Sound, an important revenue-generating natural resource for Connecticut. It is the largest informal science education provider in Connecticut and Southeastern New England, reaching 100,000 students annually. whale

The work of Mystic Aquarium was brought to the attention of Susan H. Hildreth, Director of the Institute of Museum and Library Services, by some of Connecticut’s most prominent cultural, education and government leaders. Rodney A. Butler, Mystic Aquarium Trustee and Chairman of the Mashantucket Pequot Tribal Nation, nominated the Aquarium for the National Medal, noting the pivotal role the Aquarium plays with its education and cultural exchange program for Native American high school students from the village of Point Lay, Alaska, and the Mashantucket Pequot Tribal Nation in southeastern Connecticut.

A major criterion for the award is the institution’s impact on members of its local community. Dr. Stephen M. Coan, President and CEO of Sea Research Foundation, the parent of Mystic Aquarium, who accepted the National Medal from Mrs. Obama, said: “We are honored to receive this prestigious award. We are committed to our educational and public engagement programs that make Mystic Aquarium not only an enjoyable family destination, but also a research facility dedicated to protecting our oceans and its aquatic creatures.”

U.S. Senators Richard Blumenthal and Christopher Murphy supported the nomination along with Stonington Public Schools, which cited the Aquarium’s exemplary work with young people with intellectual disabilities. Michael Cotela, Executive Director of the Boys & Girls Club of Stamford extolled the Aquarium’s critical educational programming for underserved communities.

Founded in 1973, Mystic Aquarium has a collection of 4,00Medals2014_Mystic0 animals, including such species as beluga whales and the endangered African Penguin.


PHOTO (Left to right): Justin Richard, Stephen M. Coan, Mrs. Obama.

When One CT Beer Week Is Just Not Enough

For Connecticut’s growing beer industry, a single beer week was just not enough.

The Connecticut Beer Wholesalers Association, which is comprised of six beer wholesalers in Connecticut and conducted the CT Beer Week marketing campaign for the first time last May, has decided to double down on the effort in 2014.  The second annual Beer Week later this month will be the first to two “weeks” planned for this year.

The first Beer Week ict-beer-week-2014s coming up during the week of May 12 – 18, the same week as American Craft Beer Week. The second one is slated for October 14-20, and coincides with CT Restaurant week. Consumers are asked to “join us as we celebrate the growth of an industry in partnership with craft brewers, restaurants and retailers.”

Organizers say the "Brew & Buy Local" campaign brings focus to the Connecticut organizations that work together to strengthen “a vibrant industry filled with cooperative spirit and a desire to brew something good for Connecticut!”

Among the events in Connecticut later this month will be the 4th Annual Rising Pint Brewfest, designed to kick off American Craft Beer Week. The event will be May 10, 2014 at Rentschler Field, featuring over 90 craft breweries, live bands and local restaurants.  Proceeds of the Rising Pint go to Folds of Honor, a foundation working to help the families of our fallen and severely injured soldiers.CTBeerWeekTshirts

A full calendar of beer week events has been developed, and features more than 40 events around the state.  Connecticut has 22 local breweries, with a dozen new breweries being developed including three slated to open later this year in Oxford and Glastonbury.

Top Main Street Revitalization Initiatives in Connecticut Named

Manchester, New Britain, Waterbury, Seymour and the Northwestern CT Regional Planning Collaborative are being highlighted by the Connecticut Main Street Center (CMSC) for their strategic downtown revitalization initiatives.

As recipients of the organization’s 2014 Awards of Excellence, the efforts include a community college partnering with the downtown and others to create a co-working space; connecting the Naugatuck River with the downtown through extended trails and a linear park; and regionalizing marketing for a collection of small village centers.

The annual  Connecticut Main Street AwardCT Main Street LOGOs of Excellence were created in 2003 to recognize outstanding projects, individuals and partnerships in community efforts to bring traditional downtowns and neighborhood commercial districts back to life, socially and economically. All of the award recipients continue the tradition of stimulating economic development and reinvigorating Connecticut's social centers, officials said.

"Our members continually inspire us with how creatively they respond to the needs of their community," said CMSC President & CEO John Simone. "They're deeply committed to every aspect of their downtown - the businesses, public spaces, local institutions, and above all, creating a place that people really enjoy living in and visiting. We couldn't be happier with how this year's winners represent all we stand for in downtown revitalization."

Submissions were judged on criteria which included innovation, replication, representation, partnerships utilized, and outcomes.  The awards will be presented at the 2014 Connecticut Main Street Awards Gala on June 9th at Roia Restaurant in downtown New Haven.  Award recipients, by category, are:

Events & Programming

Award of Excellence for Wine on Main St. to Main Street Waterbury, Terry Boyd, Braza Churrascaria, Courtyard by Marriott, Diorio's Restaurant, Shamrock Pub & Grill, Tryst Lounge, Signature's Restaurant, City Hall Café, Howland Hughes Center, and Nutmeg Fine Wine & Spirits.

Marketing & Communications

Award of Excellence for Discover NW CT to Northwestern CT Regional Planning Collaborative (representing the Towns of Sharon, Falls Village, Goshen, Cornwall, Canaan, Salisbury, Kent, and Norfolk), Studio Two, local business owners in the eight towns in the "Secret Corner", and local historical societies.

Public Space

Award of Excellence for Complete Streets Master Plan for Downtown New Britain to Downtown Streetscape Working Group, the City of New Britain (including the Mayor's Office, Public Works, Planning and Parks Departments), New Britain Downtown District, Polonia Business District, Central Connecticut State University/ITBE, Capitol Region Council of Governments, and Project Consultant Team.

Renewed Commitment to Main Street

Award of Excellence for Seymour Downtown Action Strategy to the Town of Seymour, Seymour Economic Development Commission, Seymour Downtown Committee, Greater Valley Chamber of Commerce, Naugatuck River Greenway Steering Committee, Naugatuck Valley Council of Governments, Downtown Merchants Association, Planimetrics, Milone and MacBroom; CT Department of Energy and Environmental Protection,and the National Oceanic and Atmospheric Administration.

Main Street Partnership

Award of Excellence for Axis901 and MCC on Main (Manchester) to First Niagara Bank, Manchester Community College (MCC) Foundation, and the Town of Manchester (Board of Directors and Staff).

Economic & Business Development

Award of Excellence to The Business Women of Grand Street (Waterbury) to The Dutch Flower Lady, Technology Forensics, John Bale Book Company, Fine Craft Jewelers, Dottie's 2, Princess Lingerie, Brass City Market on Field, and Fashion Addict.

Hartford Ranked #35, New Haven #39 in Income Inequality Among US Cities; Bridgeport-Stamford-Norwalk Is Nation's Most Disparate Region

A new analysis ranking the cities with the greatest income inequality includes Hartford and New Haven in the top 50.– and the Bridgeport-Stamford-Norwalk metropolitan area is the metro region with the largest income disparity in the nation.

The major cities with the most dramatic income inequality in their population are, ranked in order:  Atlanta, New Orleans, Miami, Jackson (Mississippi), Gainesville (Florida), Tampa, Cincinnati, Athens (Georgia), Providence, Berkeley and Boston.  Seven of the top 11 are cities in the Southern U.S.

Among New England cities, Providence ranked #9, Boston at #11, Cambridge at #12, Hartford at #35, and New Haven at #39.  Among other major cities, New York ranked #13 and Washington, D.C. ranked #15.

Bloomberg ranked 300 U.S. cities with populations of at least 100,000income-inequality-shutterstock_146836310 based on their level of income inequality and identified the 50 with the greatest inequality. The media outlet also ranked the top 20 metropolitan areas with the greatest income disparity.

On that list, Bridgeport-Stamford-Norwalk ranked as the metro area with the most income inequality in the nation.  Among the 20 regions with the greatest disparity, one-quarter are in Florida – including Naples-Marco Island at #2 and Gainesville at #3.  College-Station-Bryan (Texas) was #5 and New York-Northern New Jersey was #5 on the list of metro areas. 

They methodology for the analysis was use of the “Gini coefficient,” which is calculated by the U.S. Census from household income share by quintiles, used to measure distribution of wealth. It ranges from zero, which reflects absolute equality, to one, complete inequality.

Hartford’s Gini coefficient was 0.5176, New Haven’s was 0.5144.  By comparison, Atlanta’s was 0.5882, and Providence 0.5445.  New Haven’s income inequality improved slightly, by 5.4 percent, since 2008, while Hartford’s disparity grew slightly, by just over 1 percent, according to the data.

The Bridgeport-Stamford-Norwalk region had a Gini coefficient of 0.5459.

It was reported that in New Haven, 26.1 percent of the population was living in poverty; in Hartford the figure was 38 percent.  In Hartford, 54 percent of household income was in the highest quintile, while 2 percent was in the lowest quintile.  In New Haven, 38 percent was in the highest quintile while 2.5 percent placed in the lowest.

In the ranking of the 50 cities with the most income inequality, Hartford was between Lafayette, Louisiana and Cleveland, OH.  New Haven ranked between Charleston, S.C. and Tulsa, OK on the list.

The average score for the United States was 0.4757. In 2013, a person living alone making less than $11,490 was classified as in poverty. The threshold increased by $4,020 for each additional household member, Bloomberg reported.

Soda Tax Won't Hurt Job Prospects, Study Finds

As the Connecticut legislature considers a proposal to implement a 2 percent tax on sodas, proposed by Senate Majority Leader Martin Looney at the suggestion of New Haven Mayor and former state senator Toni Harp, two new academic studies challenge the beverage industry’s view that state and local taxes on sugary drinks will hurt employment, and offer suggestions to policy makers based on the tobacco tax experience. Harp has said the soda tax would discourage consumption of the sugary beverages – part of her campaign to combat obesity – and bring in public health logoan estimated $144 million in revenue for the state each year. It would tax all beverages “high in calories or sugar” by two percent, but does not specify how many calories or grams of sugar would trigger the tax.

The studies, appearing in the February and March issues of the American Journal of Public Health, argue, in one case, that claims of employment losses are off base because they focus only on the effects within the industry, ignoring the economic activity that comes with people substituting lower-priced goods for more expensive products as wellsoda as new spending from tax revenues.  The other study says that tobacco taxes offer a how-to road map for policy makers.

The study to be published in March, led by Jennifer L. Pomeranz, JD, MPH, while at the Yale Rudd Center for Food Policy and Obesity at Yale University, uses as its premise that “excise taxes on sugary beverages have been proposed as a method to replicate the public health success of tobacco control and to generate revenue.”

Sugary Beverage Tax Policy: Lessons Learned from Tobacco indicates that “as policymakers increase efforts to pass sugary beverage taxes, they can anticipate that manufacturers will emulate the strategies employed by tobacco companies in their attempts to counteract the impact of such taxes.”  Pomeranz suggests that “policymakers should therefore consider two complementary laws—minimum price laws and prohibitions on coupons and discounting—to accomplish the intended price increase.”

Researchers at the University of Illinois, in a just-published study in the February issue of American Journal of Public Health, found that a 20 percent increase on the price of sugar-sweetened beverages would have an overall positive impact on the labor market.

The American Beverage Association has traditionally argued that manufacturers, distributors and small business owners, particularly grocers and convenience store proprietors, would suffer were soda taxes to be imposed, but the study says that’s not likely.

In recent years, proposals to tax those beverages fell short in California, Vermont, Hawaii, Massachusetts, Mississippi, New York and Rhode Island, Governing magazine reported.  In Maine voters passed a soda tax of 42 cents per gallon in 2008 but repealed it two years later amid a major lobbying effort from the American Beverage Association. Voters in Washington state similarly reversed their legislature in 2010.  As of the end of state legislative sessions in 2011, Governing reported, only four states had taxes specifically targeting sugary beverages, including Arkansas, Tennessee, Virginia, and West Virginia, according to the Tax Foundation.

In the study publstrawished this month, researchers ran a simulation of the impact of 20-percent soda tax in Illinois and California—selected for regional differences—and found slight employment increases would occur, but the net effect would be close to nothing. They found that people choose to spend their money on other things, not to forego spending entirely, and that employment gains in other sectors of the economy far outweigh the job losses for soda makers, National Journal reported.

“We find there are losses in the beverage industry, but when you’re talking about the whole economy suffering job losses, you can’t just talk about your own industry,” Lisa Powell, health policy professor at the University of Illinois at Chicago and the study’s lead author, told National Journal. “Using job loss as a scare tactic for the economy overall is misleading.”

Public health advocates have warned of a link between added sugar and illnesses ranging  from Type 2 diabetes and obesity to heart disease and osteoporosis. The caloric intake of sugary beverages increased dramatically from 1988 to the mid 2000s, though consumption has dropped across all age groups in recent years, Governing reported, with some citing the increased public attraction to teas and other beverages.  Like Harp and Looney in Connecticut, some elected officials around the country have proposed raising taxes on sugary drinks in order to reduce consumption.  The New Haven Register reported that Harp has pointed out that revenue from the cigarette tax has decreased, showing that the effectiveness of a tax in reducing consumption.Jennifer-Pomeranz

Pomeranz is a public health law and policy researcher focusing on marketing, labeling and youth access issues related to food and beverages, over-the-counter diet drugs, and dietary supplements, publishing on topics including discrimination, the First Amendment, public health preemption, and innovative regulatory strategies to address public health problems such as obesity. She is Assistant Professor at the Center for Obesity Research and Education in the Department of Public Health and at the College of Health Professionals and Social Work at Temple University, having served previously as Director of Legal Initiatives at the Yale Rudd Center for Food Policy & Obesity.  She is currently the Policy Chair of the Health Law Section of the American Public Health Association and the official liaison between the American Academy of Pediatrics and the American Public Health Association.lisa powell 2

Lisa Powell is a Senior Research Scientist in the Institute for Health Research and Policy and Research Professor in the Department of Economics at the University of Illinois at Chicago. She has extensive experience as an applied micro-economist in the empirical analysis of the effects of public policy on a series of behavioral outcomes.

A 2011 study by the Yale Rudd Center for Food Policy & Obesity found that young people are being exposed to a massive amount of marketing for sugary drinks, such as full-calorie soda, sports drinks, energy drinks, and fruit drinks.  The study, described as the most comprehensive and science-based assessment of sugary drink nutrition and marketing ever conducted, found that companies were marketing sugary drinks targeting young people, especially black and Hispanic youth.

This story was reported by CT by the Numbers on February 16, 2014

Connecticut Ranks #48 in Federal Income Tax Refunds

Connecticut ranks #48 in the nation in income tax refunds its residents receive from the federal government.  Just over 11 percent of the taxes paid by state residents to the federal government are refunded to them, a percentage that is better than only the states of Delaware and Minnesota, and the District of Columbia.

By comparison, Mississippi residents receive more than three tbiggest tax refundsimes that percentage.  One third of the taxes paid by Mississippi residents – 34.84 percent – come back in refunds.  West Virginia residents receive 30 percent of the taxes they paid, South Carolina 26.27 percent and Alabama 26 percent.  Bloomberg.com reviewed Internal Revenue Service (IRS) data and ranked the 50 states and the District of Columbia based on the percentage of gross individual income taxes withheld or paid that were returned as refunds the following year.

Figures are for a five-year period: fiscal years 2007 through 2011 for tax collections and fiscal years 2008 through 2012 for refunds. For both collections and refunds, data include individual income tax withheld, individual income tax payments, FICA taxes, SECA taxes, unemployment insurance taxes, railroad retirement taxes and estate and trust income taxes. Refunds include interest.Tax-Refund

Connecticut’s gross total individual federal income tax collected between 2007 to 2011 was $206.31 million.  Total individual income tax refunded from the federal government between 2008 to 2012 was $23.56 million.  Joining Connecticut among the states with the lowest percentage refunded, in addition to Minnesota and Delaware, are Massachusetts, New Jersey, Ohio, New York and Nebraska.