Connecticut Energy Costs are Third Highest in the US, Analysis Finds

The only states in the nation with higher monthly energy bills for consumers are Mississippi and Hawaii. Connecticut is ranked as the 3rd most energy expensive state in the country, according to a new analysis by WalletHub, which used six key metrics to rank the swh-best-badges-150x150-2tates according to their tendency to produce the highest or lowest monthly energy bills. The analysis points out that “lower prices don’t always equate with lower costs, as consumption is a key determinant in the total amount of an energy bill.” Connecticut’s monthly energy cost for consumers, according to the analysis, is $404, ranking the state 49th out of 51 (the 50 states plus the District of Columbia). Mississippi’s total monthly cost paid by consumers averages $414, while Hawaii’s is $451.

In terms of specific energy sources, the state ranked 50th in monthly electric cost ($143) and 48th in the cost of natural gas ($94). Perhaps due to the size of Connecticut, the state ranked 14th in fuel cost, at $167 per month, despite the state’s gas tax being among electricity pricethe highest in the nation. (see breakdown below)

In the United States, 7.1 percent of the average consumer’s total income is spent on energy costs, including fuel, natural gas and electricity.

The states with the least expensive energy costs for consumers, taking consumption into account, are Colorado ($301), Washington State ($302), Montana ($305), Rhode Island ($307), Nebraska ($312), the District of Columbia ($314), Pennsylvania ($317), Arkansas ($319), Delaware ($319) and Iowa ($319).

The other New England States, in addition to Rhode Island landing towards the top and Connecticut near the bottom, were bunched in the middle: Massachusetts ranked #35, New Hampshire #26, Vermont #28, and Maine #32. natural gas

Breaking out prices from consumption, Connecticut’s energy picture for consumers as compared with other states, is:

  • 49th – Price of Electricity
  • 16th – Electricity Consumption per Consumer
  • 44th – Price of Natural Gas
  • 48th – Natural Gas Consumption per Consumer
  • 46th – Price of Fuel
  • 10th – Fuel Consumption per Driver

The analysis was released in July because it tends to be the hottest month of the year in the contiguous U.S., and as a result it has the highest energy consumption.wallethub map

If you’re wondering how all this was calculated, WalletHub provides the answer: (Average Monthly Consumption of Electricity x Average Retail Price of Electricity) + (Average Monthly Consumption of Natural Gas x Average Natural Gas Residential Prices) + [Average Fuel Price * (Average Monthly Vehicle Miles Traveled / Average Car Consumption / Number of Drivers)] = Average Monthly Energy Bill Consumers Pay in Each State

WalletHub, described as “the social network for your wallet,” provides data to help readers “make smart financial decisions.” The site points out that “during the summer, when many Americans undergo major life transitions such as relocating to start a new job or start a family, the difference in energy costs among states becomes an important financial consideration.”  Connecticut ranks #49.


CT’s 4th Congressional District Ranks #5 in US for Income Inequality

Connecticut’s 4th Congressional district, centered in Fairfield Country, has been ranked as the district with the 5th highest level income inequity in the nation. A ranking of congressional districts of by their level of income inequality, conducted by Bloomberg, uses the Gini coefficient, a formula that measures the distribution of income across a population. The closer a Gini number is to 1, the greater the level of inequality; the closer to zero, the closer to perfect equality.

Generally, the Bloomberg Businessweek website points out, the U.S. congressional districts with the most inequality share certain traits: “they contain a small, enormously wealthy elite surrounded by impoverished neighbors.” Most of the districts with the greatest disparity are located in or near major urban metropolitan aRich-vs-poor-directionsreas such as New York, Philadelphia, Chicago, Boston, Atlanta, and Washington.

The congressional district where inequality is highest turns out to be New York’s 10th, with a Gini coefficient of .587; followed by Pennsylvania’s 2nd District, at .583; Illinois’ 7th District, at .574, and Florida’s 27th District at .562. Connecticut’s 4th District is next, at .561, followed by New York’s 12th District, Ohio’s 11th District, Georgia’s 8th District and New York’s 16th District. The most equal district is Virginia’s 11th, at .385.

"The big take-away," according to Bloomberg Businessweek: “A strikingly high level of inequality exists throughout the United States.” Also of note, 9 of the top 10 districts with the greatest income inequality are currently represented in Congress by Democrats, including Connecticut’s Jim Himes, Georgia’s John Lewis, Washington D.C.’s Eleanor Holmes Norton, and New York’s Jerrold Nadler, Carolyn Maloney and Eliot Engel.

Breaking down the state’s population into five segments, by income, Connecticut ranked 10th in the share of household income among the lowest income quintile, 5th in the second quintile, 4th in the third quintile, 5th in the fourth quintile at and 4th in the highest-income quintile.

The website takes the state-by-state comparison one step further, providing context by comparing the state data with data compiled by the Central Intelligence Agency, which tracks the Gini coefficient of 139 countries.

“What jumps out,” according to the website report on the data analysis, “is how lousy the United States looks. Our best district in terms of equality (VA-11) is only as good as Portugal, which sits at a pedestrian 71st on the CIA’s list, right in the middle of the pack. That means that the level of equality in every congressional district in America falls below the midpoint of the CIA’s 139-country ranking.”

“Even the best U.S. district has higher inequality than any number of countries you probably don’t associate with economic egalitarianism: Greece, Niger, Ethiopia, Egypt, Pakistan, Kosovo, Mongolia, Ukraine, Bangladesh. The most equal U.S. congressional district can’t compare with the national averages of New Zealand, France, Canada, Netherlands, Australia, Switzerland, Belgium, Germany, and Austria. Most districts in the U.S. (those ranked 39th through 429th) fall in a narrow Gini band between .4 and .499, putting them between Zimbabwe (20th on the CIA list) and the United Kingdom (60th).”

In 2013, a person living alone making less than $11,490 was classified as in poverty. The threshold increased by $4,020 for each additional household member.

Greater Hartford Ranked #19 Among Best Places for Graduates in STEM Fields

If you’ve graduated college with a solid background and degree in hand in one of the in-demand STEM fields (science, technology, engineering and mathematics), there are some regions in America that are better than others to pursue your career. A new comparison of metropolitan areas across the country has ranked Greater Hartford as the 19th most desirable area in the country for college graduates who studied one of the STEM fields.

Hartford-West Hartford-East Hartford finished just ahead of San Diego – Carlsbad – San Marcos, California. One slot above Hartford in the rankings was Columbus, Ohio. Boston and Hartford were the only northeast cities to make the top 20 list.

Of all the jobs in the Hartford-West-Hartford-East-Hartford metropolitan area — which covers Hartford, Tolland and Middlesex counties — 6.6 percent were in STEM fields. That fact alone accounted for 50 percent of the total score Nerd Wallet assigned to the metro area, Hartford Business Journal reported. It also accounted for the area's $81,932 median annual wage for STEM jobs and itstem logos median gross apartment rent of $948.

The website Nerd Wallet determined the best places for STEM graduates by analyzing the following factors in the 75 largest U.S. metropolitan areas:

  • Income levels for STEM jobs: They looked at the annual mean wage for STEM occupations in each metro area, and factored in median gross rent as a cost of living metric to see how far the average income goes in each place.
  • Size of STEM industries: They included STEM occupations as a percentage of all jobs in a city to measure the robustness of the STEM industries and gauge availability of STEM jobs.

According to data from the Bureau of Labor Statistics, the annual mean wage for a STEM job is $79,395 — nearly 71% higher than the national annual average wage across all occupations and industries.  The top 10:

  1. San Jose – Sunnyvale – Santa Clara, California
  2. Seattle – Bellevue – Everett, Washington
  3. Washington, DC – Arlington, VA – Alexandria
  4. Houston – Sugar Land – Baytown
  5. San Francisco – San Mateo – Redwood City, California
  6. Austin – Round Rock – San Marcos, Texas
  7. Boston – Cambridge – Quincy, Massachusetts
  8. Raleigh – Cary, North Carolina
  9. Denver – Aurora – Broomfield, Colorado
  10. Dayton, Ohio

The analysis used U.S. Bureau of Labor Statistics data from May 2013 and rent data from the 2012 U.S. Census.

The region's focus on the STEM fields begins well before college graduation.  One recent example:  earlier this year, the CREC Academy of Aerospace and Engineering was ranked 15th in the nation and first in Connecticut in U.S. News & World Report's latest "Best High Schools" edition. The Connecticut International Baccalaureate Academy in East Hartford ranked 31st nationally and second in the state.

Nearly Two-Thirds of Americans Would Consider Coworking, If Only They Knew What It Was

Good news, bad news. That might be the best way to describe the results of a national survey by CoworkCT into public awareness of, and interest in, coworking. Nearly two-thirds of Americans (63%) said they would consider working in a collaborative work environment once they understood the concept (good news), but 60% said they had never heard of it (bad news). CoworkCT, a network of coworking communities whose members include small businesses, entrepreneurs, freelancers, and contractors who share space, resources, and ideas, conducted the national survey to better understand how familiar Americans are with coworking. Answer:  they're not.

A new website will be launched next week at www.coworkct.org, with more information about coworking in Connecticut.  Additional data, links and information will be added to the current test site, to assist in explaining the coworking concept to what the study suggests will be a receptive public.

According to the survey, the demographic groups most inclined to consider a coworking environment were 18 to 34 year olds (75%) and residents of the Northeast (72%). That is certainly true of ConneCoworkCT-Purple1-513x515cticut, which has seen growth in the concept in recent years, with coworking locations established in communities across the state, including Danbury Hackerspace, reSET (Hartford), the Grove (New Haven), B-Hive (Bridgeport), Stamford Innovation Center and Axis 901 (Manchester).  Each will have a presence on the news website, reflecting their growing community presence.

CoworkCT reports that the average cost of a coworking membership is $200 per month and the average cost of a private desk or office in a coworking facility is $350. The data from the survey showed that on average, people think the monthly cost of an individual coworking membership is $1,300.  Not even close.

Other key findings from the research include:

  • Nearly 40% of respondents said that collaboration with other professionals (not necessarily within their organization) was the most attractive feature of a coworking space, followed by 19% of respondents who chose affordability
  • Forty percent of respondents thought small businesses with fewer than 10 employees were best-suited for coworking, followed by 21% of respondents who said entrepreneurs wctnext-logo-finalould be the best fit
  • More than half of respondents (55%) said they thought it costs more than $500 per person per month for an individual space in a coworking environment

CoworkCT is a network of Connecticut coworking communities where members share space, resources, and ideas. The goal of the network is to educate the public on the benefits of coworking and increase general awareness for the collaborative work style.

CoworkCT is coordinated by CT Next, Connecticut’s innovation ecosystem supporting the success of companies and entrepreneurs by providing guidance, resources and networks to accelerate their growth. The statewide network “connects promising companies to mentors, collaborative work spaces, universities, vendors, suppliers and other like-minded entrepreneurs to help facilitate the growth and scalability of their business.”  CT Next is a program of CT Innovations, the leading source of financing and ongoing support for Connecticut’s innovative, growing companies.

Among the other coworking sites in Connecticut that are expected to be invited to the new CoworkCT website are SoNo Spaces in South Norwalk, Group 88 in Simsbury , and The Soundview, Colodesk and Comradity, all in Stamford.

The national data in the report was based on an ORC International telephone CARVAN® Omnibus survey conducted among a sample of 1,006 adults 18 and older living in the continental U.S. Interviews were completed from April 24 to 27, 2014. coworking

Connecticut Agriculture Growth Gains National Attention

Connecticut may be the third smallest state in the nation, but it has a large agricultural presence - which led to the state being featured recently by the U.S. Department of Agriculture (USDA) on the federal agency’s website. Bucking the national trend, USDA reports, Connecticut farming has been growing for the past two decades. The state - based on the 2012 Census of Agriculture - has nearly 6,000 farms, which is a remarkable 60 percent increase from the 3,754 farms in Connecticut in 1982. At the same time, the state’s farmland acreage remained relatively stable, which means that the size of an average farm has been trending down, to an average of 73 acres.farming in CT

More than 900 Connecticut farms harvested vegetables for sale in 2012, with bell peppers being the most popular crop. To meet the needs of East Coast homeowners and landscapers, in 2012, 880 of Connecticut's nurseries, greenhouses, floriculture and sod farms grew and sold almost $253 million worth of those crops.

In addition, Connecticut’s coastal area has hosted shellfish farms since Colonial times. In 2012, the state’s aquaculture industry sold nearly $20 million worth of seafood, primarily shellfish from Long Island Sound. There is livestock as well, USDA notes, with 774 farms in Connecticut raising cattle and calves. Most of the sales on the livestock end come from milk, however. In 2012, the state’s farms sold nearly $70 million worth of milk from cows.

Contrary to history and stereotype, in 2012 more than 25 percent of all Connecticut farms were operated by women as principal operators. That is an incremental increase from 23 percent in 2007. Overall, the 2012 Census counted more than 3,700 women farmers in the state.

Connecticut farmers have also stepped up their efforts to get agricultural products into consumers’ hands, the USDA report indicated. With the growing “buy local” movement, nearly a quarter of Connecticut farms market human food products directly to consumers. About 10 percent of the farms in the state now market their products directly to retail outlets such as restaurants, stores, and institutions; and at the same time, 218 of our farms participate in community-supported agriculture programs allowing local residents to partake in their harvest.ct_grown_local_flavor

Although the USDA did not specifically mention the longstanding “Connecticut Grows” campaign from the state’s Department of Agriculture, it has served as a lynchpin for intensified efforts using technology.

The CT Grown Program was developed in 1986, during the administration of former Gov. William A. O’Neill, when the now-familiar green and blue logo was created to identify agricultural products grown in the state. During nearly three decades, the CT Grown Program has blossomed into a multifaceted campaign that promotes these products through a diverse array of avenues in local, regional, national and international markets.

It now features CT Grown producer listings and brochures, connections to farmers markets, the CT Seafood Council, CT Farm Wine Development Council, CT Food Policy Council, CT Milk Promotions Board, and other related councils and commissions.

More recently, the website www.buyctgrown.com was established as “a place to connect people who are ready to discover CT Grown foods and experience Connecticut agriculture.” buyCTgrown is a program of the non-profit CitySeed and receives support from our partners including UConn Extension, CT Farm Bureau, CT NOFA, and the CT Department of Agriculture. Logo_Pledge10_Partner

The website’s “CT 10% Campaign” asks people to spend 10 percent of their existing food and gardening dollars on locally grown goods.” Individuals and businesses can sign up to “take the pledge” on the website, and will receive ongoing information about locally grown products.

Nonprofit Governance Has Room for Improvement, Survey Finds

The 4.9% rise in charitable giving in 2013 is the largest gain since 2008, and comes at a time when greater attention is being paid by philanthropic donors and regulators to the governance practices of non-profit organizations. The CohnReznick 2014 Not-for-Profit Governance Survey reflects some progress as well as areas for improvement by nonprofits on a range of governance measures. The members of CohnReznick’s Not-for-Profit and Education Practice specialize in working closely with the boards and management of not-for-profit organizations to assist them in developing and implementing best-practices for their critical financial and operational functions. “Now more than ever,” the report indicates, “our clients are asking us questions about policies and procedures relating to audit committee governance and risk detection and minimization strategies.”

Key findings in the national survey included:

  • 58% of respondent organizations stated that they have an audit committee that is separate and apart from their finance topics coveredcommittee
  • 54% of respondents stated that their audit committees have between four and six members
  • 27% of the respondents stated that their organizations have a whistleblower hotline
  • 68% of respondents stated that their annual board meetings contain an educational component
  • 82% of responding organizations have a whistleblower policy in place.
  • 42%, stated that they do not have an audit committee that’s separate and apart from a finance committee.

When identifying conflicts of interest, the survey found that 77% of the respondent organizations have an annual disclosure statement in place.

The survey also found that 68% of the nonprofit organizations include an educational component to their board meetings and place a strong emphasis on financial, strategic planning, and governance. Other areas receiving attention at board meetings include industry trends, technology, risk management, regulation and tax issues.

According report coverto the National Center for Charitable Statistics (NCCS), there are more than1.4 million not-for-profit organizations registered in the U.S. This includes almost one million public charities, over 96,000 private foundations, and more than360,000 other types of not-for-profit organizations, including chambers of commerce, fraternal organizations, and civic leagues.

The survey found that less than 50 percent of boards noted that they are “very confident” in their organization’s governance practices. With the addition of new laws and regulations surrounding the industry, “this lack of confidence can give rise to much larger issues hesitation,” the report concluded. According to Forbes, charitable giving rose 4.9% in 2013, the largest increase in five years. This rise indicates “a renewed attention for not-for-profit organizations, which can also lead to renewed scrutiny.”

Knowledge of the intricacies of regulations and the effects that it will have on the governance practices of not-for-profit organizations is crucial to the success of affected organizations, the reported pointed out.

With origins dating back to 1919, CohnReznick LLP is the 10th largest accounting, tax, and advisory firm in the United States. Headquartered in New York City, CohnReznick serves its clients with more than 280 partners, 2,500 employees, and 26 offices – including Farmington, Glastonbury and New London in Connecticut, with plans for newly consolidated offices in downtown Hartford.

The consolidation of the two suburban offices in Glastonbury and Farmington is expected to relocate nearly 200 employees into Hartford later this year. The company plans to lease 50,000 square feet on the top two floors of the Metro Center building on Church Street.

Report Calls for Transition to Livable Communities Across Connecticut

In Connecticut, more than one-third of the population is over the age of 50, and that proportion continues to increase. Connecticut’s Legislative Commission on Aging has issued “Connecticut for Lireport covervable Communities,” a new report to the state legislature which outlines more than 50 recommendations for communities looking to enhance livability. The Commission has also launched a website which includes a list of communities that are responding to the call for more livable communities, and suggests a wide range of actions that communities can take.

Connecticut is undergoing a permanent and historic transformation in its demographics, the report points out. Between 2010 and 2040, Connecticut’s population of people age 65 and older is projected to grow by 57 pelivability chartrcent, with less than 2 percent growth for people age 20 to 64 during the same period.

Livable communities are vibrant, inter-generational places that are easy to get around, according to the report. “They include affordable, appropriate housing options, supportive community features and services, and adequate mobility options. They foster independence, engage residents in civic and social life, and allow people to age in place. Done well, they benefit community residents across the lifespan.”

The 50-page report indicates that residents born in Connecticut today can expect to live to be 80.8 years old - the third highest life expectancy in the nation. A lengthy series of recommendations are highlighted in seven different areas: community engagement, health and well-being, housing, planning and zoning, safety and preparedness, social and support services, and transportation.

The recommendations include promoting opportunities for intergenerational collaboration, promoting in-home programs that improve health outcomes, creating a balanced transportation system that connects residents with health care services, and adopting policies that encourage incorporation of accessible housing features into new construction. The recommendations also include a call for municipal plans of conservation and development that include planning for older adults and individuals with disabilities to remain in their homes and communities, and building compact, mixed-use development “to encourage walking and eyes on the street.”

Creating livability requires “robust partnerships, long-range planning and sustained commitment.” To support those efforts the Legislative Commission on Aging plans to be:

  • Providing educational opportunities on livable communities for community leaders and other partners in Connecticut;
  • Creating partnerships to support the multi-faceted, multi-disciplinary endeavor of creating livable communities;
  • Supporting, inspiring and incentivizing communities to enhance livability; and developing policies to support aging in place

To help communities implement the recommendations over time, the Commission plans to:

  • Recognize localities that have implemented livable communities initiatives, pursuant to Public Act 14-73 (which established the livable communities initiative)
  • Expand partnerships across multiple sectors to advance livability, logo
  • Continue to convene municipal leaders, legislators and other thought leaders for statewide and regional forums on creating livability;
  • Continue to identify funding opportunities for municipal leaders, seeking to implement or sustain livable communities initiatives;
  • Work with partners to conduct asset mapping across all Connecticut communities, with the goal of helping each community understand its facilitators and barriers to developing livable communities;
  • Continue to research models in other states, nationally and internationally;
  • Work with the Connecticut General Assembly to identify and advance policy solutions that incentivize and inspire the creation of livable communities;
  • Provide technical assistance to Connecticut communities seeking to enhance or promote livability; and
  • Create town-specific data profiles to enable towns to enhance livability in a targeted and strategic fashion.

Among the communities listed on the new website as having best practices in place in parts of their towns or cities are Branford, Guilford, Madison, Bridgeport, Danbury, Darien, Enfield, Hartford, Middletown, New Haven, New Canaan, Norwalk, Seymour, and Torrington.  The Commission plans to proceed with "asset mapping across all Connecticut communities" and "continue to identify innovations, ideas, and best practices for implementing livability in the state. "

Serious Health Issues Faced by State's Asian Pacific American Residents, New Study Reveals

Stereotypes about a thriving and problem-free Asian Pacific population in Connecticut are just plain wrong, according to a new statewide Needs Assessment Study which reveals “high rates of physical and mental health problems” and serious concerns about access to proper food and healthcare, often exacerbated by communication breakdowns  and language barriers." The 21-page study, by the Connecticut Asian Pacific American Affairs Commission, is said to be the first of its kind in Connecticut.  The 2010 U.S. Census reported APA’s as one of the fastest growing minority populations, growing from 2.4 percent of Connecticut’s population in 2000 to 4.4 percent by 2010. The Census projects a steady increase of the APA population through 2050.

The Needs Assessment was developed in collaboration with three community-based organizations: the Khmer Health Advocates, Lao Association of Connecticut aapacc_logo5-300x151nd Connecticut Coalition of Mutual Assistance Associations. The project was also supported by the Asian American Studies Institute at UConn, the UConn School of Pharmacy and the UConn School of Social Work. It focused on housing, education, language access, employment, access to public resources, and medical and mental health.

More than 300 Southeast Asian Connecticut residents – all over age 18 - participated in the study, include just over one hundred from each of three ethnic groups: Cambodian, Lao, and Vietnamese. The study found clear distinctions between the populations in Connecticut, and researchers stressed that viewing the Asian Pacific American (APA) population in the state as one block of people does a disservice to them, and does not adequately respond to their needs.

Food Insecurity

Food insecurity was a “prominent problem,” according to the report. “Close to half reported that they often or sometimes couldn’t afford to eat balanced meals and 43 percent indicated that their food supplies ran out The survey also reviewed “several measures of food insecurity” and found “significant association” between the ethnic groups and “finding it too expensive to have a balanced meal often or sometimes,” as well as “going hungry for lack of sufficient money for food.”

The report also indicated that “all of the ethnic groups reported concern that some members of their community were socially isolated. In particular, they reported that those age 50 and older were most at risk for isolation.”

capitolHealthcare Concerns

Regarding healthcare, “nearly half experienced at least some difficulty in getting the healthcare they believed they needed,” the report indicated. In addition, “more than half of all participants reported experiencing a language barrier with their physician, and for those that needed an interpreter, 59 percent indicated that a professional interpreter was never or rarely available for healthcare visits.”

In regards to Southeast Asian Refugees, the report noted "chronic mental and physical health conditions follwoing a history of severe trauma," adding that "it is vital that primary care physicians and others treating these individuals screen for a wide range of physical health conditions as well as PTSD and depression."  At a State Capitol news conference releasing the report, Dr. Megan Berthold, Assistant Professor in the UConn School of Social Work, said that there is an "urgent need" to address these concerns, adding that the lack of communication can be "dangerous" and could "lead to misdiagnosis."

Among those who received prescriptions, nearly one-third said they did not fill it due to the expense, and among all surveyed, 17 percent “did not see a doctor when they felt they need to” during the past year due to the high cost.

Among the ethnic differences, a greater number of Vietnamese are smokers, Cambodians were “significantly more likely to be diagnosed with PTSD and depression,” and the Lao community indicating the least frequency of language barriers with physicians. Overall, however, the report indicated that “these communities continue to be underserved due to the limited to no resources available to focus on the cultural and linguistic needs of their communities.”

Numerous Recommendations

Included in the recommendations, the study report states that “service providers, state agencies and stakeholders are encouraged to partner with APA communities” in multiple ways, and calls for additional research that “can advance the needs of the APA population.” The series of 14 recommendations include greater training anreport
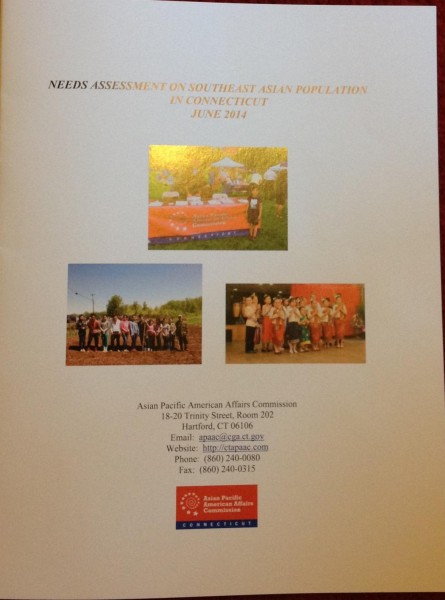
d education, promoting preventative care, actively recruiting APA members in various professional fields, creating diversity in the workforce, translating materials into the most common APA languages, and raising awareness among the APA population regarding their rights.

It is hoped that Needs Assessment studies can focus on other APA ethnic groups, such as the Indian and Chinese communities, in future years. The APA population in Connecticut includes approximately 50 ethnic groups, sharing some similarities and having great diversity. As the initial study demonstrated, specific needs may vary – an important fact for policy makers and those working with this fast-growing aspect of the state’s population.

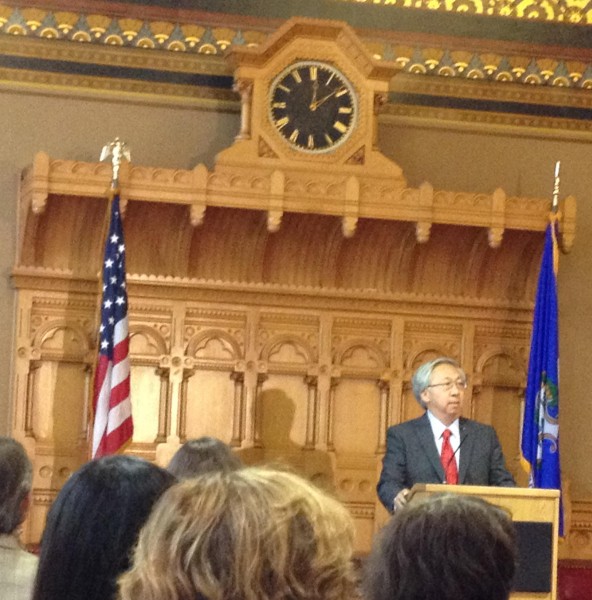
Among those commenting on the report during the news conference were Secretary of the State Denise Merrill, who was instrumental in the establishment of the Commission when she was House Majority Leader in the legislature, Marie Spivey, Chair of the State Commission on Health Equity, Tanya Hughes, Executive Director of the state's Commission on Human Rights and Opportunities, and Dr. William Howe, Chair of the Asian Pacific American Affairs Commission (see photo, at left). Theanvy Kuoch, Executive Directo of Khmer Health Advocates, noted that "working together we can improve outcomes for our community members while engaging them in their own care.  We have evidence that this approach also saves health care dollars."

The Asian Pacific American Affairs Commission was created in 2008 by an act of the Connecticut legislature.  The 21 member bipartisan commission oversees matters concerning hte Asian Pacific American population in Connecticut, and makes recommendations to the General Assembly and the Governor on the health, safety, education ,economic self-sufficiency and efforts to remain free of discrimination within the APA population in the state.

New Haven is Number One - Best Foodie City in America

New Haven is the number one “foodie city” in America, according to a new analysis published on the website Livability.com The site reports that “New Haven residents spend more on eating out than most Americans. Many frequent neighborhood bistros and cafes that get their ingredients from nearby farms. The city's farmers markets make it easy for home cooks to prepare fresh meals.”foodie

The Elm City outpaced cities including Boston in New York in the newly announced top 10 list, with New Haven praised for supporting local farmers, showcasing regional cuisine and providing residents with “bountiful opportunities to discover new flavors, textures, cooking techniques and healthy foods.”

To determine the top 10 “foodie” cities, editors analyzed data from Esri about how frequently families eat at locally owned restaurants and how much the average resident spends eating out. They also examined the accessibility residents of each city have to healthy foods like fruits, vegetables and quality meat with data from the Robert Wood Johnson Foundation.pepes

Also taken into account were cities with established farmers markets and restaurants that use locally grown ingredients, as well as critically acclaimed restaurants, successful chefs and winners of James Beard Foundation Awards.

“There’s a real foodie renaissance going on in U.S. cities,” says Livability.com Editor Matt Carmichael. “You’re seeing that coast to coast, but these cities really stand out as great places to live and eat.”

The site’s write-up of New Haven’s foodie choices noted that “restaurants cover the gamut of food genres. From Louis' Lunch to Frank Pepe Pizzeria Napoletana to Claire's Corner Copia, it’s no wonder New Haven residents spend more on eating out than most Americans.” Also among the New Haven restaurants mentioned in the profile of New Haven’s eateries are Sandra’s Next Generaclaire'stion, Mamoun’s, Prime 16, Skappo, Bella’s Care and Da Legna.

The 2014 list is quite different from a year ago. In 2013, the top city was Decatur, Georgia. Also reaching the top ten were Hoboken, New Jersey; Bloomington, Indiana; Berkeley, California; Madison, Wisconsin; Lafayette, Louisiana; Chapel Hill, North Carolina; Sante Fe, New Mexico; Alexandria, Virginia; and Burlington, Vermont. The only cities to reach the top 10 in both years were Berkeley and Burlington.  The 2014 list is the third annual developed by Livability.com.

Top 10 Foodie Cities, 2014louis lunch 1

  1. New Haven, CT
  2. Scottsdale, AZ
  3. Boston, MA
  4. Asheville, NC
  5. Traverse City, MI
  6. Berkeley, CA
  7. Boulder, CO
  8. Burlington, VT
  9. Omaha, NE
  10. Washington, D.C.


Aging Bridges, Considerable Disrepair Are Significant Challenge in CT, Nationwide

It was in 1983 that three people died in Connecticut when a section of the Mianus River Bridge on Interstate-95 collapsed into the water below, and unsuspecting drivers drove off the end of the road in the middle of the Greenwich night. That tragedy launched a multi-million dollar infrastructure investment program in Connecticut, but now, three decades later, the age and condition of the state’s bridges is front and center again, as a poorly functioning, 118-year-old railroad bridge has disrupted commuter service on the nation’s busiest rail corridor by repeatedly refusing to close. Mianus River Bridge I95

The extent of the nation’s bridge-related challenge is daunting, and yet represents only a portion of the overall infrastructure needs. Less than a year ago, a study released by the American Society of Civil Engineers determined that:

  • over two hundred million trips are taken daily across deficient bridges in the nation’s 102 largest metropolitan regions
  • one in nine of the nation’s bridges are rated as structurally deficient,
  • the average age of the nation’s 607,380 bridges is currently 42 years.

The report also pointed out that “it is of growing concern that the bridges in our nation’s metropolitan areas, which are an indispensable link for both millions of commuters and freight on a daily basis, are decaying more rapidly than our rural bridges.”

bridgesCTOnce every four years, America’s civil engineers provide a comprehensive assessment of the nation’s major infrastructure categories in ASCE’s Report Card for America’s Infrastructure (Report Card). The most recent report was issued in 2013.

Connecticut, according to the data, has 406 of the state’s 4,208 bridges classified as structurally deficient and another 1,070 are considered to be functionally obsolete. The report also noted that Connecticut has 21,407 public road miles, and 73 percent of the state’s major roads are considered to be in poor or mediocre condition.

By county, the 406 structurally deficient bridges were: 106 in Fairfield County, 71 in Hartford County, 58 in New Haven County, 45 in New London County and Litchfield County, 27 in Middlesex County, 24 in Windham County and 14 in Tolland County. In addition, the report indicated that Connecticut had 1,023 functionally obsolete bridges in the state.

Structurally deficient bridges “require significant maintenance, rehabilitation, or replacement. These bridges, according to the report, “must be inspected at least every year since critical load-carrying elements were found to be in poor condition due to deterioration or damage.” Functionally obsolete bridges are those that “no longer meet the current standards that are used today. Examples are narrow lanes or low load-carrying capacity.” fairfield bridges

The Federal Highway Administration (FHWA) estimates that to eliminate the nation’s bridge deficient backlog by 2028, an investment of $20.5 billion annually would be needed, according to the report, while only $12.8 billion is being spent currently. The report stated that “the challenge for federal, state, and local governments is to increase bridge investments by $8 billion annually to address the identified $76 billion in needs for deficient bridges across the United States.”

The report indicated that 22 states have a higher percentage of structurally deficient bridges than the national average, while five states have more than 20% of their bridges defined as structurally deficient. Pennsylvania tops the list with 24.4%, while Iowa and Oklahoma are not far behind, each having just over 21% of their bridges classified as structurally deficient.

Overall, the nation’s grade for the condition of its bridges was C+, which was described as “mediocre” and in need of attention. “Some elements exhibit significant deficiencies in conditions and functionality, with increasing vulnerability to risk.” The 32-member Advisory Committee did not include any engineers from Connecticut, but did include two from Massachusetts and one from Maine, among the New England states.

Time magazine reported this week that the I-95 bridge over Delaware’s Christina River was quickly closed to all traffic on May 29, after “an engineer who happened to be working nearby noticed two of the span’s support pillars tilting.“ Officials hope to have the structure stabilized and reopened by Labor Day. The bridge had routinely handled about 90,000 vehicles per day.

The I-35W bridge over the Mississippi in Minneapolis collapsed during rush hour on August 1, 2007, plunging dozens of cars and their occupants into the river, killing 13 people and injuring 145. The bridge was Minnesota's fifth busiest, carrying 140,000 vehicles daily.asce-logo

The American Society of Civil Engineers, founded in 1852, is the country’s oldest national civil engineering organization. It represents more than 140,000 civil engineers in private practice, government, industry, and academia who are dedicated to advancing the science and profession of civil engineering. The first Report Card for America’s Infrastructure was issued in 1988.