Bridgeport, Stamford, New Haven, Hartford, New Britain Among Most Culturally Diverse Cities in USA

Five Connecticut cities are among the nation’s most culturally diverse, according to a new analysis.  Bridgeport is the 15th most culturally diverse city in the U.S., according to the analysis by the financial website WalletHub, which also ranked Stamford at number 22.   New Haven, Hartford and New Britain were back-to-back-to-back, ranking  at number 30, 31 and 32 on the list of more than 500 cities across the country. Bridgeport’s cultural diversity score was 86.34, and the city ranked 28th in ethno-racial diversity, 17th in linguistic diversity and at number 150 in birthplace diversity.  Stamford’s cultural diversity score was 84.29, and the city ranked 63th in ethno-racial diversity, 20th in linguistic diversity and at number 103 in birthplace diversity.

New Haven’s scores and rankings were similar, with a 83.02 cultural diversity score, and ranking at number 76 in linguistic diversity and number 132 in birthplace diversity.  New Haven was the only Connecticut city to rank in the top 10 in any category, finishing ranked at number 10 in ethno-racial diversity.

When the analysis broke metropolitan areas down by size, among medium sized cities Bridgeport, Stamford, New Haven and Hartford all ranked in the top 15 most culturally diverse.  Waterbury ranked at number 19.  Among small cities, New Britain ranked 8th, Danbury 10th, Norwalk 15th and West Hartford 76th.  Large cities in the analysis were those with more than 300,000 people; midsize cities with 100,000 to 300,000 people, and small cities with fewer than 100,000 people.

The most culturally diverse city in the U.S. is Jersey City, New Jersey, with a score of 95.88.  New York City ranked sixth; Providence was at number 12.

“The country as a whole is becoming increasingly ethnically diverse, and living in an ethically diverse city today is good exposure to the opportunities and challenges all cities will be facing sooner or later,” said Mario Luis Small, Grafstein Family Professor of Sociology at Harvard University.  “Ethnic diversity in neighborhoods is associated with a strong preponderance of businesses and local organizations that generate economic activity and sustain community.  Children exposed to ethnic and language diversity early on, develop a broader and more sophisticated understanding of the diversity of the world.”

In determining the cultural diversity scores, the three categories were weighted, with racial and ethnic diversity making up 50 percent of the score, language diversity 33 percent and U.S. region of birth diversity consisting of 17 percent of the score.  The regions were in-state, Northeast, Midwest, South, West, U.S. territories, and foreign-born.

Survey Says: Hartford Is Among Nation’s Top Up-and-Coming Cities

What do Milwaukee, Syracuse and Hartford have in common? They are all – believe it or not – the nation’s most notable “up-can-coming place to live,” according to a new national analysis of the top places to live in the U.S.

In calculating the second-annual ranking of the Best Places to Live in the U.S., which evaluates the 100 most populous metro areas in the country based on qualities that Americans care about most, U.S. News looked at affordability, employment opportunities and the overall quality of life in each place.  Hartford’s ranking jumped from number 59 a year ago to number 31 this year, among the largest leaps of any city in the nation.

The leading reason cited by the publication is the increase in jobs.

"The Hartford region has seen some strong employment growth in a number of high-productivity sectors, including professional, technical services, education and health services," said Alissa DeJonge, vice president of research at the Connecticut Economic Resource Center.

The types of job opportunities that are available in the Hartford area tend to pay well, the publication points out, “with residents earning nearly $57,000 per year on average, which is significantly more than the average American's salary of $48,320 per year. United Technologies Corp. provides employment to residents in the manufacturing and engineering sectors, and the region is home to some of the country's largest financial institutions, including Aetna Inc. and the Hartford Financial Services Group.”

"Hartford is known as the 'insurance capital' of the U.S., a title substantiated with Connecticut ranking No. 1 in the U.S. for insurance employment per capita, with many of those employers located in the Hartford region," added Susan Winkler, executive director of Connecticut Insurance and Financial Services. "Connecticut is also home to the highest concentration of actuaries – many located in the Hartford region."

The U.S. News review also notes that the region features a diverse selection of restaurants and cultural attractions. Paul Pita, CEO and executive creative director of Hartford-based digital marketing firm The Pita Group, told U.S. News "Hartford is a great place to live because residents have access to what they need: great options for housing, great educational options and a wide variety of lifestyle options for food, arts, culture, entertainment and outdoor activities."

Syracuse moved from #53 to #28, and Milwaukee climbed from #72 to #47.  The top 10 places to live in the U.S., according to the rankings, are Austin, Denver, San Jose, Washington D.C., Fayetteville, Seattle, Raleigh/Durham, Boston, Des Moines, Salt Lake City and Colorado Springs.  Portland, Maine ranked #26 and Albany ranked #30, just ahead of Hartford.  New Haven ranked #81 in the top 100.

The metro areas included in the rankings were evaluated by U.S. News using data from sources including the United States Census Bureau, the Federal Bureau of Investigation, the Department of Labor and U.S. News' own internal resources. This data was categorized into five indexes – Job Market (including salary and unemployment rates), Value Index (including cost of living), Quality of Life Index (including education, crime, commuting, and health care), Desirability Index, and Net Migration - and then evaluated using a methodology determined by Americans' preferences. The percent weighting for each index was determined by the answers to a public survey in which people from across the country voted for what they believed was the most important thing to consider when thinking about moving, according to U.S. News.

Whalers Hartford Attendance 20 Years Ago Exceeds Islanders in Brooklyn

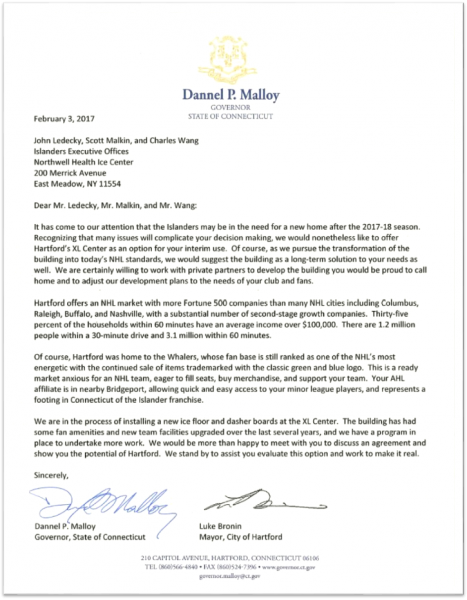
For Hartford hockey fans of the Whalers vintage, a peek at this year’s National Hockey League (NHL) attendance figures are either demoralizing or encouraging – or both.  It has been two decades since the Whalers were uprooted by ownership, replanted in North Carolina and renamed the Hurricanes, and two weeks since Gov. Dannel Malloy and Hartford Mayor Luke Bronin took their first shot at the now Brooklyn-based New York Islanders. Lowest attendance in the NHL this year belongs to the Carolina Hurricanes, at 12,025 through 24 home games, followed at the bottom of the league by the Islanders, averaging 12,829 through 32 home games, as of this week.

Last year, the 2015-16 season, the Hurricanes averaged 12,203 for their 41 home games, last in the league, while the Islanders were third lowest in the NHL at 13,626.  Both are lower than the Whalers average attendance in their final season in Hartford, nearly two decades ago.

In comparison, the top teams in the league this year for home attendance are the Chicago Black Hawks, averaging 21,669 and Montreal Canadians, seeing 21,288 per game thus far this year.

In their final season on Long Island at the Nassau Coliseum in 2015-16, the Islanders average home attendance was 15,189, an increase from the immediate previous seasons.  The Carolina Hurricanes had the second lowest attendance in the league that year, at 12,594.  During the 2012-13 season, the Islanders attendance was the lowest in the 30-team league, at 13,306.

With more than 1,000 obstructed seats in the Barclay Center arena that the Islanders share with the New York Nets in Brooklyn, rumors have circulated since last year of a possible move to a new arena in Queens built for hockey, unlike the Islanders current home, first and foremost a basketball arena.  There has been local opposition to that possibility.  Recent published reports have also indicated that the Barclay Center and Islanders could part company after the 2018-19 season or a year earlier if the team decides to relocate.

With no official word one way or the other, Connecticut officials are taking their shot, with a possible assist from a $250 million makeover of the XL Center, former home of the Whalers.  That proposal must be approved by the state legislature, a tall order at a time when the state budget deficit is approaching $2 billion.

In the Whalers’ final season in Hartford, 1996-97, attendance at the Hartford Civic Center had grown to 87 percent of capacity, with an average attendance of 13,680 per game.  Published reports suggest that the average attendance was, in reality, higher than 14,000 per game by 1996-97, but Whalers ownership did not count the skyboxes and coliseum club seating because the revenue streams went to the state, rather than the team.  Attendance increased for four consecutive years before management moved the team from Hartford. (To 10,407 in 1993-94, 11,835 in 1994-95, 11,983 in 1995-96 and 13,680 in 1996-97.)

During the team’s tenure in Hartford, average attendance exceeded 14,000 twice – in 1987-88 and 1986-87, when the team ranked 13th in the league in attendance in both seasons.

In recent years, the Islanders have been at or near the bottom of the league in home attendance:

  • 2015-16       28th
  • 2014-15      25th
  • 2013-14      26th
  • 2012-13      30th
  • 2011-12      29th
  • 2010-11      30th
  • 2009-10      29th

Whalers merchandise continues to sell well, despite the team not having played a single game in this century.  Whalers merchandise was Reebok's top selling non-current NHL team, according to published reports in 2015. While the company has expanded its lineup to include Whalers logos from different eras, the Hartford Business Journal reported, gear featuring the team's original logo remained the most popular and continues to be offered on the NHL Official Shop website, on multiple websites and in retail locations in the U.S. and Canada.

The Connecticut officials said “this is a ready market anxious for an NHL team, eager to fill seats, buy merchandise, and support your team,” reminding Islanders officials that ““Your AHL affiliate is in nearby Bridgeport, allowing quick and easy access to your minor-league players, and represents a footing in Connecticut of the Islander franchise.”

The NHL has given no indication that it will approve a move out of the New York market, according to NBC Sports, although Commissioner Gary Bettman has said that the teams owners “are reviewing the situation and looking very seriously at what their options are.”

The only statement released by Islanders ownership after receiving the letter last week from Malloy and Bronin said the team does “look forward to another great year of New York Islanders hockey at Barclays Center next season.”  No word on what might, or might not, occur after that.

Norwalk, Stamford Gain New Businesses, Taking From Each Other

Octagon Inc., a sports and entertainment marketing and talent management agency, is relocating its headquarters to the Shippan Landing complex in Stamford. The company, which is moving from Norwalk, has signed an 11-year lease to occupy 57,009 square feet across the entire third floor and a section of the second floor of the property at 290 Harbor Drive along the Stamford waterfront. The move apparently comes without state financial incentives, and comes months after another corporate citizen made the reverse move – from Stamford to Norwalk – with a boost from state incentives.  Less than 15 miles and 15 minutes apart, two of Fairfield County’s leading cities are experiencing the corporate version of “Trading Places.”

Crius Energy, through its wholly owned subsidiary Regional Energy Holdings, announced plans last year to move its headquarters from Stamford to Norwalk, placing 200 jobs in the city and committing to add 225 more over the next four years, according to an announcement in May from the Governor’s Office.

Officials said the company – launched in Connecticut – has become one of the largest independent energy retailers in the United States, supplying electricity, natural gas and solar energy products to more than 900,000 customers across 19 states and the District of Columbia, including 100,000 in Connecticut. According to officials, Crius also has operations in Florida, Texas and Australia.  They had outgrown their Stamford facility, which led to plans for a $29 million project in Norwalk, to include the renovation of 48,000 square feet of an existing building. 

To encourage the move, the state Department of Economic and Community Development (DECD) said it would provide a 10-year, $8 million low-interest loan to support the project, funding that can be used for fixtures and equipment and leasehold improvements. Crius is also eligible for up to $2 million in tax credits through the Urban and Industrial Sites Reinvestment Tax Credit Program, as well as a $100,000 grant to train employees, according to state officials.

The Crius Energy website points out that “Although based in Connecticut, many members of our leadership team have relocated great distances to become a part of Crius Energy. Together, they bring more than a century of combined industry and functional expertise as well as a deep-rooted passion for transforming the retail energy sector.”

It was a year and a half ago, in May 2015, that the first lease signing was announced for the then newly-renovated five story, 185,000 s/f office building within the 17-acre Shippan Landing waterfront office park in Stamford. That tenant was Stamford-based Workpoint, a provider of co-working environments geared to the needs of media firms along with independents and professionals.

Published reports indicated that since being acquired in 2012 by George Comfort & Sons in a partnership venture with Angelo Gordon & Company, the six-building, 758,000 s/f office park, formerly known as Harbor Plaza, saw an extensive repositioning and modernization program, which was then nearing completion. Workpoint leased a total of 15,173 s/f, including a 1,000 s/f multicamera studio with green screen, control room, and editing facilities on the building’s second floor, according to published reports at the time.

“Shippan Landing continues to be the preferred destination for some of the nation’s top creative companies and we are pleased to welcome Octagon to our tenant roster,” said Peter S. Duncan, president and CEO of George Comfort & Sons.  Among Octagon’s many clients are household names from the sports world - Stephen Curry of the Golden State Warriors, members of the World Series champion Chicago Cubs and other major league players, current and retired, and Olympic gymnast Simone Biles.

Shippan Point offers what the company describes as “truly is the best business location in the Stamford area,” with “spectacular grounds and magical stretching views.”

Back in 2013, the state Bond Commission approved $1 million in borrowing to help an emergency home repair company move its headquarters from Stamford to Norwalk.  The bonding was aimed at assisting the HomeServe USA Corporation in relocating its headquarters as part of an agreement to create 130 jobs and maintain another 109. In addition to a $1 million grant, the company was also eligible for a $3 million, partially forgivable, loan and up to $5 million in tax credits, local media reported.  The company’s customer call center is located in Tennessee.
And last May, the State Bond Commission approved $22 million in grants and loans for the world's largest hedge fund despite what press reports described as bipartisan complaints that the wealthy company can afford the move without state incentives.  The commission voted 7-2 to award the package to Bridgewater Associates, a financial industry powerhouse operated by Greenwich billionaire Ray Dalio, one of the nation's wealthiest individuals.

At the time, state officials indicated that the financial package helped to prevent the company from potentially relocating from Connecticut to nearby Westchester, N.Y.  The money was expected to be used to renovate and expand the firm's Westport headquarters, along with operations in Wilton and Norwalk, published reports explained. In addition to the loan, Bridgewater was said to also be eligible for two grants: $3 million for energy-efficiency upgrades and $2 million for job-training efforts.  The state apparently initially offered Bridgewater $130 million in loans and grants but the amount was scaled back after the company scrapped plans to build a new corporate complex in Stamford, south of I-95, in the face of local opposition, reports indicated.

https://youtu.be/7mfWZhlN4rE


Percentage of Unbanked, Underbanked Households Continues to Climb in CT, Now Exceeds 1 in 5 Households

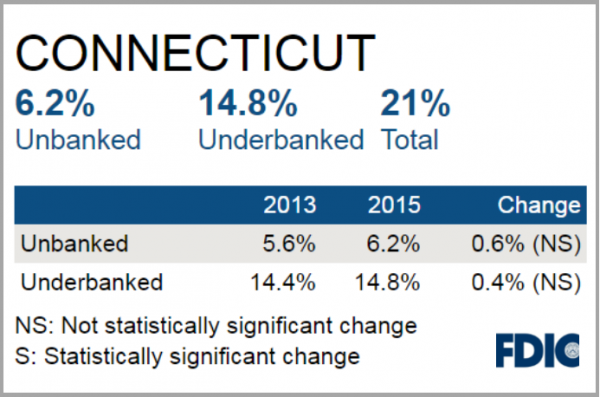
One in five Connecticut households is unbanked or underbanked, according to data compiled by the Federal Deposit Insurance Corporation, and the percentage of residents unbanked – those that do not have an account at an insured institution - has climbed in the state over the past six years. The percentage of Connecticut households considered unbanked has risen steadily, from 5.3 percent in 2009 to 6.2 percent in 2015, the most recent year for which data is available.  Connecticut ranked 21st in the nation in the percentage of unbanked households. 

Overall, the percentage of state households thatare either unbanked or underbanked increased slightly, from 20 percent to 21 percent between 2013 and 2015.  Those considered unbanked had a checking or savings account but also obtained financial products and services outside of the banking system.

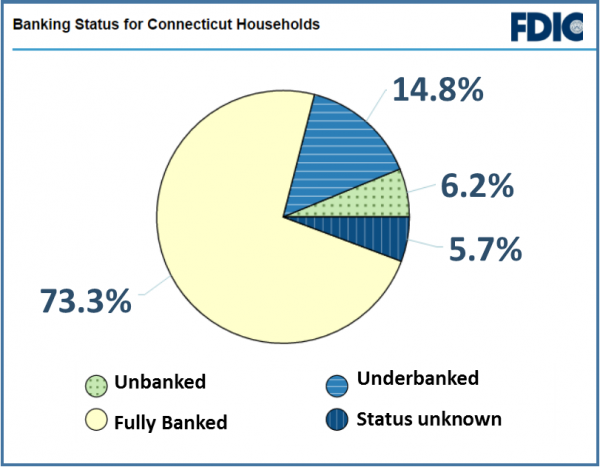
Connecticut’s percentage of unbanked and underbanked individuals is better than the national average, which is 26.9 percent.  Nationally, 68 percent are considered to be fully banked, with an account or accounts at an insured institution, compared with 73.3 percent in Connecticut.

To assess the inclusiveness of the nation’s banking system, and in partial fulfillment of a statutory responsibility, the FDIC conducts biennial surveys of households to estimate the proportion of households that do not fully participate in the banking system.  The survey provides estimates of the proportion of U.S. households that do not have an account at an insured institution, and the proportion that have an account but obtained (nonbank) alternative financial services in the past 12 months.

Estimates from the 2015 survey indicate that 7.0 percent of households in the United States were unbanked in 2015. This proportion represents approximately 9.0 million households. An additional 19.9 percent of U.S. households (24.5 million) were underbanked,

The 2015 FDIC National Survey of Unbanked and Underbanked Households presents new data and insights on the size of unbanked and underbanked markets at the national, regional, state, and large metropolitan statistical area (MSA) levels. This is the fourth installment of the report.

In the Hartford-East Hartford-West Hartford metropolitan statistical area, a slightly higher percentage of households are unbanked or underbanked – 25.6 percent.  In the New Haven-Milford MSA, that percentage is slightly lower than statewide, at 19.5 percent.  The Bridgeport-Stamford-Norwalk MSA is lower still, at 18 percent.

CT’s Local Government Workforce Shrinks 7.4% in Past Decade; 10th Largest Reduction in US from Employment Peak

Connecticut’s local municipal workforce has been shrinking for the past decade, and had been reduced 7.4 percent by 2015 when compared with the peak employment year of 2005, according to a new analysis by Governing magazine.  The drop in local government employment is the 10th largest in the country by percentage of workforce, when peak employment levels were compared with 2015 numbers. “Going on nearly a decade since the start of the recession, localities in many parts of the country have since restored public payrolls to prior levels. But some still employ far fewer workers than they did before the downturn,” Governing reported.

Governing compared each state's pre-2010 peak aggregate totals to the latest 2015 data, excluding the education sector.  In all, the magazine reported, local governments in 26 states had yet to see payroll expenditures return to prior levels when adjusted for inflation. Similarly, local public employment remains below previous highs in most states and is down 3.5 percent nationally from 2008.

The steepest declines in local government payrolls, when 2015 data was compared with the peak pre-recession year, came in Delaware (-20.5% from 2007), Michigan (-18.2% from 2003), Arizona (-17.1% from 2008), Rhode Island (-16.5% from 2003), Massachusetts (-14.4% from 2008), Nevada (-14.1% from 2009), Florida (-11.0% from 2008), Indiana (-8.8% from 2008), New Jersey (-8.3% from 2009) and Connecticut (-7.4% from 2005).

Where localities chose to make payroll cuts has varied, according to the analysis, but a number of patterns were pointed out, based on Census data.  When national employment estimates were compared with 2008 levels, non-sworn police employees sustained the single largest reduction of any major category of workers, the analysis indicated. Governing suggested the reductions were likely a result of police departments trimming civilian staff to maintain the size of police forces on the streets. Nationally, the number of police and firefighters were down 2.6 percent from 2008 while all other areas of local government, excluding education and hospitals, experienced a larger 4.5 percent decline.

At the opposite end of the spectrum, North Dakota, South Dakota, Wyoming, Montana and New Mexico recorded the biggest increases in noneducation payrolls since the recession began in 2008-2009.  Half the states showed an increase in local government payrolls, and despite the generally slow recovery across many regions of the country, U.S. local government payroll spending overall showed a slight three  percent nationwide uptick between 2014 and 2015, according to the analysis.

College Debt Continues to Climb; Connecticut Students Graduate with 3rd Highest Loan Debt in US

Nearly two-thirds of students who graduated from public and nonprofit colleges in Connecticut in 2015 had student loan debt averaging $34,773, the third highest level in the nation.  The state ranked 14th in the percentage of students graduating with debt, according to data compiled by The Institute for College Access & Success (TICAS). Student debt continues to rise for new graduates, across the country and in Connecticut.  Student debt at graduation ranged from $15,521 for Yale University graduates to $47, 715 at Sacred Heart University and $47,873 at Quinnipiac University.

At public and nonprofit colleges in 2015, seven in 10 graduating seniors (68%) had student loans. Their average debt was $30,100: up four percent compared to the Class of 2014. About one-fifth of 2015 graduates’ debt (19%) was in private (non-federal) loans, which are typically more costly and provide far fewer consumer protections and repayment options than federal student loans, the Institute pointed out.

At institutions across the country, state averages for debt at graduation in 2015 ranged from $18,850 to $36,100, and new graduates’ likelihood of having debt ranged from 41 percent to 76 percent.

In 12 states, including Connecticut, average debt was more than $30,000 – up from six states the year before. High-debt states remain concentrated in the Northeast and Midwest, with low-debt states mainly in the West. Average debt at the college level varies even more, from a low of $3,000 to a high of $53,000, and the share graduating with loans ranges from seven percent to 100 percent.
“Student debt is still rising, and the typical college graduate now leaves school with over $30,000 in loans,” said TICAS president Lauren Asher. “We need to make college more affordable and debt less burdensome for students and families.”

The states with the highest debt levels for graduating students, according to the TICAS study, are New Hampshire ($36,101); Pennsylvania ($34,798); Connecticut ($34,773); Delaware ($33,849) and Rhode Island ($32,920).  At the other end of the spectrum, students graduation from colleges in Oklahoma have the lowest average debt ($24,849), followed by Washington, Arizona, Nevada and Hawaii.


CT Seen As Hiding Bad Budget News

In an article headlined “Bad Budget News? Some States Just Bury It.” Connecticut is one of two states selected as a poster child for what a national publication describes as “hindering transparency.” The Connecticut policy that brought the unwelcome attention was put in place last year.  As Governing explains:

“Connecticut ended its practice of current services projections. That’s a boring-sounding way of talking about how much programs will cost over time, assuming there are no policy changes. It’s a baseline against which to compare any proposed cuts or increases in spending.”

Ben Barnes, Connecticut’s budget director (Secretary of the Office of Policy and Management), said last year that it didn’t make sense to project shortfalls or surpluses into the future, Governing explains. “There’s no such thing, in my view, as a deficit or a surplus in years in which there is no appropriation in place,” said Barnes, whose photo accompanies the article.

Some legislators complained that the new rules would be a blow against transparency in the budget. The change was adopted anyway, the publication noted, adding that a majority of states already choose not to publish current services projections.

“There is kind of a tendency for policymakers to focus on the immediate and not the future,” Liz McNichol of the Center on Budget and Policy Priorities, told Governing. “This reduces the outside pressure to look beyond one year.”

The publication’s report notes that Connecticut “will have to fill a shortfall of more than $1 billion in its budget this year.”

The other state highlighted in the article is Kansas, where a state task force recommended that the department stop releasing monthly budget reports after numerous reports indicated that the state had fallen short of anticipated revenues.   The Governor’s administration also “decided to kill a quarterly economic report that was also habitually filled with bad numbers.”

Governing is the nation's leading media platform covering politics, policy and management for state and local government leaders.


CT Employers Less Optimistic About Hiring in First Quarter

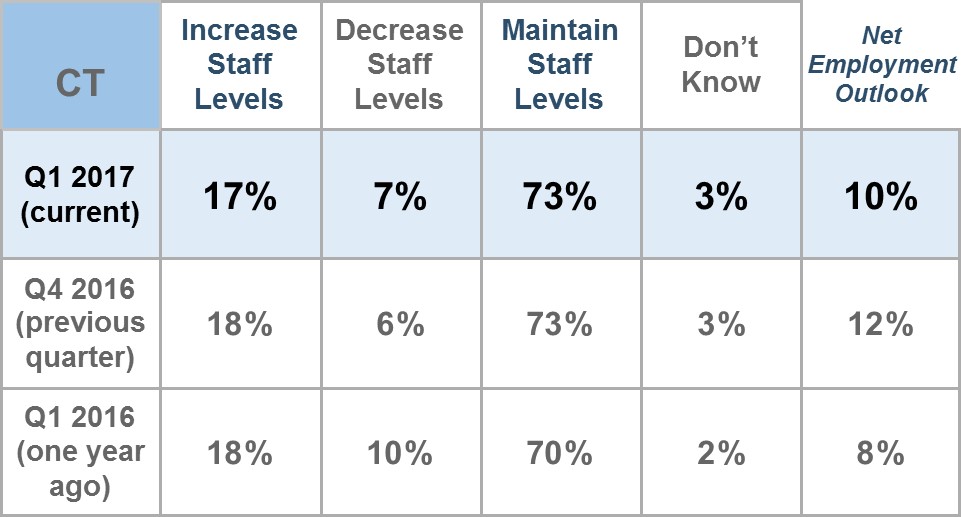
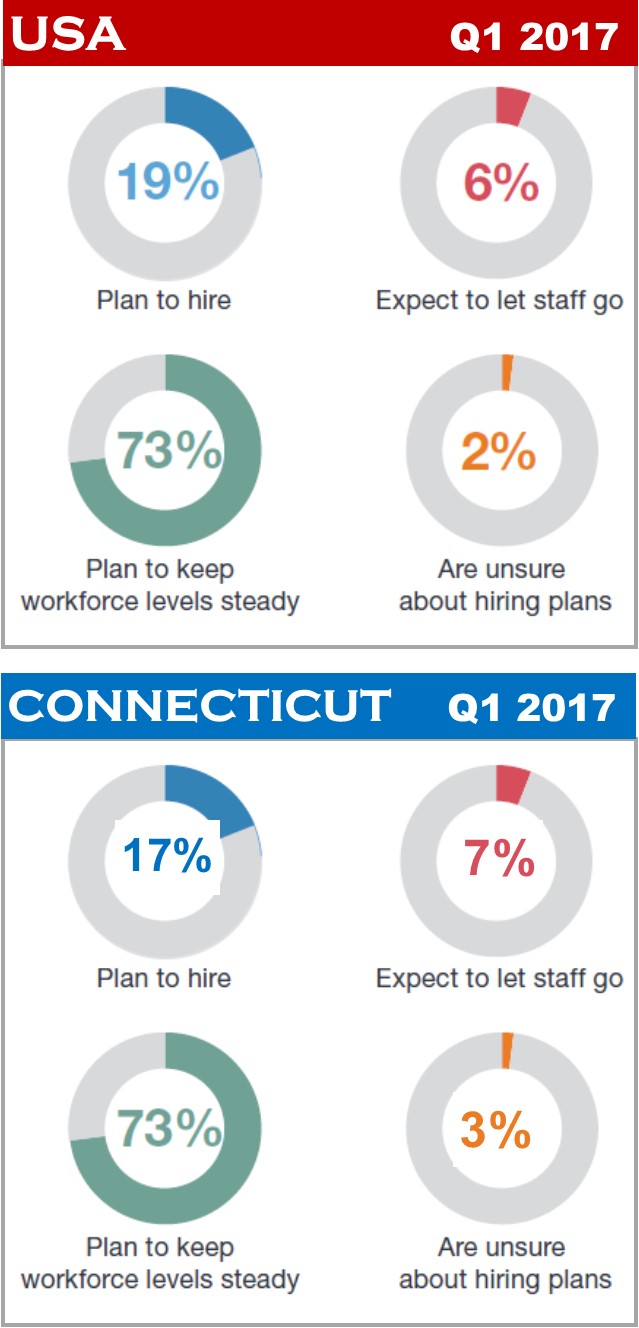
Employers nationwide are slightly more optimistic about hiring in the first quarter of 2017 than employers in Connecticut, according to the ManpowerGroup Employment Outlook Survey, although both expect to hire at a favorable pace during the first quarter of 2017. From January to March, 17 percent of Connecticut companies interviewed plan to hire more employees, while 7 percent expect to reduce their payrolls. Another 73 percent expect to maintain their current workforce levels and 3 percent are not certain of their hiring plans. This yields a Net Employment Outlook* of 10 percent.
For the coming quarter, job prospects appear best in Durable Goods Manufacturing, Nondurable Goods Manufacturing, Transportation & Utilities, Wholesale & Retail Trade, Financial Activities, Professional & Business Services, Education & Health Services, Leisure & Hospitality and Government. Employers in Construction, Information and Other Services plan to reduce staffing levels.

“Hiring intentions are weaker compared to Q4 2016 when the Net Employment Outlook was 12%,” said ManpowerGroup spokesperson Betty Gooding said about the Connecticut outlook. “The hiring pace is expected to pick up compared to one year ago when the Net Employment Outlook was 8%.” Of the more than 11,000 employers surveyed in the United States, 19 percent expect to add to their workforces, and 6 percent expect a decline in their payrolls during Quarter 1 2017. Seventy-three percent of employers anticipate making no change to staff levels, and the remaining 2 percent of employers are undecided about their hiring plans.

When seasonal variations are removed from the data, the Net Employment Outlook is +16 percent, a slight decrease compared to the Quarter 4 2016 Outlook, +18 percent.  That’s a somewhat more optimistic view than employers in Connecticut, the survey found.

Charitable Giving in CT Not Keeping Pace with U.S., Report Finds

The latest report from the Connecticut Council of Philanthropy (CCP), which highlights philanthropic giving in Connecticut shows that as giving across the U.S. has increased, the opposite is true of Connecticut, even as individual giving – which makes up the lion’s share of giving – has increased. The report, which highlights calendar year 2014 and the years leading up to it, reveals that while total giving in the U.S. increased from 2013 to 2014, total giving in Connecticut dropped from $4.66 billion to $4.51 billion. Over the five years through 2014, individual giving by Connecticut taxpayers who itemized rose 14 percent, less than the increase nationally of 25 percent.  More than three-quarters of giving in Connecticut is by individuals.

In 2014, Connecticut was ranked number one in per capita income by state and 45th in charitable giving.  All six New England states rank at the bottom in per capita giving, while Southern states rank near the top.  Yet the proportion of tax returns reporting contributions in 2014 at 34.5 percent was considerably higher than the national average of 24.5 percent, the report indicated.

The annual report, Giving in Connecticut, looks at charitable giving by Connecticut grant makers and residents, including: individual giving through reported contributions, bequests made through estate giving, and foundation giving. Giving in Connecticut uses data from the IRS Statistics of income Division, the Foundation Center, and self-reported data gathered by CCP.

The report, published this month, found that:

  • Giving in Connecticut from all sources at $4.51 billion was down 3.2 percent from 2013, due primarily to a drop in bequests.
  • The giving breakdown: $3.39 billion from individuals; $1.02 billion from foundations; $.09 billion from bequests
  • Giving by individuals was up 2.8 percent.
  • Giving by all foundations was up 2.1 percent.
  • Giving via bequests was down 74 percent after being up the previous year by 76 percent.
  • Giving by individuals and bequests combined at $3.48 billion amounted to 77 percent of all giving.

The report indicated that giving by foundations saw most grants going to Education and Health. Giving by foundations is greatest in Fairfield County where 56 percent of Connecticut foundations are based. They gave $747 million to charities, representing 73 percent of total foundation grant making.

Religion is the largest single category of recipient type of charity across the U.S., at 33 percent.  Education ranks second at 15 percent.

The 20-page report also found that in 2012, individual giving in Connecticut spiked, apparently in response to Superstorm Sandy and the tragedy at the Sandy Hook elementary school in Newtown.

Connecticut has 1,425 Private Foundations, 79 of which are Operating Foundations, 59 are Corporate Foundations and 20 are Community Foundations, according to the report. Community Foundations assets showed strong growth of 41 percent from 2010 to 2014, from $1.37 billion to $1.92 billion. Connecticut Corporate Foundation giving remained steady during the five year period while private foundation giving climbed.  

The top five foundations, by giving, were the Boehringer Ingelheim Cares Foundation, Dalio Foundation, GE Foundation, The Zoom Foundation, and the Steven & Alexandra M. Cohen Foundation.  Rounding out the top 12 in 2014 were Hartford Foundation for Public Giving, Seedlings Foundation, Newman’s Own Foundation, The Community Foundation for Greater New Haven, Smith Richardson Foundation, Connecticut Bar Foundation and Aetna Foundation.

The Connecticut Council for Philanthropy is an association of grantmakers committed to promoting philanthropy for the public good.