Statistics Conference to Hear Projection of 2013 Boston Marathon Finishes

An analysis by a specially-convened team of academic researchers to project the finish times of runners at the 2013 Boston Marathon, will be presented publicly for the first time at the New England Symposium on Statistics in Sports, to be held on September 21 at Harvard University in Cambridge, MA.

The Symposium is a meeting of statisticians and quantitative analysts connected with sports teams, sports media, and universities to discuss common problems of interest in statistical modeling and analysis of sports data. The symposium is part of a year-long series of programs and events around the world during the International Year of StatisticsBoston-Marathon-logo-2015-1024x1024

The scheduled presentations include a statistical model for predicting the finish times of individuals who were running in the 2013 Boston Marathon but were unable to complete the race when it was abruptly halted after bombs exploded near the finish line last April.  That research was done at the request of the Boston Athletic Association, organizer of the Boston Marathon.

The researchers will explain how multi-year data was analyzed “to create projected times for this year's runners and discuss some features of the resulting projections.”  The BAA opted not to use the statistical model that was developed and provided to the race organizers, choosing instead to use a direct extrapolation of an individual’s time at the point the race was stopped - a result that was, in most cases, more favorable to the runners than the more complex analytical model developed by the research team.  Runners were provided those times within two months of the Marathon.

Just over 5,600 official entrants who were unable to cross the Boylston Street finish line on April 15 when the race was stopped at 2:50 p.m.  Of those, 2,611 are from Massachusetts and 726 are international participants, according to the Boston Athletic Association. In total, residents of all 50 U.S. States (and four U.S. territories), and 47 countries are among this group.  Richard Smith

The lead researcher was Richard L. Smith, the Mark L. Reed III Distinguished Professor of Statistics and Professor of Biostatistics at the University of North Carolina, Chapel Hill. He is also Director of the Statistical and Applied Mathematical Sciences Institute, which is supported by the National Science Foundation.  Smith has previously run in the Boston Marathon, as have three members of his research team.

The researchers included Dorit Hammerling of the Statistical and Applied Mathematical Sciences Institute, Research Triangle Park, North Carolina;  Matthew Cefalu and Francesca Dominici of the Department of Biostatistics, Harvard School of Public Health; Jessi Cisewski of the Department of Statistics, Carnegie Mellon University; Amy Grady of the Department of Statistics and Operations Research, University of North Carolina at Chapel Hill; Charles Paulson of Puffinware LLC, State College, PA; and Giovanni Parmigiani of the Department of Biostatistics, Harvard School of Public Health  and Dana Farber Cancer Institute, Boston.

Smith said that while the BAA decision is “perfectly understandable,” the statistical model his team developed has been credited by the BAA as being helpful in their decision-making, and has both merit and validity that would be of interest to statisticians, runners and sports fans. The model has potential for future use in projecting runners’ finish times from intermediate times during the race, and the research teaNESSISm intends to focus their Symposium presentation on that potential.
The research team analyzed the times of individual runners from the 2010 and 2011 Marathons (2012 data was not used because the day was unusually hot, unlike 2013) at various points of the 26-mile course and developed a statistical model the projected the finish for every 2013 runner based on how similar runners finished in the previous years.  Many runners, for example, tend to slow, but at differing rates, in the race’s final miles.  Others have a strong finish.  The “sophisticated” analysis was developed to offer a more elaborate extrapolation of what individual finish times might have been.  The researchers provided the BAA with a “complete file” indicating a projected finish for each runner.

“It was an interesting challenge, and we were pleased to be asked by the BAA to work on this project,” Smith said.  “Their decision makes perfect sense, but we are proud of our work and the way in which it came together.”  Smith said that in addition to the first-time presentation at the Symposium, the team plans to publish their work in a professional journal.

The group of official entrants who were prevented from completing the race includes 2,983 women and 2,650 men, and ages range from 18 to 82.  A month after the race, the B.A.A. announced that all of the official entrants who did not finish would be invited back to participate in the 2014 Boston Marathon, to be held on April 21.  A special registration period for those individual closed last Thursday, and more than 4,500 runners have signed up.  As part of a rolling registration process, registration for runners who have qualifying times opens on September 9.

The BAA has also announced that the 118th Boston Marathon field will be increased to 36,000 due to increased interest in next year’s race.  Traditionally, the field numbers about 25,000.  Last year, just over 400 participants from Connecticut were registered for the race.  The largest field in recent years was in 1996, for the 100th anniversary of the race, when 38,708 individuals registered.

“We understand many marathoners and qualifiers want to run Boston in 2014, and we appreciate the support and patience that the running community has demonstrated because of the bombings that occurred this past Spring,” said B.A.A. Executive Director Tom Grilk.

The conference co-chairs of the New England Symposium on Statistics in Sports are Mark Glickman and Scott Evans.  Glickman is Senior Statistician at the Center for Healthcare Organization and Implementation Research and a Research Professor in the Department of Health Policy and Management at Boston University.  Evans is a Senior Research Scientist in the Department of Biostatistics at Harvard’s School of Public Health.   Registration is now open for the Sept. 21 symposium.

© 2013 CT by the Numbers

As Enrollment Climbs, Caliber and Diversity of UConn Students Also Increases

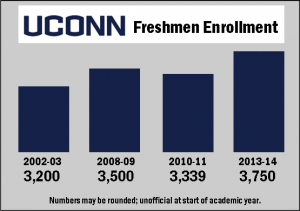
Five years ago, at the start of the 2008-09 school year, published reports trumpeted that “UConn is expecting about 300 more freshmen this fall compared to last, making the 3,500-strong class the largest in the school's history.  Déjà vu all over again, as students arrive on campus to begin the 2013-14 academic year. The state’s flagship university reports a freshman class of “approximately 3,750 members – the largest in the school’s history.”

UConn is also pointing with pride at a freshman class that has:UConn

  • an average SAT score of 1233, which outpaces last year’s incoming freshmen, whose average of 1226 had set the previous UConn record;
  • the most diverse group of students that UConn has ever recruited, with 27 percent of its members representing minority groups;
  • the largest number of Honors Program students (456) to enroll in UConn in a single year;
  • 149 valedictorians and salutatorians in the freshman class (continuing steady growth from 43 in 2002, according to the Daily Campus).

UConn’s new freshmen class draws 32 percent of its students from other states, the same level as in 2002.  In 2010, the Connecticut Post reported that out-of-state students made up 35 percent of the 3,339 freshmen who started their college careers at UConn's main caUConn enrollmentmpus and more than 26 percent of all 4,580 freshmen across the university's main and five regional campuses. That was up from 17 percent in 1995.

This summer, a record number of UConn students enrolled in summer school, taking advantage of incentives that include lower tuition and half-priced housing.  More than 8,800 students enrolled in one or both of the school's summer sessions, according to school officials.  That is up 22 percent from 2009, the year before the school began offering housing incentives for its summer programs.

UConn President Susan Herbst told the Day of New London this week that UConn plans to hire 259 new faculty members, 200 of whom will be teach the so-called STEM subjects - science, technology, engineering and math - and will enroll an additional 6,580 undergraduates in the coming yuconn-night1ears, after legislative approved of Gov. Malloy’s plan for more than $1.5 billion in bonding and $137 million from the state's general fund for "Next Generation Connecticut."  Total enrollment last fall was 30,250, including more than 17,000 undergraduates on its main campus in Storrs.

A decade ago, in October 2002, UConn reported that “freshmen enrollment at the Storrs campus has increased so significantly over the last five years that it will be maintained at about 3,200 students for the next few years."

Official  enrollment figures for the 2013-14 academic year will not be available until September.


Time Short to Nominate State’s Top Librarians; CT Seeks Another Stand-out Year

Nominations for the 2013 Carnegie Corporation of New York/New York Times I Love My Librarian Awards are open through September 6.  For Connecticut librarians, last year’s success will be tough to top.

The I Love My Librarian Award encourages library users to recognize the accomplishments of exceptional public, school, college, community college, or university liblove my librarianrarians. It is a collaborative program of Carnegie Corporation of New York, The New York Times and the American Library Association.

Ten librarians in 2012 – including two from Connecticut - received a $5,000 cash award, a plaque and $500 travel stipend to attend an awards reception hosted by The New York Times. A plaque was also given to each award winner’s library.

Rachel Hyland, a reference and collection development librarian at Tunxis Community College in Farmington, and Rae Anne Locke, library/media specialist at the Saugatuck Elementary “Secret Garden” Library in Westport, were two of the 10 recipients a year ago.  The others worked at libraries in New Mexico, California, North Carolina, New York and Florida.

In order to be eligible, each nominee must be a librarian with a master’s degree from a program accredited by the ALA in library and information studies or a master’s degree with a specialty in school library media from an educational unit accredited by the National Council for the Accreditation of Teacher Education.

rachel-hyland135rae-anne-locke135Nominees must be currently working in the United States in a public library, a library at an accredited two- or four-year college or university or at an accredited K-12 school.

Hyland (left), nominated by Sally Terrell, is described as “a rock-star librarian.  The intelligence, wit, energy she brings to her work has changed the way all of us – from students to faculty to administrators – think about information literacy.”  Locke (right) , nominated by Melissa Augari, has “poured her heart and soul into planning, creating and growing the SES Secret Garden Library, a vibrant, warm and inviting place that is much more than a school library. It is truly the learning hub for our entire school community.” Her collaborative projects “often reach out beyond the school community” and one student said simply, “it’s magical.”

In order to nominate a librarian, five questions must be answered on the contest’s website:

  • What sets him/her apart?
  • Please list a few ways in which the nominee has helped you and made your experience of the library a positive one. For instance, did the nominee inspire in you a love for literature; assist you in a project or finding other information?
  • How has the librarian made a difference in the community?
  • How has the library, and the nominee, improved the quality of your life?
  • How does the nominee make the library a better place?

More information is available at www.ilovelibraries.org. Nominations must be submitted using the online form, and submitted in their entirety.


love librarians

University of Hartford, Wesleyan on Top 25 List: Most Literary Colleges in America

The University of Hartford and Wesleyan University in Middletown have been named as among The 25 Most Literary Colleges in America, by the website Flavorwire. The list focuses on “which universities are the most literary friendly — which ones have the best teachers, the most famous alumni, and have the best environments for their more bookish students.”  Hartford and Wesleyan are the only Connecticut higher education institutions to make the list.

In describing the University of Hartford, the website noted that “While its neighbors in New York and Massachusetts might carry more name recognition, this school was originally founded by a group of the city’s upper class citizens during the Gilded Age, including Olivia Langdon Clemens (Mark Twain’s wife) and Harriet Beecher Stowe.”

Wesleyan University and the University of Hartford - both listed among the top ten on Flavorwire’s “Most Literary Colleges” list – are surrounded on the list by  bookschools including  Princeton, Harvard, Columbia, the University of Chicago, and many other prestigious institutions.

The website goes on to say that the University of Hartford “has a strong English department,” and it notes that the University “has given the Edward Lewis Wallant Award out to authors like Nicole Krauss and Dara Horn.” The Wallant Award, presented each year by the University’s Greenberg Center for Judaic Studies, is one of the oldest and most prestigious Jewish literary awards in the top-25United States.

In describing Wesleyan, the website noted that it is “One of the Little Ivies that is really big on books, V. S. Naipaul and T. S. Eliot both taught at this school that overlooks the Connecticut River, and with a list of writers like Daniel Handler (Lemony Snicket), Ayelet Waldman, Steve Almond, and many others, Wesleyan is without a doubt a writer’s college. “

New York-based cultural blog Flavorwire covers art, music, books, film, and design, seeking to connect viewers of the website with inspiring culture. It is part of Flavorpill Media, a community of writers, editors, developers, designers and sales and marketing creatives.

The top 25 most literary colleges in America,  from Flavorwire:

  1. Princeton University
  2. University of Iowa
  3. Brooklyn College
  4. Pomona College
  5. University of Hartford
  6. Wesleyan University
  7.  Sarah Lawrence College
  8. Oberlin College
  9. Williams College
  10. Vanderbilt University
  11.  Smith College
  12.  University of Mississippi
  13.  New York University
  14.  Colorado College
  15. University of Chicago
  16. Hamilton College
  17. Harvard
  18.  University of Illinois at Champaign-Urbana
  19. Sewanee:  The University of the South
  20.  Emerson College
  21. University of Texas at Austin
  22. Columbia University
  23.  Vassar College
  24.  Bennington College
  25. The New School


Three CT School Districts Approach School Year Preparing for More Instruction Time

Last December, Connecticut was one of five states selected to participate in a pilot project by the TIME Collaborative to extend instruction time during the school year by 300 hours, in an initiative aimed at improving academic preparedness and boosting student achievement.  Seven Connecticut schools, in East Hartford, Meriden and New London, were selected along with schools in Colorado, Massachusetts, New York and Tennessee.

The timetable for the efforts included planning and workshops during the remainder of the 2012-2013 school year, with the new, improved, lengthened academic calendar to take hold when students returned in the fall of 2013.  The new school year – and implementation - is fast approaching.-working-at-desk-r

The TIME Collaborative is a partnership between the Ford Foundation and the National Center on Time & Learning (NCTL) to develop high-quality and sustainable expanded learning time schools. Through the Collaborative, Ford and NCTL are investing in and supporting a select group of states that agree to harness state resources and federal funds using new flexibilities afforded by the federal waiver process to add 300 hours of additional learning time for all students in participating schools.

Ford is providing funds to build state, district and school capacity to support the initiative and is underwriting NCTL’s planning and implementation support to district and schools. Schools in the three Connecticut districts planning to implement the increased instruction time  include:

EAST HARTFORD Thomas S. O’Connell Elementary School

MERIDEN Casimir Pulaski Elementary School John Barry Elementary School

NEW LONDON Jennings Elementary School Winthrop Magnet Elementary School Nathan Hale Elementary School Bennie Dover Jackson Middle School

In the TIME Collaborative program, “high quality expanded learning time schools redesign the traditional school day/year to empower each student with the knowledge, skills, and experiences needed for success in college and career.”  The guidelines include seven areas of focus:

  • Focused school-wide goals
  • Rigorous Academics
  • Differentiated Supports
  • Frequent Data Cycles
  • Targeted Teacher development
  • Engaging enrichment
  • Improved School Culture

Selected districts and schools will have the opportunity to re-engineer their school schedule , and expand opportunities for learning, enrichment and collaboration to improve student achievement, engagement, and teacher effectiveness.  They are also eligible to receive annual capacity building grants and deep technical assistance on effective implementation from NCTL at no cost, as well as joining a network of pioneering educators from across the country.-Time-Leaning-logo

The three-year pilot program will affect almost 20,000 students in 40 schools in the five selected states, with long-term hopes of expanding the program to include additional schools — especially those that serve low-income communities.

Plans called for the schools to implement a collaborative process that would involve the school districts, union leadership, teachers, community partners and parents.  The planning process would allow teams to develop an expanded-time schedule that provides a rigorous, well-rounded curriculum for all students; offers individualized help for students who are struggling; uses data and technology to inform and improve instruction; improves collaboration among teachers; provides enrichment opportunities in the arts, music and other areas critical to development; and promotes a culture of high achievement.

 A mix of federal, state and district funds will cover the costs of expanded learning time, with the Ford Foundation and the National Center on Time & Learning also contributing financial resources.  Just over 1,000 U.S. schools already operate on expanded schedules, an increase of 53 percent over 2009, according to a report from the National Center on Time & Learning.

“For districts that are falling behind, we want to give them the ability to implement the reforms that we know achieve results for students.  The additional funding we’re announcing today will allow for the intensive turnaround models that will help us close the nation’s largest achievement gap,” Governor Malloy said when the program was announced last December.

7 school areas

Achievement Gap Persists Despite Progress Reflected in High School Graduation Rates

The academic achievement gap is alive and well and living in Connecticut.

While the high school graduation rate in the state has edged upward for the third consecutive year in 2012, 15.2 percent - 43,883 students – in the cohort of the class of 2012 failed to complete high school in four years.  This is down from 17.2 the previous year, according to the State Department of Education’s newly released data.  The state’s graduation rate is 84.8 percent – the percentage of students who graduate high school within four years.

Of the 15.2 percent of students who failed to graduate in four years, just over one-third - 5.4 percent - was still enrolled when their fellow students received their diplomas.  Overall, the disparity in graduate rates among whites, blacks and Hispanics was pronounced:

  • The graduation rate of Hispanic students (68.6 percent) is 22.7 percent lower than that of White students (91.3 percent); the corresponding gap between Black/African American students (73 percent) and their White counterparts is 18.3 percent.
  • The graduation rate for low-income students (those eligible for free lunch) is 66.6 percent, whch is 26.5 percent lower than that of students not eligible for any lunch subsidies (93.1 percent).
  • The graduation rate for English Language Learners (62.7 percent) is 23.2 percent lower than that of their non-ELL peers (85.9 percent).

The graduation rate for Hispanics increased 4.4 percent last year over 2011, and it increased 1.8 percent for Black students, reflecting the state’s progress in narrowing the longstanding gap.

However, “just 54.2 percent of Hispanic males and only 57.6 percent of Black males who are eligible for free lunch graduated high school within four years,” the department reported, pointing out the demographic with the greatest disparities.

The report also noted that the high school graduation rate remains higher for males than females in Connecticut , 88.3 percent compared with 81.5 percent.  Anclass seatsd the graduation rate improved more for females (2.3 percent) than males (1.9 percent) from 2011 to 2012.

Across the state’s 188 high schools, the graduation rate was above 90 percent in 100 high schools, 40 high schools had a graduation rate of between 80 and 90 percent, and 38 high schools had a graduation rate of less than 80 percent.

Graduation rates are calculated according to the Adjusted Cohort Graduation Rate method, which was developed by the National Governors Association and is considered to be the most precise method. These rates represent the percentage of students who graduated with a regular high school diploma in four years or less. It is based on individual student level data, excludes 9th grade repeaters, late graduates, and accounts for transfers in and out of the graduating class over the four-year period.

By way of comparison, in North Carolina, 80.4 percent of students graduated high school within four years, somewhat below Connecticut’s overall 84.8 percent.  However, among students of color, North Carolina’s numbers outpace Connecticut.  In North Carolina, 73 percent of Hispanic students now graduate in four years, compared with 68.6 percent in Connecticut.  Among black students, the percentage graduating in four years is 74.7 percent in North Carolina, compared to 73 percent in Connecticut.

Early Childhood Education Supported Nationwide, Poll Finds; CT Improving Coordination of Programs

The First Five Years Fund (FFYF), a national advocate for preschool education, has released the results of a national survey of voters which finds that support across the political spectrum for a plan to help states and local communities provide better early childhood education programs to parents of children from birth to age five.

Conducted by the research team of Public Opinion Strategies and Hart Research, the national telephone survey found that 70 percent of Americans favored providing all low- and moderate-income 4-year-olds with voluntary access to high-quality preschool programs as well as making available more early education and child care programs for infants and toddlers and home visiting and parent education programs for families.FFYE logo

In Connecticut, Gov. Dannel P. Malloy signed an executive order in June that established an Office of Early Childhood (OEC)  in the state, bringing together various programs that had been under the jurisdiction of a number of state agencies.

The Office is “comprised of related programs that were previously housed in five separate state agencies — the Department of Education’s School Readiness program, the Department of Social Services’ Care for Kids, Children’s Trust Fund, and other childcare programs, the Department of Public Health’s childcare licensing program, the Department of Developmental Services’ Birth to Three program, and the Board of Regents’ Charts a Course program — the OEC will improve continuity and the reach of early childhood programs.”

The General Assembly failed to pass a bill creating the new office on the final night of the legislative session in early June, but the state budget allocated $127 million in the first year and $232 million in the second year to the office.  Instead of leaving those dollars hanging in legislative limbo, CT News Junkie reported, the executive order seeks to offer a temporary solution, on an issue that Gov. Malloy has long advocated.

Myra Jones-Taylor was appointed by the Governor as the agency's executive director. She is a member of the New Haven Board of Education and served most recently as director of the state Office of Early Childhood Planning. The Office of Early Childhood is responsible for providing “a comprehensive, collaborative system for delivering improved programs and services to children age zero to five and their parents.”

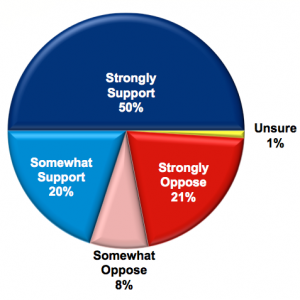
Nationally, support for the preschool proposal increased to 77 percent when respondents were told explicitly that the proposal would not add to the deficit, FFYF said, including 72 percent support from Republicans, 71 percent from Independents and 88 percent from Democrats. A majority of voters (51 percent) strongly support such a proposal.

Other findings from the FFYF_poll-2-300x300survey include:

  •  Ensuring children get a strong start in life was seen as an important national priority by 86 percent of respondents—second only to increasing jobs and economic growth—and 13 points higher than reducing the tax burden on families.
  • Voters say the country is not doing enough on this issue, with 70 percent saying it is an area we need to “do more.” This includes large majorities of voters who have children (77 percent) and those who do not have children in their household (66 percent). Virtually no one (2 percent) thinks we’re doing too much already.

“Americans rightly perceive a need for all children to gain the knowledge and skills necessary to start kindergarten - and life - on the right foot,” said David Nee, Executive Director of the Hamden-based  William Caspar Graustein Memorial Fund.  “Our own experience shows that early is good, and earlier is better.  Infants and toddlers and their families need our support. We can do more, now, to achieve this goal."

In addition to support from large majorities of voters across the political spectrum, key demographic groups are in support of the proposal, including Hispanics (83 percent), African Americans (82 percent), suburban women (68 percent) and young voters under the age of 35 (79 percent).

The survey found that three in five voters (63 percent) want Congress to act on legislation now rather than wait until later (32 percent). And even when presented with “an impassioned argument” from both supporters and critics of making such an investment in quality, voluntary early childhood learning and child care, Americans continue to express their overwhelming support of the proposal.

The survey was conducted from July 8-11 by the bipartisan research team of Public Opinion Strategies and Hart Research on behalf of FFYF. The demographically representative sample of 800 voters was distributed proportionally throughout the country and reached registered voters on landlines and cell phones. The survey has a margin of error of plus or minus 3.46 percentage point.

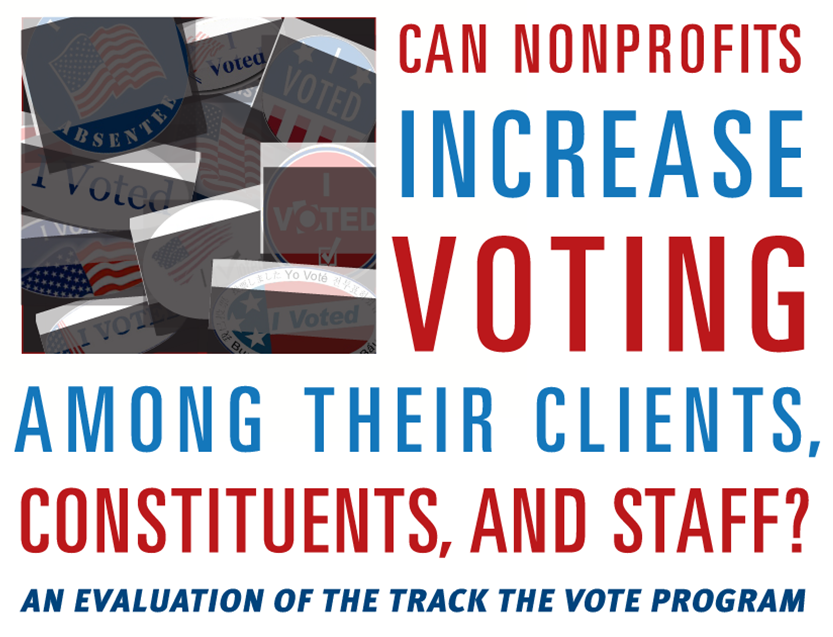
Nonprofits Boost Voter Turnout When They Reach Out to Clients, Study Finds

Voter turnout increases when nonprofit organizations are doing the asking.  That is the finding of a new study by Nonprofit Vote, which tracked the impact of nonprofit voter engagement efforts in seven states.  In addition, the demographic characteristics of the new voters is differs from the general voting population in ways that respond in traditional voting disparities.

“The clients and constituents engaged by nonprofits were markedly more diverse, lower income and younger than all registered voters in the seven states, made up of populations with a history of lower voter turnout in past elections,” the study indicated in its analysis of 2012 voting.  Among the key findings:

Voter turnout among those contacted by nonprofits was 74%, six points above the 68% turnout rate for all registered voters. In fact, nonprofit voters outperformed their counterparts across all demographics.

Voter turnout among voters contacted by nonprofits compared to all registered voters was 18 points higher for Latino voters, 15 points higher for voters under the age of 30, and 1turnout5 points higher for voters with household incomes under $25,000.

“The action by nonprofits had its biggest impact on turnout among least-likely voters – those that campaigns typically disregard based on low ‘voter propensity scores’ assigned before the election to predict their likelihood to vote,” the analysis indicated.  Young voters, ages 18-29, topped the list.

The report--Can Nonprofits Increase Voting Among Their Clients, Constituents, and Staff? An Evaluation of the Track the Vote Program—reflects data compiled from 94 nonprofits in seven states that registered or collected voter pledges from 33,741 clients and constituents during services.

In Connecticut, the Connecticut Association of Nonprofits participated in Nonprofit Vote, a nationwide initiative to involve nonprofits in efforts to urge people to register and vote.  The organization’s September 2012 newsletter, in an article by Nonprofit Vote, pointed out that “Many organizations now recognize the value of voter engagement as a key component in their advocacy toolkit and are no longer watching passively from the sidelines on Election Day.”

 “What stood out the most in the data,” the report found, “was the effect the personal outreach efforts of the nonprofits had in shrinking voter turnout disparities evident among all registered voters and in Census surveys generally.”voting nonprofits

The top reasons that nonprofit organizations cited for conducting voter engagement were to advance their organization’s mission and empower their clients.  Nonprofits used a range of agency-based strategies to engage voters, and the most identifiable success factors were motivated staff and volunteers and strong support from a state or national partner in the form of training, check-ins and materials, the report said.

"Nonprofit service providers are well positioned to integrate new Americans into civic life and engage others who need encouragement to exercise their right to vote. This report provides useful evidence on how service providers can help to increase voter participation of populations new to the political process," said Elizabeth T. Boris, Director of the Center on Nonprofits and Philanthropy at the Urban Institute.

The states participating in the study were Arizona, Louisiana, Massachusetts, Michigan, Minnesota, North Carolina, and Ohio.  The Center for Information & Research on Civic Learning & Engagement (CIRCLE) at tufts University assisted in the analysis.

Noting that past research has found that personal contact with potential voters strongly encourages voting, the report indicated that the data “speaks broadly to the power of personal contact in mobilizing people to vote.  More specifically it affirms the impact of the personal contact coming from someone or an organization known to and trusted by the voter.”

NVRD logoIf you’re planning ahead for voter registration efforts this fall, the National Association of Secretaries of the State (NASS) approved a resolution last month that establishes September 24, 2013 as National Voter Registration Day.  Within the resolution, the Secretaries, who serve as their states’ top elections officials, called for “new and innovative methods” of voter registration.

Founded in 2005, Nonprofit VOTE partners with America’s nonprofits to help the people they serve participate and vote.  The organization is described as the leading source of nonpartisan resources to help nonprofits integrate voter engagement into their ongoing activities and services.

NASS Resolution Establishing September 24th, 2013 as National Voter Registration Day

Manufacturing, Higher Education Strengthen Alliance, Looking Toward Future Jobs

As the New Haven Manufacturers Association celebrates its 100th anniversary in 2013, the future is looking up for an industry that has long been seeing at its heyday in the rear-view mirror.  There has been greater recognition that high tech manufacturing brings opportunities to attract and maintain jobs in Connecticut, and heightened connections between higher education and the manufacturing industry is reflecting the new approach.

That was evident when a fledgling initiative between NHMA and Southern Connecticut State University quickly filled to capacity in its pilot year.  NHMA and SCSU teamed up to sponsor a three-day program acquainting area science teachers with modern manufacturing and materials engineering methods this summer that officials hope will become an annual program.

The Materials & Manufacturing Summer Teachers' Institute, a collaboration that also includes Platt Technical High School in Milford and CRISP (Center for Research on Interface Structures and Phenomena at Yale University and Southern), attracted 30 science teachers from grades 7 to 9. NHMA

The program was designed to enable teachers to better educate middle school students about the relationship between STEM and manufacturing and what types of careers are available in the manufacturing field. Officials say that grade level was specifically targeted because students often decide as early as the middle school years whether or not to pursue math and science in high school, college and even in terms of career paths. More than 40 Connecticut teachers applied to attend the program, which could only accommodate 30 this summer.

Christine Broadbridge, chairwoman of the Physics Department at Southern and education director at CRISP, says area manufacturers and academics have been working for the past year to bring teachers, engineers and scientists together in more effective ways.

"We've learned from the teachers that they value relationships with industry," Broadbridge says. "At this institute, the teachers have found out about potential careers for their students as they learn about engineering and cutting-edge science. It has given them an opportunity to network with industry leaders and to gain hands-on knowledge about manufacturing. We hope they can bring that excitement back to their students."

Gregory W. Gray, the recently installed President of the Connecticut State Colleges and Universities, which includes 17 institutions across Connecticut, told the Connecticut Post this week that he wants the community colleges to take on a more aggressive workforce-development mission by expanding a manufacturing technology program that exists now on a few campuses, including Housatonic Community College (Bridgeport), Naugatuck Valley Community College (Waterbury) and Quinebaug Valley Community College (Danielson).  The program expanded a year ago, based on a very successful program offered at Asnuntuck Community College in Enfield.

There are almost 5,000 manufacturing commaterials-sciencepanies in Connecticut, according to the U.S. Census Bureau, and Connecticut manufacturing employees are 20 percent more productive than competing states, data from the state’s Department of Economic and Community Development indicates, as featured on the ConnSCU website.

The New Haven Independent recently reported on a New Haven company that is very much a part of the future of New Haven manufacturing. That future lies in specialization, in the rapid turnaround of high-tech niche parts, the Independent reported, according to Bill Neale, head of the New Haven Manufacturers Association and vice-president of operations at Radiall manufacturing on John Murphy Drive in the Fair Haven section of the city. The factory isn't trying to compete with massive operations in places like China and India, Neale said. It’s advantage lies not in productivity, but in speed and specificity.

Governor Malloy announced in June that state’s Advanced Manufacturing Centers at the three community colleges will receive $7,325,000 in funding for facility and equipment upgrades that will allow the centers to enhance and develop their educational opportunities. The funding was approved by the State Bond Commission.  According to ConnSCU, the funds would be allocated:

  • $1.5 million for Housatonic Community College to add a welding lab to their manufacturing center. HCC continues its work with its Regional Advisory Board to confirm the need for skilled welders in the region, including the review of options for virtual equipment and the pursuit of appropriate faculty expertise for student learning.
  • $825,000 for Naugatuck Valley Community College to add additional manufacturing equipment to the existing advanced manufacturing center, retrofitted to support local industry needs including the purchase of a deep draw press.
  • $5 million for Quinebaug Valley Community College to build an advanced manufacturing center on their campus in Danielson. For the first year, QVCC has worked with nearby Ellis Technical High School to utilize existing space until the college could grow the program and obtain funds for construction on its own campus. The funding will be used for construction, as well as for the purchase of machinery and other manufacturing equipment.

NHMA was founded in 1913 as the Employer's Association of New Haven County. Today the organization serves businesses, especially manufacturers, in the entire Southern Connecticut region and beyond. They’ll be celebrating a century of operations - looking forward - with a gala on September 19 at Housatonic Community College in Bridgeport.

Half of Eligible Teenagers Delay Drivers License, Study Finds

In an unexpected sign of the times, about half of the teenagers in the U.S. who are old enough to obtain a drivers license are waiting to do so, according to a new survey.  The most common reasons cited for delayed licensure were not having a car, being able to get around without driving, and costs associated with driving.

The study, by the AAA Foundation for Traffic Safety, found that less than half (44 percent) of teens obtain a driver’s license within 12 months of the minimum age for licensing and just over half (54 percent) are licensed before their 18th birthday. These findings mark a significant drop from two decades ago when data showed more than two-thirds of teens were licensed by the time they turned 18, accordidelayed licenseng to AAA.

The report found “Large social and economic disparities in licensing rates and in the timing of licensure.” Low-income, African-American and Hispanic teens are the least likely to obtain a driver’s license before age 18.

Only 25 percent of teens living in households with incomes less than $20,000 obtained their license before they turned 18, while 79 percent of teens were licensed by their 18th birthday in households with incomes of $100,000 or more.

 The findings for licensure by age 18 also differed significantly by race and ethnicity, with 67 percent for non-Hispanic white teens, 37 percent for non-Hispanic black teens, and 29 percent for Hispanic teens.

Some had suggested that teens were waiting simply to avoid graduated driver’s licensing (GDL), missing both the limitations and benefits of the laws, which vary across states, aimed at improving new driver training and safety, and causing some concern.  The survey, however, did not find this to be a prominent reason in delayed licensing.  A number of other reasons for delaying licensure were cited, including:

  • 44 %– Did not have a car
  • 39 % – Could get around without driving
  • 36 %– Gas was too expensive
  • 36 % – Driving was too expensive
  • 35 % – Just didn’t get around to it

Many states impose the GDL restrictions only for new drivers younger than 18.  The AAA report indicated that “Given the  large proportion of new drivers who are 18 years old or older, further research is needed to investigate their levels of safety or risk, to evaluate the potential impacts of extending GDL systems to new drivers aged 18 and older, and to explore other ways to address the needs of older novice drivers.”

In Connecticut, anyone 18 years of age or older must hold an adult learner’s permit for 3 months before obtaining a driver's license.  The state Department of Motor Vehicles website outlines the procedures in Connecticut, which have been revised as recently as January 2013 based on new laws approved by the state legislature.

The proportion of teens who were licensed varied strongly by geographic region, the AAA study found: licensing rates were much higher in the Midwest (82%) than in the Northeast (64%), South (68%), or West (71%).

The study did not discern major variations by gender among teens.  Although males were slightly more likely than females to obtain a license within six months of their state’s minimum age (33% vs. 28%), females were actually slightly more likely than males to obtain a license within 1-2 months of their state’s minimum age.

The researchers surveyed a nationally-representative sample of 1,039 respondents ages 18-20. The full research report and results are available on the AAA Foundation for Traffic Safety website.