Connecticut Leads Nation in Dental Visits for Third Consecutive Year

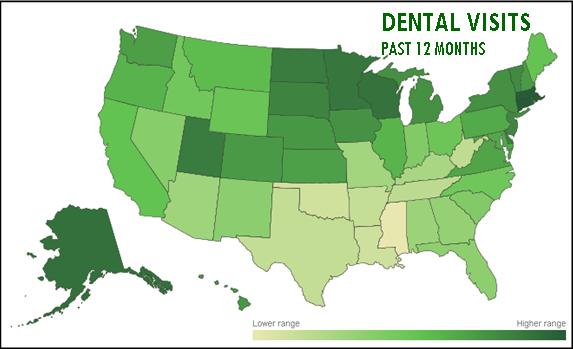
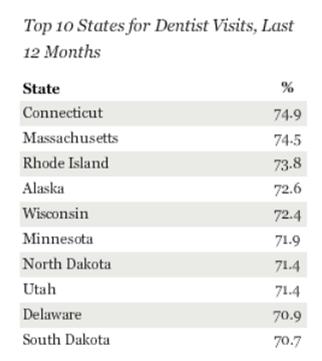
For the third year in a row, Connecticut residents were the most likely to say they visited a dentist in the last 12 months. The state is joined by two New England neighbors, Massachusetts and Rhode Island, as the only states where nearly three in four residents report that they visited a dentist. The top 10 states for dental visits, according to a Gallup Healthways Well-Being survey, are: Connecticut (74.9%), Massachusetts (74.5%), Rhode Island (73.8%), Alaska (72.6%), Wisconsin (72.4%), Minnesota (71.9%), North Dakota and Utah, (each at 71.4%), Delaware (70.9%) and South Dakota (70.7%). kids-dentistry

Just over half of the residents in Mississippi say they’ve visited a dentist during the past year (53%), coming in last for dental care among the 50 states. At the bottom of the list with Mississippi are Oklahoma, Louisiana, Arkansas, Texas, West Virginia and Tennessee. dental visits top 10 states

Five states - Connecticut, Massachusetts, Rhode Island, Wisconsin, and Minnesota - have ranked in the top 10 states for dental visits every year since Gallup and Healthways began daily tracking in 2008.

Connecticut has taken the top spot four times -- from 2011 through 2013, and in 2009. On the other end of the spectrum, eight states -- Mississippi, Oklahoma, Louisiana, Arkansas, Texas, West Virginia, Tennessee, and Kentucky -- have ranked in the bottom 10 every year since 2008. Nationally, 64.7% of Americans in 2013 said they visited the dentist at least once in the past 12 months. This is essentially unchanged from 65.4% in 2012, and remains in line with the averages reported in previous years since 2008.

gallup logoThese findings are based on interviews with more than 178,000 American adults conducted during 2013 as a part of the Gallup-Healthways Well-Being Index. Respondents were asked whether they visited the dentist in the last 12 months.

Residents of Eastern states are the most likely to report visiting the dentist in the past year, according to the survey data. Residents in the Midwest are the second-most likely to report visiting the dentist in the past year, and four Midwestern states are included within the top 10 for 2013. Residents of Southern states are the least likely to go to the dentist and make up eight of the bottom 10 states for dental visits.

The study noted that a relationship between dental visits and income exists, and those states with fewer reported visits also have, on average, a relatively lower percentage of residents with enough money to pay for healthcare and a higher percentage of uninsured residents.

map chart

Hartford’s Health & Fitness Ranks #12 Among Nation’s Top 50 Metro Regions

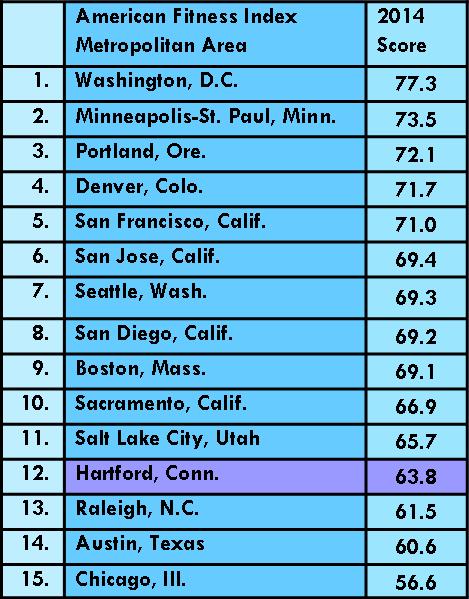
Apparently, Hartford is in better shape than many of us may have thought. In fact, a national analysis by the American College of Sports Medicine (ACSM), with support from the Anthem Blue Cross and Blue Shield Foundation, ranks the metropolitan statistical area (MSA) of Hartford-West Hartford-East Hartford as 12th in the nation in the annual American Fitness Index™ (AFI) report. The 2014 AFI data report, “Health and Community Fitness Status of the 50 Largest Metropolitan Areas,” reflects a composite of preventive health behaviors, levels of chronic disease conditions, and community resources and policies that support physical activity.

In the 2014 report metropolitan Hartford received a score of 63.8 (out of 100 possible points) to earn the overall #12 ranking. Hartford ranked #7 in Community Health and #17 in Personal Health, according to the data analysis.logo

Leading thwalkinge rankings is the Washington, D.C., metro area with a score of 77.3, followed by Minneapolis-St. Paul, Portland, Denver, San Francisco, San Jose, Seattle, San Diego, Boston Sacramento and Salt Lake City.

Researchers analyzed the data from the U.S. Census, the U.S. Centers for Disease Control and Prevention’s Behavioral Risk Factor Surveillance System (BRFSS), The Trust for the Public Land City Park Facts and other existing research data in order to give a scientific, accurate snapshot of the health and fitness status at a metropolitan level.

The data regarding Hartford-Westfitness chart Hartford-East Hartford indicate that 78 percent engaged in physical activity or exercise within the past 30 days, 35 percent eat two pieces of fruit per day, and 14 percent eat 3 or more vegetables per day. Just over 15 percent of the population are smokers. Overall, 60 percent are described as being in “excellent or very good health,” although 36 percent indicate they had days when their “mental health was not good” during the past month.

Among the “areas of excellence” cited for Hartford-West Hartford-East Hartford are a higher percent bicycling or walking to work, more farmers’ markets per capita, more golf courses and tennis courts per capita and a higher percent eating two or more fruits per day.

ACSM worked with the Indiana University School of Family Medicine and a panel of 26 health and physical activity experts on the methodology of the AFI data report. The 2014 edition uses revised methods from the first six full-edition reports released from 2008 to 2013.

New variables, including each community’s Walk Score ranking, have been added or modified and some variables have been removed to improve and enhance the 2014 data report.

“The AFI data report is a snapshot of the state of health in the community and an evaluation of the infrastructure, community assets and policies that encourage healthy and fit lifestyles. These measures directly affect quality of life in our country’s urban areas,” said Walter Thompson, Ph.D., FACSM, chair of the AFI Advisory Board.

The American College of Sports Medicine is the largest sports medicine and exercise science organization in the world. More than 50,000 international, national and regional members are dedicated to advancing and integrating scientific research to provide educational and practical applications of exercise science and sports medicine.

Tolland County is Healthiest in Connecticut, Fairfield Next, Report Finds

The healthiest county in Connecticut is Tolland County, according to a new report analyzing health data from nearly every county in the country. The 2014 County Health Rankings & Roadmaps ranked Connecticut’s eight counties by health outcomes and health factors. According to the report, health outcomes represent how healthy a county is while health factors represent what influences the health of the county.

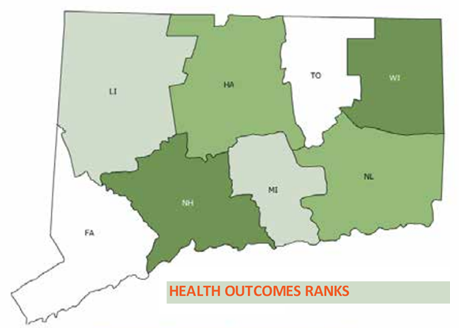
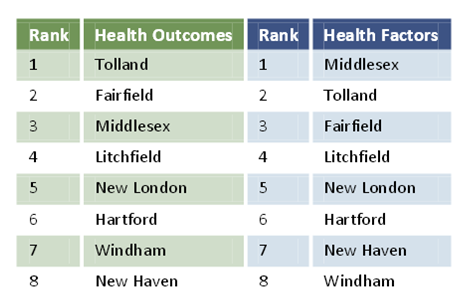
county_health_ranking_300In health outcomes, Tolland County led the way, followed by 2)Fairfield County, 3)Middlesex County, 4)Litchfield County, 5)New London County, 6)Hartford County, 7)Windham County and 8)health outcome ranksNew Haven County.

In health factors, Middlesex County ranked first, followed by Tolland County, Fairfield County, Litchfield County, New London County, Hartford County, New Haven County and Windham County.

The County Health Rankings & Roadmaps program helps communities identify and implement solutions that make it easier for people to be healthy in their schools, workplaces and neighborhoods, according to study authors. The Robert Wood Johnson Foundation collaborated with the University of Wisconsin Population Health Institute on the state-by-state analysis and report, which measured the health of nearly every county in the nation.

The report website includes “county snapshots” - detailed data for each county, in each of the health factors and health outcomes. Comparisons between counties, and the statewide numbers, are also available.ranks

Health factors data included in the analysis are health behaviors, such as tobacco use, diet and exercise, and alcohol and drug abuse; clinical care, including access to care and quality of care; social and economic factors, including education, employment, income, safety and family support; and physical environment, including air and water quality, housing and transit. Health outcomes date included length of life, and quality of life, with factors such as physical health and mental health.

The report website provides specific data in each of the categories, and ranks Connecticut’s eight counties in each factor. This year’s Rankings release marked the fifth anniversary of the first national release of the County Health Rankings.

Spring Flu Hits Connecticut and Northeast Harder than Rest of USA

Not only does winter refuse to quit in Connecticut, the flu season is also slow to recede, with a second wave hitting the region this month.  According to data monitored by the state Department of Public Health, Connecticut is one of only a handful of states where flu cases have remained widespread well into April.

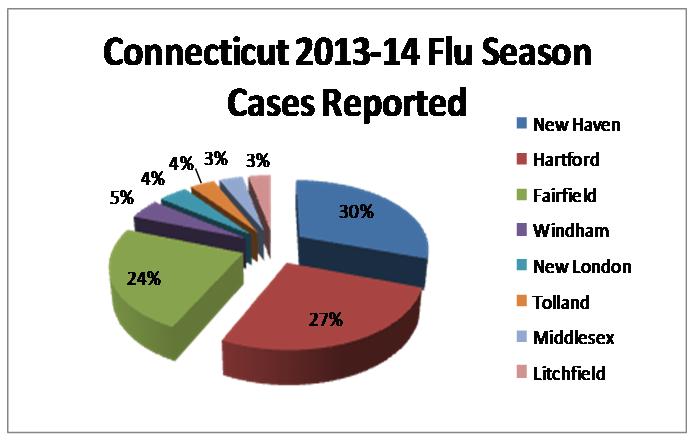
Overall, more than 5,000 cases of various strains of flu have been reported in Connecticut since the start of flu season last fall, with the largest number coming in New Haven County, followed by Hartford and Fairfield Counties.

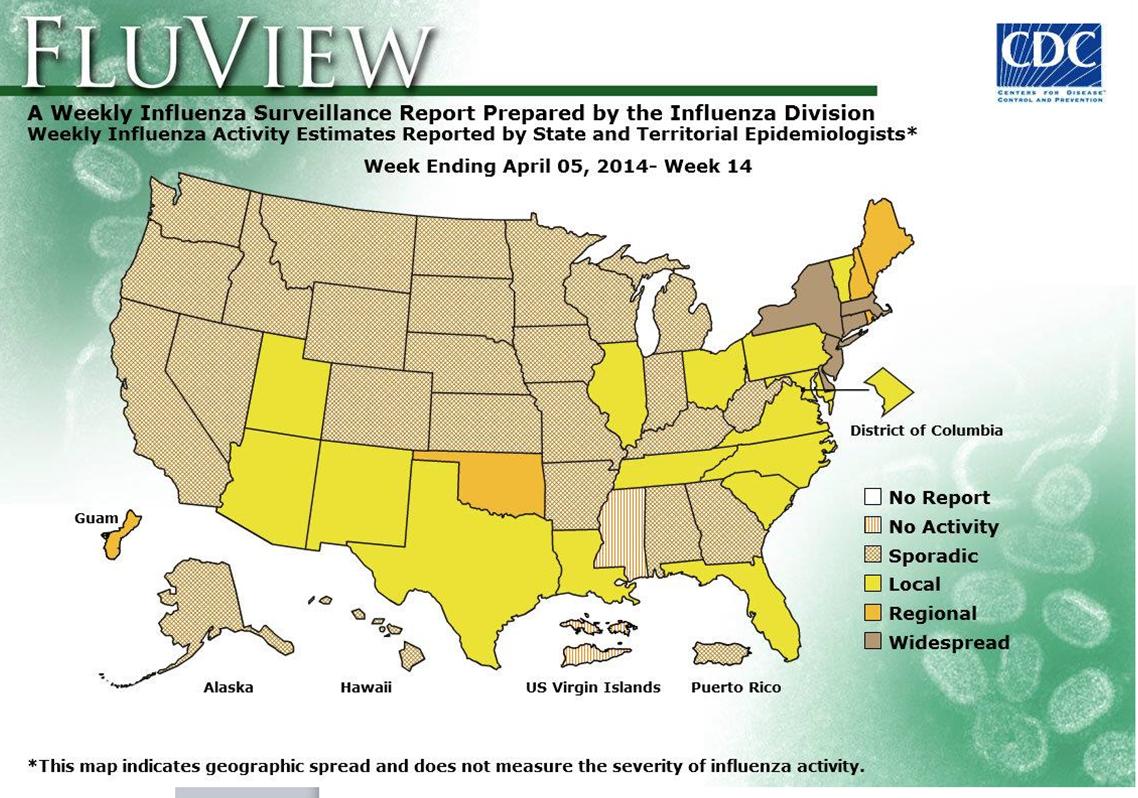
The latest “Flu View” map from the national Centers for Disease Control and Prevention (CDC) indicate while flu season appears to have ended across most of the nation, Connecticut is one of less than a half-dozen states that continue to have “widespread” influenza activity.

flu CTConnecticut is joined by regional neighbors New York, Massachusetts, New Jersey and Delaware in the recent spike in flu cases.  New York has recently been reporting its highest volumes of the entire flu season.  The states of Maine, New Hampshire, Rhode Island and Oklahoma have the next highest level of flu cases, according to the CDC data.

The most recent data, for the week ending April 5, indicates that statewide emergency department visits attributed to the “fever/flu syndrome” have recently increased in Connecticut and continue at a level near or above 5 percent statewide during the last 16 weeks.  The CDC reports that the region including Connecticut, Maine, Massachusetts, New Hampshire Vermont and Rhode Island is one of only two in the nation with “elevated” out-patient flu levels as of early April; the other region with elevated levels includes New York and New Jersey.  The rest of the nation is characterized as being at “normal” levels of flu incidence.

flu view

A total of 5,162 positive influenza reports have been reported for the current season, which is due to conclude, for data collection purposes, next month.  The initial peak in January brought record emergency volumes to some facilities, including Hartford Hospital.  This year’s second wave, is occurring later than a year ago, into April.  Last year's second wave occurred in March.

Influenza has been reported in all eight Connecticut counties since the start of flu season: New Haven (1,559 reports), Hartford (1,384), Fairfield (1,221), Windham (242), New London (220), Tolland (186), Middlesex (179), and Litchfield (171).

This month, Connecticut influenza activity continues to be classified geographically as “widespread” according to the state Department of Health, and many regions in the state are experiencing a second wave of flu activity, led by the influenza B strain, often referred to as “spring flu.”

In Connecticut, the Department of Public Health (DPH) uses multiple systems to monitor circulating influenza viruses. During the influenza season, weekly flu updates are posted from October of the current year, through May of the following year.

Last winter’s flu season brought 57 flu-related deaths to Connecticut, all were among patients at least 55 years of age including 48 (84%) who were greater than 65 years old. The year-long stats, reflecting August 2012 – August 2013, reflected flu instances from residents of all eight Connecticut counties and included: 4,177 from Fairfield County, 2,789 from New Haven County, 1,915 from Hartford County, 672 in Windham, 638 New London, 613 Middlesex, 388 Litchfield, and 319 from Tolland County.  Last year’s total was 11,511 confirmed flu cases, with the number of cases peaking twice, in the week ending Jan. 12, predominantly Type A flu, and the week ending March 23, predominantly Type B.

All data for the current flu season are considered preliminary and are updated with available information each week starting in October and ending in May; a final report will be available from DPH before the start of the next season.


Soda Tax Won't Hurt Job Prospects, Study Finds

As the Connecticut legislature considers a proposal to implement a 2 percent tax on sodas, proposed by Senate Majority Leader Martin Looney at the suggestion of New Haven Mayor and former state senator Toni Harp, two new academic studies challenge the beverage industry’s view that state and local taxes on sugary drinks will hurt employment, and offer suggestions to policy makers based on the tobacco tax experience. Harp has said the soda tax would discourage consumption of the sugary beverages – part of her campaign to combat obesity – and bring in public health logoan estimated $144 million in revenue for the state each year. It would tax all beverages “high in calories or sugar” by two percent, but does not specify how many calories or grams of sugar would trigger the tax.

The studies, appearing in the February and March issues of the American Journal of Public Health, argue, in one case, that claims of employment losses are off base because they focus only on the effects within the industry, ignoring the economic activity that comes with people substituting lower-priced goods for more expensive products as wellsoda as new spending from tax revenues.  The other study says that tobacco taxes offer a how-to road map for policy makers.

The study to be published in March, led by Jennifer L. Pomeranz, JD, MPH, while at the Yale Rudd Center for Food Policy and Obesity at Yale University, uses as its premise that “excise taxes on sugary beverages have been proposed as a method to replicate the public health success of tobacco control and to generate revenue.”

Sugary Beverage Tax Policy: Lessons Learned from Tobacco indicates that “as policymakers increase efforts to pass sugary beverage taxes, they can anticipate that manufacturers will emulate the strategies employed by tobacco companies in their attempts to counteract the impact of such taxes.”  Pomeranz suggests that “policymakers should therefore consider two complementary laws—minimum price laws and prohibitions on coupons and discounting—to accomplish the intended price increase.”

Researchers at the University of Illinois, in a just-published study in the February issue of American Journal of Public Health, found that a 20 percent increase on the price of sugar-sweetened beverages would have an overall positive impact on the labor market.

The American Beverage Association has traditionally argued that manufacturers, distributors and small business owners, particularly grocers and convenience store proprietors, would suffer were soda taxes to be imposed, but the study says that’s not likely.

In recent years, proposals to tax those beverages fell short in California, Vermont, Hawaii, Massachusetts, Mississippi, New York and Rhode Island, Governing magazine reported.  In Maine voters passed a soda tax of 42 cents per gallon in 2008 but repealed it two years later amid a major lobbying effort from the American Beverage Association. Voters in Washington state similarly reversed their legislature in 2010.  As of the end of state legislative sessions in 2011, Governing reported, only four states had taxes specifically targeting sugary beverages, including Arkansas, Tennessee, Virginia, and West Virginia, according to the Tax Foundation.

In the study publstrawished this month, researchers ran a simulation of the impact of 20-percent soda tax in Illinois and California—selected for regional differences—and found slight employment increases would occur, but the net effect would be close to nothing. They found that people choose to spend their money on other things, not to forego spending entirely, and that employment gains in other sectors of the economy far outweigh the job losses for soda makers, National Journal reported.

“We find there are losses in the beverage industry, but when you’re talking about the whole economy suffering job losses, you can’t just talk about your own industry,” Lisa Powell, health policy professor at the University of Illinois at Chicago and the study’s lead author, told National Journal. “Using job loss as a scare tactic for the economy overall is misleading.”

Public health advocates have warned of a link between added sugar and illnesses ranging  from Type 2 diabetes and obesity to heart disease and osteoporosis. The caloric intake of sugary beverages increased dramatically from 1988 to the mid 2000s, though consumption has dropped across all age groups in recent years, Governing reported, with some citing the increased public attraction to teas and other beverages.  Like Harp and Looney in Connecticut, some elected officials around the country have proposed raising taxes on sugary drinks in order to reduce consumption.  The New Haven Register reported that Harp has pointed out that revenue from the cigarette tax has decreased, showing that the effectiveness of a tax in reducing consumption.Jennifer-Pomeranz

Pomeranz is a public health law and policy researcher focusing on marketing, labeling and youth access issues related to food and beverages, over-the-counter diet drugs, and dietary supplements, publishing on topics including discrimination, the First Amendment, public health preemption, and innovative regulatory strategies to address public health problems such as obesity. She is Assistant Professor at the Center for Obesity Research and Education in the Department of Public Health and at the College of Health Professionals and Social Work at Temple University, having served previously as Director of Legal Initiatives at the Yale Rudd Center for Food Policy & Obesity.  She is currently the Policy Chair of the Health Law Section of the American Public Health Association and the official liaison between the American Academy of Pediatrics and the American Public Health Association.lisa powell 2

Lisa Powell is a Senior Research Scientist in the Institute for Health Research and Policy and Research Professor in the Department of Economics at the University of Illinois at Chicago. She has extensive experience as an applied micro-economist in the empirical analysis of the effects of public policy on a series of behavioral outcomes.

A 2011 study by the Yale Rudd Center for Food Policy & Obesity found that young people are being exposed to a massive amount of marketing for sugary drinks, such as full-calorie soda, sports drinks, energy drinks, and fruit drinks.  The study, described as the most comprehensive and science-based assessment of sugary drink nutrition and marketing ever conducted, found that companies were marketing sugary drinks targeting young people, especially black and Hispanic youth.

This story was reported by CT by the Numbers on February 16, 2014

Prison System As De facto Mental Health Service Center Brings Personal, Fiscal Costs

The UConn Health Center, on the pages of its Correctional Managed Health Care website, points out that “the public health burden that jails and prisons bear is enormous. A disproportionate number of incarcerated individuals are medically and/or psychiatrically compromised.” Connecticut is one of only six states with an integrated jail and prison system.

Statewide, each of the 24,936 annual jail and prison “admissions” requires a medical and mental health intake health screening. Generally, the website notes, “one out of five requires prompt medical or mental health intervention.” Schizophrenia, bipolar disorder, post traumatic stress disorder, depression, severe personality disorders, traumatic brain injury and addictive disorders are “overrepresented in this population,” the website indicates.

Mental health services aMental_Healthre available at all prisons and jails in the state, with comprehensive mental health programs at Osborn, Northern, York, Manson Youth, and Garner correctional institutions. Mental health services are comprehensive from admission to discharge, the website explains, and “focus on access to care and outreach, screening and assessment, identification, treatment planning, classification, provision of distinct levels of service and continuity of care upon discharge to the community.”

The mental health department includes approximately 14 psychiatrists, 17 psychologists, 10 mental health nurse practitioners, 19 psychiatric nurse clinicians, 69 social workers, and 15 professional counselors to serve the needs of approximately 19 percent of the inmate population, about 3,400 individuals.  The website indicates that as of June 2013, the prison population was 17,998 individuals (16,985 incarcerated and 1,013 in halfway houses).

A  recent The New York Times column by Nicholas Kristof posited that people suffering from mental illness often commit a crime in order to obtain treatment.  Because of the acute shortage of treatment facilities outside of prison, decades after the wholesale closing of mental health care facilities nationwide, prisons have become the nation’s de facto treatment centers.  Among the stark facts outlined:

  • More than half of prisoners in the United States have a mental health problem, according to a 2006 U.S. Justice Department Study.
  • Among female inmates, almost three-quarters have a mental disorder.
  •  Nationwide, more than three times as many mentally ill people are housed in prisons and jails as in hospitals, according to a 2010 study by the National Sheriffs’ Association and the Treatment Advocacy Center.
  • Forty percent of people with serious mental illnesses have been arrested at some point in their lives
  •  Taxpayers spend as much as $300 or $400 a day supporting patients with psychiatric disorders while they are in jail, partly because the mentally ill require mediation and extra supervision and care.
  • In 1955, there was one bed in a psychiatric ward for every 300 Americans; now there is one for every 3,000 Americans, according to a 2010 study.

Writing in the Connecticut Law Review, Christina Canales pointed out in 2012 that “Although a good plan in theory, deinstitutionalization quickly became one of the main reasons for the substantial increase in mentally ill individuals in prisons.  Many of the originally considered community mental health centers were never developed, leaving such individuals with nowhere to turn for treatment.”

The 2013 Legislation Report of the National Alliance on Mental Illness indicated that “Disproportionate numbers of people with mental illness are involved in the criminal justice system often as a result of untreated or undertreated mental illnesprisons. Thoughtful release planning and progressive probation or parole procedures increase the likelihood of successful re-entry for prisoners living with mental illness.”

In FY 2013, the UConn Health Center website details, there were 191,202 visits to social workers, psychologists and psychiatric nurse clinicians, including suicide risk assessments within DOC facilities. In addition, there were 20,056 visits to psychiatrists and 16,826 visits to Advanced Practice Registered Nurses.

The Connecticut Health Investigative Team (C-HIT) has reported that in 2003, "an estimated 13 percent were considered mentally ill."  In 2003, Connecticut’s prison population was 19, 605, according to the Office of Policy and Management’s Criminal Justice Policy and Planning Division.  That would have been approximately 2,549 individuals.

Fifth Time A Charm? Vulnerable User Bill Back Before Legislature

“Study after study reveals that more people would be willing to make more trips by bike or on foot if they felt they could do so without taking their lives in their hands.”  That comment at a legislative hearing by Kelly Kennedy, Executive Director of Bike Walk Connecticut, highlights the reason behind proposed legislation that would “help hold accountable careless drives who injure or kill non-motorized users of the road.”

Dubbed the “don’t hit me” bill, it is baambulance_ck for a fifth consecutive year at the State Capitol, endorsed by an array of 23 organizations.  In each of the past two years, it passed the Senate but was not considered by the House.  It recognizes that “vulnerable road users,” such as pedestrians, bicyclists, first responders, and highway workers need additional legal protections, and provides enhanced penalties for careless driving resulting in injury or death of a vulnerable road user.

The "Vulnerable User" bill:

  • Provides for a fine of up to $1,000 for injuring or killing a vulnerable user due to careless driving; and
  • Defines a vulnerable user as a pedestrian; cyclist; animal rider or driver; highway worker; farm tractor driver; user of a skateboard, roller or inline skates; user of a wheelchair or motorized chair; or blind person and his or her service animal.

The statistics behind the effort are clear:

  • Careless drivers injure hundreds of people every year in Connecticut--130 pedestrians and cyclists were killed between 2010 and 2012 and approximately 1,400 pedestrians and cyclists are injured every year, according to Bike Walk Connecticut.  Between 2006 and 2012, there were more than 10,000 deaths or injuries.
  • The League of American Bicyclists' top recommendation for Connecticut in its Bike Friendly State Report Card calls for Connecticut to "Adopt a vulnerable road user law that increases penalties for a motorist that injures or kills a bicyclist or pedestrian."  (CT's Bike Friendly State ranking was #18 in 2013.)

Nora Duncan, State Director of the Connecticut AARP, testified in support of the bill, noting that “an older pedestrian is 61 percent more likely to die from a crash than a younger pedestrian.”  The bill, she said, “could improve pedestrian safety by deterring negligent behavior that puts vulnerable uses at risk of injury or death.”  In a survey, 47 percent of people over age 50 in Connecticut said they felt they could not safely cross main roads close to their home.

share the roadThe proposal was also supported by the State Department of Transportation, which suggested that the definition “be all encompassing to include all users such as persons on a legal non-motorized device” such as scooters and skateboards.  Transit for Connecticut, a statewide coalition of 33 business, social service, environmental, planning and civic organizations advocating the benefits of mass transit, supported a vulnerable user law indicating that “with emphasis on energy conversation and healthy lifestyles, the number of walkers and bicyclists is growing.  These residents, along with residents living in close proximity to bus stops and transit services need proper access if they want to use public transit.”

Kirsten Bechtel of the Yale School of Medicine’s Department of Pediatric Emergency Medicine, called for individuals who commit an infraction under the proposed law to “attend driver retraining and perform community service.”  In written testimony, she said that “vulnerable user laws in Oregon, Washington and Delaware include these requirements to ensure that drivers are held accountable and operate their vehicles safely in the future.”  Others, including the Tri-State Transportation Campaign, supported that idea.

Clinton resident Debbie Lundgren, in an email to the Transportation Committee, said succinctly, “pass the Vulnerable User Bill this year.  We have waited long enough!”

The  Committee is expected to consider SB 336 later this month.  If approved there, it would go on to the Senate for consideration.  A road well traveled.

Soda Tax Won't Hurt Job Prospects, Tobacco Tax Offers Preview, New Studies Find

As the Connecticut legislature considers a proposal to implement a 2 percent tax on sodas, proposed by Senate Majority Leader Martin Looney at the suggestion of New Haven Mayor and former state senator Toni Harp, two new academic studies challenge the beverage industry’s view that state and local taxes on sugary drinks will hurt employment, and offer suggestions to policy makers based on the tobacco tax experience.

Harp has said the soda tax would discourage consumption of the sugary beverages – part of her campaign to combat obesity - and bring in public health logoan estimated $144 million in revenue for the state each year. It would tax all beverages “high in calories or sugar” by two percent, but does not specify how many calories or grams of sugar would trigger the tax.

The studies, appearing in the February and March issues of the American Journal of Public Health, argue, in one case, that claims of employment losses are off base because they focus only on the effects within the industry, ignoring the economic activity that comes with people substituting lower-priced goods for more expensive products as wellsoda as new spending from tax revenues.  The other study says that tobacco taxes offer a how-to road map for policy makers.

The study to be published in March, led by Jennifer L. Pomeranz, JD, MPH, while at the Yale Rudd Center for Food Policy and Obesity at Yale University, uses as its premise that “excise taxes on sugary beverages have been proposed as a method to replicate the public health success of tobacco control and to generate revenue.”

Sugary Beverage Tax Policy: Lessons Learned from Tobacco indicates that “as policymakers increase efforts to pass sugary beverage taxes, they can anticipate that manufacturers will emulate the strategies employed by tobacco companies in their attempts to counteract the impact of such taxes.”  Pomeranz suggests that “policymakers should therefore consider two complementary laws—minimum price laws and prohibitions on coupons and discounting—to accomplish the intended price increase.”

Researchers at the University of Illinois, in a just-published study in the February issue of American Journal of Public Health, found that a 20 percent increase on the price of sugar-sweetened beverages would have an overall positive impact on the labor market.

The American Beverage Association has traditionally argued that manufacturers, distributors and small business owners, particularly grocers and convenience store proprietors, would suffer were soda taxes to be imposed, but the study says that’s not likely.

In recent years, proposals to tax those beverages fell short in California, Vermont, Hawaii, Massachusetts, Mississippi, New York and Rhode Island, Governing magazine reported.  In Maine voters passed a soda tax of 42 cents per gallon in 2008 but repealed it two years later amid a major lobbying effort from the American Beverage Association. Voters in Washington state similarly reversed their legislature in 2010.  As of the end of state legislative sessions in 2011, Governing reported, only four states had taxes specifically targeting sugary beverages, including Arkansas, Tennessee, Virginia, and West Virginia, according to the Tax Foundation.

In the study publstrawished this month, researchers ran a simulation of the impact of 20-percent soda tax in Illinois and California—selected for regional differences—and found slight employment increases would occur, but the net effect would be close to nothing. They found that people choose to spend their money on other things, not to forego spending entirely, and that employment gains in other sectors of the economy far outweigh the job losses for soda makers, National Journal reported.

“We find there are losses in the beverage industry, but when you’re talking about the whole economy suffering job losses, you can’t just talk about your own industry,” Lisa Powell, health policy professor at the University of Illinois at Chicago and the study’s lead author, told National Journal. “Using job loss as a scare tactic for the economy overall is misleading.”

Public health advocates have warned of a link between added sugar and illnesses ranging  from Type 2 diabetes and obesity to heart disease and osteoporosis. The caloric intake of sugary beverages increased dramatically from 1988 to the mid 2000s, though consumption has dropped across all age groups in recent years, Governing reported, with some citing the increased public attraction to teas and other beverages.  Like Harp and Looney in Connecticut, some elected officials around the country have proposed raising taxes on sugary drinks in order to reduce consumption.  The New Haven Register reported that Harp has pointed out that revenue from the cigarette tax has decreased, showing that the effectiveness of a tax in reducing consumption.Jennifer-Pomeranz

Pomeranz is a public health law and policy researcher focusing on marketing, labeling and youth access issues related to food and beverages, over-the-counter diet drugs, and dietary supplements, publishing on topics including discrimination, the First Amendment, public health preemption, and innovative regulatory strategies to address public health problems such as obesity. She is Assistant Professor at the Center for Obesity Research and Education in the Department of Public Health and at the College of Health Professionals and Social Work at Temple University, having served previously as Director of Legal Initiatives at the Yale Rudd Center for Food Policy & Obesity.  She is currently the Policy Chair of the Health Law Section of the American Public Health Association and the official liaison between the American Academy of Pediatrics and the American Public Health Association.lisa powell 2

Lisa Powell is a Senior Research Scientist in the Institute for Health Research and Policy and Research Professor in the Department of Economics at the University of Illinois at Chicago. She has extensive experience as an applied micro-economist in the empirical analysis of the effects of public policy on a series of behavioral outcomes.

A 2011 study by the Yale Rudd Center for Food Policy & Obesity found that young people are being exposed to a massive amount of marketing for sugary drinks, such as full-calorie soda, sports drinks, energy drinks, and fruit drinks.  The study, described as the most comprehensive and science-based assessment of sugary drink nutrition and marketing ever conducted, found that companies were marketing sugary drinks targeting young people, especially black and Hispanic youth.

Wide-Ranging Actions Needed to Respond to Growing Alzheimer’s, Dementia Population in CT, Task Force Reports

In a 50-page report to the Connecticut legislature, the Alzheimer’s Disease and Dementia Task Force has outlined a series of 14 wide-ranging recommendations aimed at responding to the needs of a growing number of individuals and families facing the challenges of Alzheimer’s and dementia in Connecticut.

The recommendations include promoting public awareness and best practices including development of an education program for bank personnel, stepped-up dementia-specific training of health care professionals , court personnel and first responders, and improved support of informal caregivers.

The Task Force is urging “mandatory dementia-specific training for hospital emergency room staff, including nurses, physicians and medical technicians,” which may require legislation in the upcoming General Assembly session.  In addition, the Task Force – in another initiative likely to be the subject of legislation- calls for basic level of dementia training for public safety responders, long-term carcovere ombudsmen, protective service employees probate judges and court personnel.

Recognizing that “there are few Alzheimer’s and dementia training requirements for health care professionals and facilities,” the Task Force outlines a series of “detailed recommendations for dementia-specific training requirements across the continuum of care,” including home and community based services such as home health aides, homemakers and companions and personal care assistants.

The report also called for an analysis of the financial impact of developing a Dementia Centers for Excellence (COE) or geriatric assessment units at Connecticut hospitals.

The 25-member task force was formed by the legislature last year, and was administered by Connecticut’s Legislative Commission on Aging.  It was co-chaired by State Rep. Joseph Serra and Department on Aging Commissioner Edith Prague.  The Alzheimer’s Association of Connecticut worked with policymakers on introducing legislation that created the Task Force.  The Task Force met six times over four months, breaking into three subcommittees, which each met 4-6 times, to develop the final recommendations.  The committees focused on 1) Early Detection, Intervention and Planning, 2) Quality Care, Service Delivery and Care Management, and 3) Workforce Training and Development.

According to the Alzheimer’s Association, there are an estimated 70,000 individuals with Alzheimer’s or other dementia.  An estimated 60 to 70 percent of older adults with Alzheimer’s disease and other dementias live in the community, compared with 98 percent of older adults without Alzheimer’s disease and other dementias.  Of those, 75 percent live with someone and 25 percent live alone.  The recommendations also call for:

  • Creation of a public/community awareness campaign through partnerships with agencies and organizations including the Alzheimer’s Association, AARP and Area Agencies for Aging, as well as faith-based and immigrant communities, business/corporate associations, the medical community and resources such as 211.
  • Dissemination of informational packets to be distributed at doctor’s offices, pharmacies, senior centers and other locationsaging
  • Promotion of Medicare Annual Wellness visits which include a cognitive impairment assessment
  • Development of a “bank reporting project” which will train bank employees about “potential red flags” that indicate suspicious activity.  The reported noted that “cognitive impairment poses the most significant risk for exploitation, and bank personnel may be in a unique position to detect financial exploitation of older adult and individuals with dementia.”

To provide greater support for informal caregivers of individuals with dementia, the Task Force is urging development alzof a “train the trainer” dementia course based on the existing Alzheimer’s Association leaders’ training, and drawing on the model of the American Red Cross’ CPR training program to offer “accessible and affordable dementia education to caregivers.”

The Task Force is urging an increase in state funding to expand the Connecticut Statewide Respite Care Program, and to expand and set aside slots for individuals with younger onset Alzheimer’s disease in the Connecticut Home Care Program for the Disabled.

The report also would have the Department of Motor Vehicles “explore policies and regulations related to revoking drivers licenses” and calls on the agency to “take a proactive approach in educating physicians about reporting unsafe drivers to the DMV.” The Task Force also calls for establishment of a care manager registry at the Department of Consumer Protection, a new licensure model at the Department of Public numbersHealth for homemaker and companion agencies and collaborative initiatives with the Department of Social Services.

Julia Evans Starr, Executive Director of Connecticut’s Legislative Commission on Aging, said “It is well-documented that Alzheimer’s and related dementias exact a devastating toll not only on sufferers of the disease, but on the emotional and physical health of their caregivers. Sound public policies that help alleviate emotional and physical stress on affected individuals and their families are imperative, as well as giving these folks choices on receiving care in their communities rather than institutions.”

Dementia is an umbrella term describing a variety of diseases and conditions that develop when nerve cells in the brain die or no longer function normally.  Different types of dementia area associated with distinct symptom patters and brain abnormalities.  Alzheimer’s is the most common type of dementia, which causes problems with memory, thinking and behavior.  Over 5 million Americans of all ages have Alzheimer’s, including one in nine people age 65 and older (11 percent).  That number is expected to increase as the elderly population increases in the coming years.

Concern Over Concussions Changes Playoff, Practice Plans in CT High School Football

Concern over concussions is impacting the high school football playoff calendar, and the practice regimen throughout the season.  The Connecticut Interscholastic Athletic Conference has voted to increase to one week the minimum time between playoff games a high school team can play.  Previously, high school football games could play two games in less than a week, at times with as little as three days between games.  In making the revisions, which eliminated a quarter-final round next season, the CIAC indicated it would “continue to evaluate possibilities for changes to the regular season and postseason schedule for the 2015 season and beyond.”

In addition, the organization’s Sports Medicine Committee approved policy changes that cut back on “permitted allotment of person-to-person contact time in practice” aciacnew-300x230nd are “intended to limit live action,” including:

  • Prior to the start of the regular season a coach may conduct person-to-person contact drills up to 120 minutes during practice plus conduct one full scrimmage or seven-on-seven scrimmage per week under game-like conditions.  If a second scrimmage is conducted the time (60 minutes) must be deducted from the 120 minutes allowed.
  • From the start of the regular season through Thanksgiving a coach may conduct person-to-person contact drills up to 90 minutes per week.
  • During the post season a coach may conduct person-to-person contact drills up to 60 minutes per week.

The Hartford Courant reported that “for the first time, there will be limitations on contact drills in practice throughout the season.”football

Guidelines on the Web

The CIAC website includes an 8-page document developed  by the National Federation of State High School Associations, “A Parent’s Guide to Concussion,” which includes the admonition  (in bold type) “when in doubt, sit them out!”.  The policy was revised and approved in April 2013. CIAC is a member of NFHS, which also offers a free on-line course on the subject for coaches and administrators.

The guidelines indicate that “following a concussion, many student-athletes will have difficulty in school.  These problems may last from days to months…”   The guidelines also explain that “At this time we do not know the long-term effects of concussions (or even the frequent sub-concussive impacts) which happen during high school athletics.”

The CIAC website includes a link to the “Sports Medicine & Concussion” information under two drop-down menu categories on the organization’s website: “CIAC for Students & Parents” and “CIAC for Administrators. “  It is not listed among the “CIAC for Coaches” links.

Regarding the schedule changes, Ledyard head coach Jim Buonocore, who serves on the committee that approved the revisions, told the New London Day, "You had teams playing three games in 10 days, which is not healthy." The Day reported that quarterfinal and semifinal games were played the Tuesday and Saturday after Thanksgiving because the playoffs had to be completed in two weeks. The CIAC didn't want to extend the season another week due to weather concerns, and because it would further interfere with winter sports.

The CIAC has changed its high school football playoff format in 2010, and intends to revisit the issue, balancing the traditional Thanksgiving conclusion of the regular season with the health interests of students on teams reaching the playoffs, the realities of New England winters, and the academic and school sports calendars.

Additional information about concussions and high school sports is available from the Centers for Disease Control and Prevention.