Amtrak ridership breaks all-time records, local corridor sees increase

Amtrak ridership increased in the first six months of fiscal year 2013, with ridership in March setting a record as the single best month ever in Amtrak’s history.  Ridership grew 0.9 percent from October 2012 to March compared to the prior year, despite disruptions from weather, including Superstorm Sandy.  Amtrak said 26 of 45 routes had rider increases during the period and monthly records were set in October, December and January. Ridership on the New Haven – Springfield shuttle grew from 33,196 in March 2012 to 36,962 in March 2013, an increase of 11.3 percent.  Ridership from October 2012 through March 2013 grew by 5.2 percent from the same period a year earlier.  The Acela Express ridership dropped off slightly amid the record-breaking numbers, likely due to service interruptions due to Superstorm Sandy, down 2.5 percent last month compared with a year ago.NHHS

The numbers are encouraging as plans continue to move forward for dramatic improvements and expansions of service on the 62-mile New Haven-Hartford-Springfield (NHHS) corridor in the coming years.  Amtrak is continuing the installation of underground signal and communication cables, required to upgrade signal and communication systems for the NHHS rail corridor.

Work this month is scheduled in Newington, Hartford and Windsor.  The NHHS rail service project will connect communities, generate sustainable economic growth, help build energy independence, and provide links to travel corridors and markets beyond the region, officials say.

The new NHHS rail service will operate at speeds of up to 110 mph, cutting travel time between Springfield and New Haven to just 78 minutes. When the new service is launched in 2016, travelers at New Haven, Wallingford, Meriden, Berlin, Hartford, Windsor, Windsor Locks, and Springfield will board trains hourly during the peak morning and evening rush hours and every 90 minutes during off-peak periods. When all the planned improvements are completed, trains will operate every 30 minutes during peak periods. The full program also includes future, amtrak1new train stations at North Haven, Newington, West Hartford, and Enfield.

Nationally, long-distance routes with ridership growth in the October-to-March period included the New York City to Georgia route, the Palmetto, up 10.5 percent, and the Coast Starlight, which operates between Los Angeles and Seattle, up 10 percent.  Amtrak said ridership was up 9.8 percent on the Illini/Saluki, which operates between Chicago and New Orleans; 8.9 percent on the San Joaquin in California, 8.6 percent on the Piedmont in North Carolina and 8.2 percent on the Wolverine route in Michigan.

Amtrak officials say they expect to end the fiscal year at or above last year’s record of 31.2 million passengers.  The sixth annual National Train Day will be celebrated around the country on May 11.

Amtrak is America’s Railroad®, the nation’s intercity passenger rail service and its high-speed rail operator, with more than 300 daily trains – at speeds up to 150 mph (241 kph) – that connect 46 states, the District of Columbia and three Canadian Provinces. Amtrak operates intercity trains in partnership with 15 states and contracts with 13 commuter rail agencies to provide a variety of services.


More Social Capital = Fewer Traffic Accidents, Research Study Finds

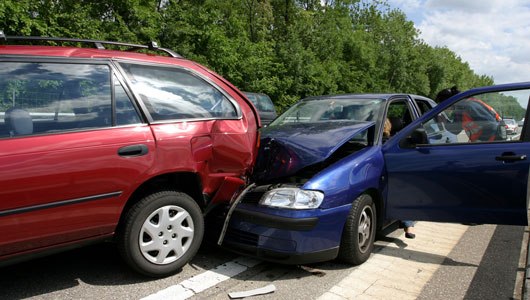
If you’ve never made a connection between traffic accidents and social capital, you’re probably not alone.  However, the Harvard Business Review (HBR) is reporting on research by Matthew G. Nagler of the City College of New York which found, perhaps surprisingly, that a 5% increase in the average level of agreement with the statement "most people are honest" within a U.S. state results in a decline in traffic fatalities in that state by about 11%. The “most people are honest” statement is a measure of trust in others that is an indicator of the state's level of social capital, sometimes defined as a willingness to engage in community activities. Less-conscientious people who reject civic engagement presumably drive more recklessly, HBR reported.

Nagler’s abstract for the researchCarAccidentSafety_main_022, to be published next month in the journal Economic Inquiry, explains thatevidence that social capital reduces traffic accidents and related death and injury, using data from a 10‐year panel of 48 U.S. states show that social capital has a statistically significant and sizable negative effect on crashes, traffic fatalities, serious traffic injuries, and pedestrian fatalities that holds up across a range of specifications.”

In case you were wondering, Nagler – an Associate Professor in the Department of Economics - did not want the research unduly impacted by snow-related accidents, so he used only data from summer months.  The research data used was from 1997 to 2006. His research paper is entitled “Does Social Capital Promote Safety on the Roads?”

The death toll in the U.S. from traffic accidents has been approximately 43,000 deaths annually, according to the report. Traffic fatalities remain a major cause of death at all ages and the leading cause for persons under the age of 44.

In the paper’s conclusion, Nagler notes that the results of his study “parallel prior findings with respect to social capital’s beneficial effects on economic growth and various health outcomes.”  In 2004, a study by three University of Connecticut researchers found that social capital is associated with decreased risk of hunger.“Households may have similarly limited financial or food resources, but households with higher levels of social capital are less likely to experience hunger,” they concluded.

Moving Vans Heading Outbound, Beyond Connecticut’s Borders

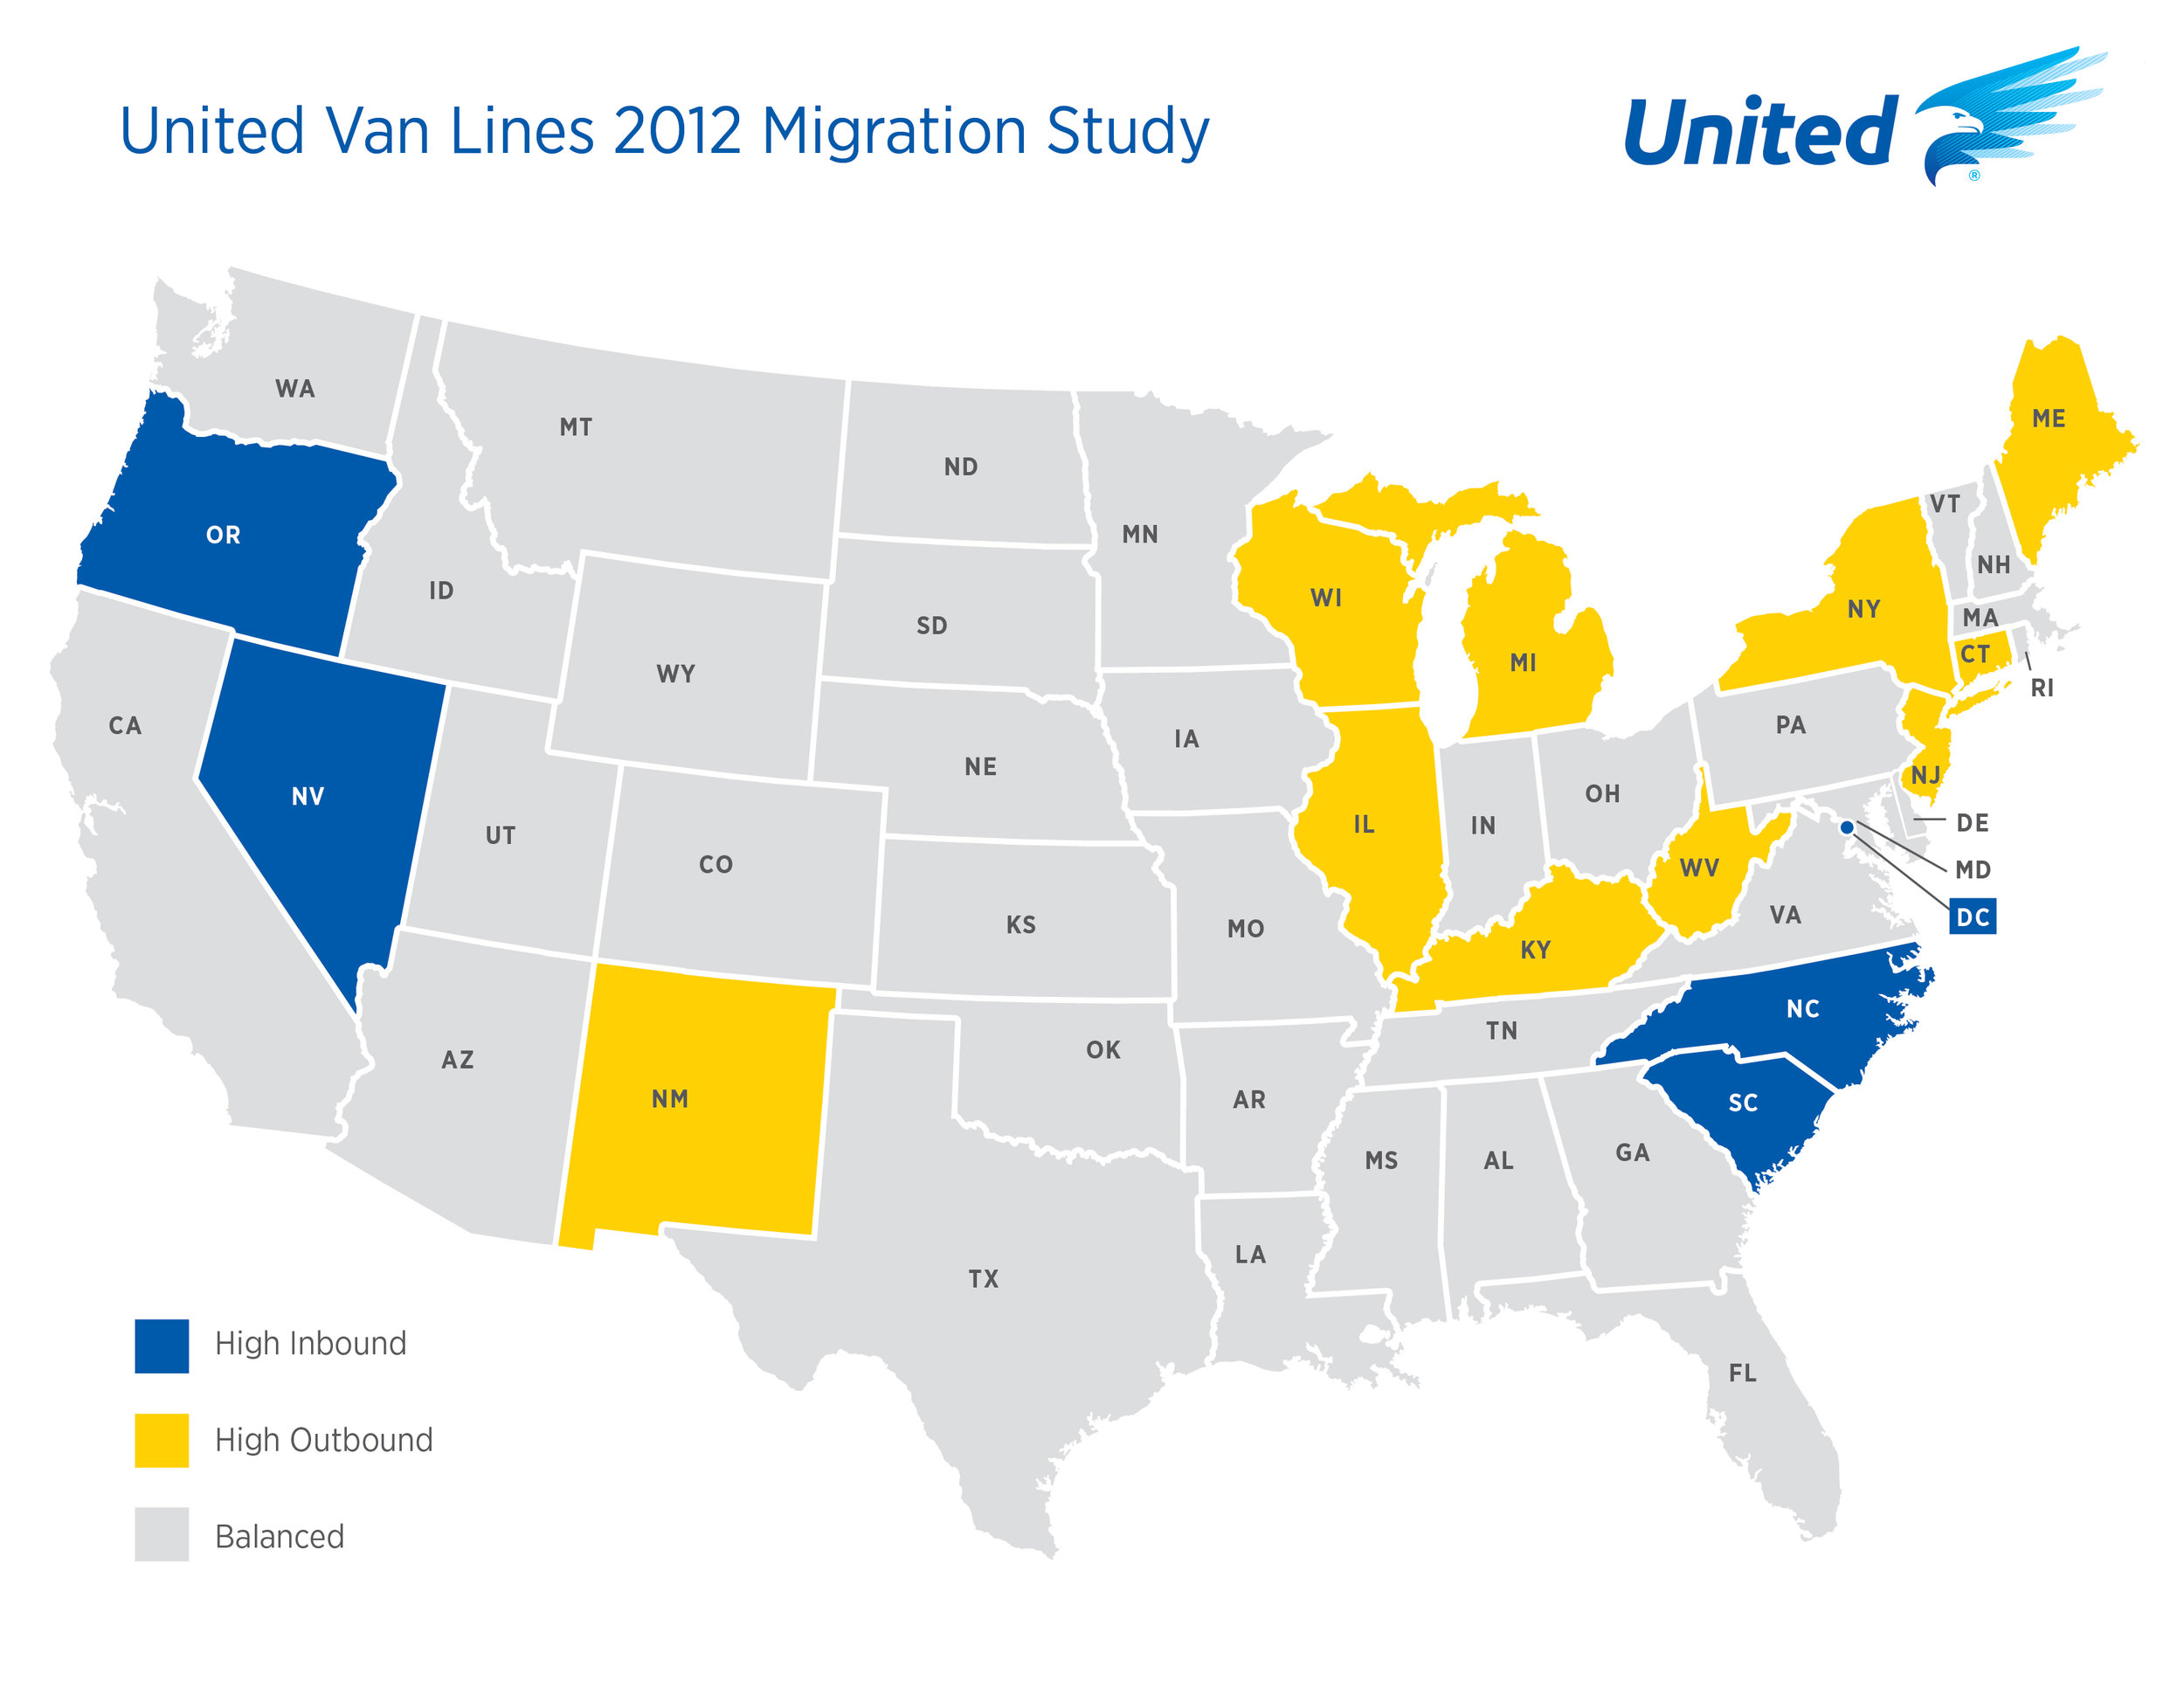
If it’s tough to tell sometimes if you’re coming or going, there is at least one well-known company that keeps close tabs on movement.  United Van Lines, long in the business of moving people from point A to point B, issues an annual “migration study” that tracks where people are moving to, and moving from. In 2012, more folks were going than coming to Connecticut, by a ratio of 56 percent to 44 percent, putting the state squarely among the top 10 outward bound leaders.  The pattern was similar throughout the Northeast.  New Jersey (62 percent) displaced the outbound leader from last year, Illinois (60 percent) reclaiming the top spot for high-outbound migration that it held in 2010.  In addition to New Jersey, New York (58 percent), Maine (56 percent) and Connecticut (56 percent) are also included.

Michigan (58 percent) and Wisconsin (55 percent) along with Illinois represented the Great Lakes region. Michigan fell to the No. 6 from the No. 4 spot it held in 2011. Previously, it had claimed the top outbound spot every year from 2006-2009.  Kentucky (55 percent) joined West Virginia (58 percent) as the only Southern states to appear on the high outbound list. New Mexico (58 percent) was the only Western state to appear on the list. The top 10 outbound states for 2012 were:

  1. New Jersey Migration Map
  2. Illinois
  3. West Virginia
  4. New York
  5. New Mexico
  6. Michigan
  7. Connecticut
  8. Maine
  9. Wisconsin
  10. Kentucky

That’s one list that states would prefer not to be included on.  United has tracked migration patterns  annually on a state-by-state basis since 1977. For 2012, the study is based on all household moves handled by United within the 48 contiguous states and Washington, D.C.  United classifies states as "high inbound" if 55 percent or more of the moves are going into a state and "high outbound" if 55 percent or more moves were coming out of a state or "balanced" if the difference of inbound and outbound is negligible.   The top-five inbound states of 2012 were 1) District of Columbia, 2) Oregon, 3) Nevada, 4) North Carolina and 5) South Carolina.

The Western United States is also represented on the high-inbound list with Oregon (61 percent) and Nevada (58 percent) both making the list. Oregon is number two for inbound migration for the third year in a row. Nevada returned to the high inbound traffic for the second consecutive year. The Carolinas each made the top five with North Carolina at 56 percent and South Carolina at 55 percent inbound moves.

Several states gained approximately the same number of residents as those that left. Those states include New Hampshire from the New England region, and the states of Louisiana, Iowa, Indiana, North Dakota, and Maryland.  This is the fifth consecutive year the District of Columbia (64 percent) was the top moving destination in the United States.  That trend may continue in 2013, what with members of Congress and the Cabinet coming and going.

International Air Travel Connections Drop in Hartford, Jump in New Haven

The Brookings Institute has released data on the flow of international passengers in and out of the largest U.S. metropolitan areas.  The web-based data, drawn from a new report primarily comparing 2003 with 2011, highlights the scale of passenger traffic flows and points to the international markets where these ties are particularly strong. The report, “Global Gateways:  International Aviation in Metropolitan America,” released in October 2012, found that:

  • International air travel in and out of the United States more than doubled between 1990 and 2011. The growth in international passengers during the 21-year period was more than double the growth in domestic passengers and real GDP
  •  Since 2003, international air travel grew between the United States and every global region, with the strongest growth coming from emerging markets.
  • Just 17 metropolitan gateways captured 73 percent of all international passengers starting or ending their trip in the United States as well as 97 percent of all international transfer passengers.
  • As metropolitan economies expand their global reach through trade and investment, international avia­tion plays a pivotal role in the movement of people across national borders.

The national growth was not uniformly reflected in Connecticut.  Of all passengers flying to or from an international destination in Hartford, 17.9% flew direct.  The remainder required connecting flights.  The number of passengers flying internationally thru Hartford dropped from 347,311 in 2003 to 278,997 in 2011, a downward change of nearly 20 percent.  In 2003, Hartford was 40th of 90 airport locations; by 2011 that had dropped to  47th of 90.  The change was a 19.7 percent drop.

By way of comparison, Providence ranked 49th in 2003 in international travelers and 69th in 2011, reflecting a drop in passengers from 187,819 to 126,423, a drop of 32.7 percent.

The numbers for New Haven were considerably smaller, but tell an interesting story nonetheless.  The number of international travelers touching New Haven jumped by 133.5 percent between 2003 and 2011, from 1,645 passengers to 3,841 passengers.  That’s the largest percentage increase of any of the 90 locations in the nation.  In terms of the number of passengers, however, New Haven nudged upward from dead last (90th out of 90) to 89th.

The Brookings data “goes beyond describing where passengers are going and tells us how they get there.”  Using data on transfer points and a map that visualizes each leg of each international route, it paints a portrait of how the global aviation infrastructure rises to meet the demand of international passengers.


East Coast Greenway Charts A Downtown Path in Hartford

You wouldn’t expect to see a sign designating Capitol Avenue in Hartford, on the corner of Sisson Avenue, as the route of the East Coast Greenway – but nonetheless, there it is.  Affixed to a utility pole, not a tree. The East Coast Greenway (ECG) is being established as a 3,000 mile traffic-free (not quite yet) trail that will connect cities and towns from the Canadian border at Calais, Maine to Key West, Florida.  Linking together publicly-owned, firm-surface trails, the ECG is envisioned as a safe route for exercise, recreation and transportation for the 30 million Americans who live near the route and as a tourism destination for millions of visitors.  It includes 15 states (and the District of Columbia), 25 major cities, and scores of smaller cities, towns, villages and counties.

The 198-mile Connecticut section of the East Coast Greenway route shows off the diversity of Connecticut from coast to inland, city to country. The eastern part of the state, sometimes referred to as the “last green valley” is the most rural area in the corridor between Boston and Washington, DC.   A series of rail trails, including the Air Line Trail North and the Hop River Trail, run through this region connecting historic mill towns like Willimantic and pass through forests and farmlands between.

In the western half of the state, the Greenway connects the major cities of Hartford, New Haven, and Stamford and allows users to experience history while touring the Farmington Canal Greenway from Simsbury to New Haven. Southwest of New Haven along Long Island Sound, the interim on-road route hugs the shore through the suburbs to the New York line.

Approximately 28% of the 198-mile route is complete as traffic-free trail, and another 28% is in development. There remains much work ahead,  including the Merritt Parkway Trail, envisioned to parallel the Merritt Parkway in Fairfield County, the Farmington Canal Greenway between Southington and Farmington, and the route from Hartford to Simsbury.

Among the partners working to bring the project to completion in the state of Connecticut are:

This past August, a group of 37 riders traveled from Portland and rode over 400 miles in seven days to Hartford, where they were greeted by Mayor Pedro Segarra.


Historic Bulkeley Bridge Turns 104; Oldest River Crossing in Hartford

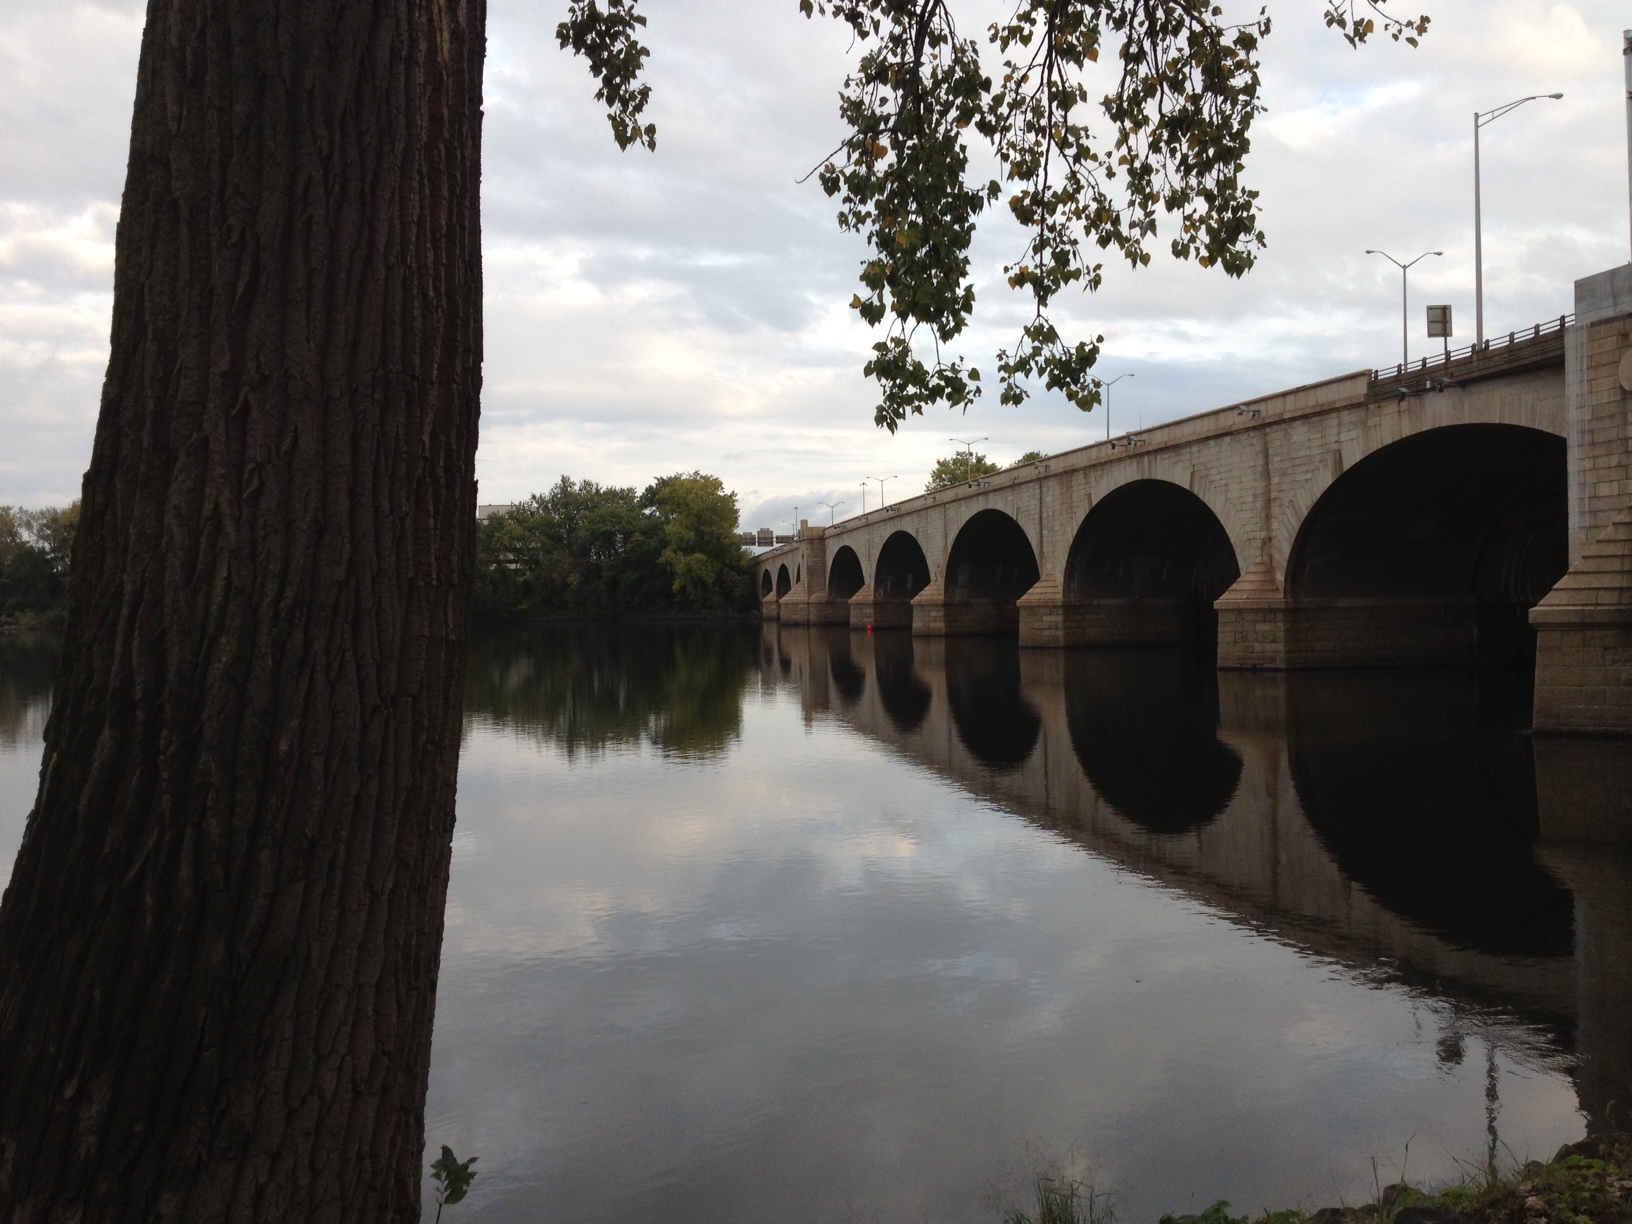
The Bulkeley Bridge, carrying I-84, US 6 and US 44 across the Connecticut River, connects Hartford and East Hartford.  It's the oldest river crossing in the Hartford area, and will celebrate it's birthday this weekend. The bridge opened on Oct. 6, 1908, and was preceded by an older bridge that burned down in 1895. Each day over 140,000 drivers pass directly over one of New England’s most important architectural treasures. The bridge is currently listed on the United States National Register of Historic places as a heritage site.

Construction began in 1903, and the bridge was named after a former Mayor of Hartford and Senator at the time of its construction Morgan G. Bulkeley. The bridge was proposed to replace a two-lane covered toll bridge that opened in 1818. The 974-foot span carried horse traffic, and in 1890 trolley lines were added, connecting Hartford to East Hartford and Glastonbury.

On May 17, 1895, the bridge was destroyed in a raging fire. The legislature looked for a way to replace the old wooden bridge with a more permanent and iconic bridge that would hold up to the elements, honor Connecticut’s heritage, and perhaps most importantly keep Connecticut hiring in-state.

The costs of construction are estimated at roughly $3 million for the State of Connecticut which - adjusted for inflation - has been considered to be the most expensive bridge project  in Connecticut history.

CT Gas Prices Now Highest in Region, Ranked Third in USA

We’re number one in the Northeast.  On October 1, 2012, Connecticut’s average price-at-the-pump for regular gasoline was $4.12 a gallon, slightly higher than New York’s $4.10 a gallon.  The only states in the nation with higher prices are California and Hawaii.  Rounding out the top six- and the only other states topping $4 a gallon - are Alaska and Washington, according to AAA’s Daily Fuel Gauge Report. The U.S. average retail price of regular gasoline, however, decreased five cents last week to $3.83 per gallon.  Nearly a dozen states hover around $3.60 per gallon for regular gas, according to AAA.

The Independent Connecticut Petroleum Association explains, “Connecticut has the highest combined state taxes on gasoline and as a result has the highest gasoline prices. However, if you subtract the state and federal taxes from average state prices across this region - then Connecticut's gasoline prices are no higher than anywhere else in our region.”

This is, however, one expensive region.  Nationally, Connecticut's combined state and federal gas taxes have been consistently in the top five.  In July, Connecticut was surpassed only by California, Hawaii and New York, according to the American Petroleum Institute;  in January, New York, California and Connecticut were all within six-tenths of a penny in leading the tax pack.

Where is the most expensive place in the most expensive state in the region?  According to connecticutgasprices.com, gas stations located in Westport, West Haven and Wilton have the state’s highest prices, topping $4.40 a gallon.  Guilford, East Haven, and Stratford have among the lowest prices, under $4 a gallon.

The U.S. Energy Information Agency (USEIA) reports that gasoline prices tend to be higher the farther it is sold from the source of supply: ports, refineries, and pipeline and blending terminals. About 60% of the crude oil processed by U.S. refineries in 2011 was imported. The U.S. Gulf Coast was the source of about 23% of the gasoline produced in the U.S. and the starting point for most major gasoline pipelines, so those States farther from the refineries tend to  have higher prices, according to USEIA. They also remind consumers that California prices are higher and more variable  because there are relatively few supply sources of its unique blend of gasoline.  California’s reformulated gasoline program is more stringent than the Federal government’s.  And as for Hawaii, well, the price implications of their location are self-evident.

CTrides Encourages Carpooling, Mass Transit with Attractive Benefits and Savings

Here’s a sit-up-and-take-notice statistic:  if you commute 20 miles a day (one-way) to work, it can cost $7,000 a year – and by deciding to carpool, commuters can cut that cost in half. So, how exactly does one find a carpool buddy?  Incredible as it may seem, the government is here to help.  The Connecticut Department of Transportation (ConnDOT) has developed commuter services designed to meet the needs of commuters and employers.  CTrides is the network of employer and employee support programs that endorse a variety of alternatives to driving alone - carpooling, vanpooling, riding the bus and train or telecommuting - resulting in improved air quality, reduced traffic congestion and a better quality of life for all.  Not to mention the potential to save consumers money.

If you would like to figure out just how much you might save, well, there’s an app for that, sort of.  The CTrides website has a link where you can punch in the numbers and come away with estimated savings.

Working with employers across the state (103 employers signed up so far), CTrides seeks to improve commuter mobility to help sustain the growth and vitality of the state’s economy and make the state more competitive in the employment marketplace.  Since the CT Rides initiative was launched – less than a year ago – the number of people taking advantage of ride-matching and ride-sharing is substantial.

The Nuride program, for example, has seen 670 Nuriders pre-register since October 2011. They are using the website to locate carpool candidates, and tracking all of their “green” commuting to earn rewards, at locations such as Barnes & Noble, Applebee’s and Mystic Aquarium.   To date, the Nuriders have saved an estimated $136,919 in commuting costs.  Nuride is offered in seven areas of the country, including Connecticut.  The others are Houston, the District of Columbia, Richmond and Hampton Roads, VA, and Massachusetts.

Officials also point out that there are tax benefits to the CTrides program.  Federal law allows tax savings for commuters who travel to work by train, bus or vanpool. An employer sets up a program (with the help of a CTrides representative) that allows an employee to set aside up to $125 per month of salary before taxes to pay for transit or vanpool fares. An employee may also set aside up to $240 per month for qualified parking. Tax savings, officials report, can be more than $800 a year.

For those hesitant to give up their vehicles, there is even a free trial ride offer.  ConnDOT is offering commuters a free trial ride to work on state-subsidized buses and existing Easy Street® vanpool routes with available seats. The free trial ride consists of a 10-trip bus pass or a free week using an Easy Street® vanpool.

For information, CTrides can be contacted at 1-877-CTrides (1-877-287-4337).

Video Campaign Seeks to Reduce Texting While Driving

Connecticut Attorney General George Jepsen – the father of two teenage boys - has joined a national public service campaign featuring scenes from the award-winning television series “Glee” to help educate young adult drivers on the dangers of texting while driving. The campaign is sponsored by the National Highway Traffic Safety Administration (NHTSA), the State Attorneys General, Consumer Protection Agencies, and the Ad Council, with Twentieth Century Fox Television and Twentieth Century Fox Home Entertainment.

The Connecticut Department of Motor Vehicles reported last month that since tougher teen driving laws took effect four years ago, the number of teen drivers killed in crashes dropped from 7 in 2007 to one in 2011. NHTSA reports that in 2010, more than 3,000 people were killed and an additional 416,000 were injured due to distracted driving, which includes texting while driving.

The new television and digital public service announcements (PSAs) employ a catastrophic crash scene from “Glee,” caused by texting and driving, to emphasize that distracted driving can have horrific consequences.

The PSAs direct young adult drivers to the Texting and Driving Prevention campaign web site, StopTextsStopWrecks.org, where teens and young adults can find facts about the impact of texting while driving and tips for how to curb the behavior.  Three key facts are cited:

  • Five seconds is the average time your eyes are off the road while texting. When traveling at 55mph, that's enough time to cover the length of a football field. (2009, VTTI)
  • A texting driver is 23 times more likely to get into an accident than a non-texting driver. (2009, VTTI)
  • Of those killed in distracted-driving-related crashed, 995 involved reports of a cell phone as a distraction (18% of fatalities in distraction-related crashes). (NHTSA)

Connecticut law prohibits use of handheld cell phones and texting while driving. Fines range from $125 for a first offense to $400 for a third or subsequent offense.  For teenage drivers, the state DMV will suspend the driver’s license or learner’s permit of a 16- or 17-year-old for 30 days to six months for any conviction of violating a teen driving restriction or using a cell phone or text messaging device while driving. Those teens will have to pay a $175 license restoration fee as well as court fines.

According to a new national survey conducted by the Ad Council, the message may be getting through. Thirty-four percent of respondents said that they never text while driving, a significant increase from 28 percent in 2011. All of the new PSAs will run and air in advertising time and space that is donated by the media.

Additional resources

Stricter Laws For Teen Driving Bringing Life-saving Results

Connecticut is observing the four-year anniversary of the state’s adoption of tougher teen driving laws, and the  Department of Motor Vehicles is reporting that the laws are having the intended effect. A series of high-profile crashes in 2007 triggered a campaign that a year later brought new laws with longer periods of passenger restrictions, an 11 p.m. curfew time, stiffer penalties for violations, extended training requirements and a mandated parent-teen information session about safe driving.

According to state officials, the new laws that in 2008 brought increased restrictions, tougher training requirements and expensive penalties for violations, are credited for a steady reduction in 16- and 17-year-old drivers’ deaths.  The number of teen drivers killed in crashes fell from a high of seven in 2007 — the year before the new laws started — to one for last year.

Transportation study researchers in Trumbull, Preusser Research Group, found that Connecticut has seen a strong reduction- more than the national average - for teen driver crashes. Comparing crashes before and after the passage of new laws, Preusser found a 34 percent reduction in 16 and 17-year-olds’ crashes in Connecticut compared to a 26-percent national average.

Among the leaders of the effort to improve Connecticut's teen driving laws was Hartford attorney Tim Hollister, whose sone Reid died in a one-car accident on I-84 in December 2006.  Hollister served on a gubernatorial task force whose recommendations led to the new, stricter laws.

Under Connecticut law, 16-and 17-year-olds, for the first 6 months after obtaining a driver license, may only drive with:

  • Parents or legal guardian at least one of whom holds a valid driver license
  • Licensed driving instructor or
  • Person providing instruction who is at least 20 years old, has held a license for at least 4 years with no suspensions during the last 4 years

For the second 6 months, may drive with the above people and may also drive with immediate family (e.g., brothers, and sisters).  And until 18 th birthday, may not drive between hours of 11 p.m. – 5 a.m. unless it is for:

  • employment
  • school
  • religious activities
  • medical necessity