High Tech Firms Driving the National Economy; Connecticut Slowed as Other Regions Grew

If you’ve wondered why Connecticut has been devoting significantly increased economic development attention on high tech start-up businesses, encouraging and nurturing their development and offering financial incentives at every turn, a new national report on business start-ups in the sector may provide ample rationale.

High-tech startups are a key driver of job creation throughout the United States, according to research by technology policy coalition Engine and the EKauffman reportwing Marion Kauffman Foundation. The report, “Tech Starts: High-Technology Business Formation and Job Creation in the United States,” finds that high-tech startups are springing up at a higher rate than all private-sector businesses – and in more places around the nation.   A total of 384 metropolitan areas were analyzed, including four in Connecticut, using comprehensive data through 2010, the most recent available.

Relative to their share of firms in the economy, high tech is 23 percent more likely, and the ICT sector (Information and Communications Technology), as a segment of high tech, is 48 percent more likely, than the private sector as a whole to witness a new business formation.

usa Though they start lean, new high-tech companies grow rapidly in the early years, adding thousands of jobs along the way, according to the study findings. In fact, high-tech startup job creation is so robust that it more than makes up for the job destruction from early-stage businesses failures – a key distinction from the private sector as a whole where job losses from early-stage failures turns this group into net job destroyers, the report indicated.

However, as the density of high tech firms has grown in metropolitan areas across the country, it has not happened in Connecticut, as data reveals a reduction in the density of high tech firms in the state’s major metropolitan areas during the past two decades.  (The U.S. average is 1.0.)

New Haven-Milford’s start-up density went from 1.1 in 1990, when it was one of nearly 70 metropolitan areas above the national average, to .5 in 2010, while the ICT sector start-up density dropped from above average at 1.2 in 1990 to .5 twenty years later.    The Norwich-New London metropolitan area reflects a drop from 1.1 to .8 in high tech start-up density and 1.1 to .9 in the ICT sector comparing 1990 and 2010.

The data indicate that the Hartford-West Hartford-East Hartford area reflected decreases from .9 high tech start-up densities in 1990 to .6 in 2010, and .8 ICT start-up density in 1990 to .7 two decades later. The Bridgeport-Stamford-Norwalk metropolitan region showed a drop from 1.4 to .9 in high tech start-up density over the 20 year period, moving from above to below the national average, and a parallel drop of 1.6 to 1.1 in ICT start-up density.

The website Engine, which collaboratedstart up density in the report, observed that “Each of the high density metro areas has one of three characteristics, and some have a combination of them all: 1) They are well-known tech hubs with highly skilled workforces, 2) They have a strong defense or aerospace presence, and 3) They are university cities.”

The report noted that “”high-tech startups are being founded across the country fueling local and national economic growth…and are a pervasive force in communities throughout the country.”  The Top 10 Metro Areas for High-Tech Startup Density (1990 and 2010 data):

  1. Boulder, Colo.  (High-tech 4.0 to 6.3; ICT 4.7 to 6.1)
  2. Fort Collins-Loveland, Colo. (High-tech 1.0 to 3.2; ICT 1.1 to 2.6)
  3. San Jose-Sunnyvale-Santa Clara, Calif.  (High-tech 3.0 to 2.6: ICT 4.4 to 2.9)
  4. Cambridge-Newton-Framingham, Mass. (High-tech 2.0 to 2.4; ICT 2.0 to 2.3)
  5. Seattle, Wash.
  6. Denver, Colo.
  7. San Francisco, Calif.
  8. Washington-Arlington-Alexandria, DC-Va.-Md.
  9. Colorado Springs, Colo.
  10. Cheyenne, Wyo.

"This report confirms the dynamism of the technology sector and its disproportionate contributions to the U.S. economy. It also underscores the need for policies that enable and support that dynamism," said Dane Stangler, director of Research and Policy at the Kauffman Foundation.

The report, released earlier this year, used data from the Business Dynamics Statistics (BDS) series, which is compiled by the U.S. Census Bureau and tracks the annual number of new businesses (startups and new locations) from 1976 to 2011.  Ten of the 14 high-tech industries can be classified as information and communications technology (ICT), while the remaining four are in the disparate fields of pharmaceuticals, aerospace, engineering services and scientific research and development.

In explaining the report, Engine noted that “While high-tech firms start small, they scale rapidly in the early years. So much so that young high-tech firms--those aged one to five years--contribute positively to net job creation overall. The opposite is true across the private sector as a whole, where the substantial job losses stemming from early-stage business failures - about half of all firms fail in their first five years - make young firms as a whole net job destroyers. Even when we remove the job destruction from all early-stage firm failures, surviving young high-tech businesses create jobs at a rate twice that of surviving companies in the private sector as a whole.”

CT Boasts 2 of Nation’s Top 10 “Biggest Paycheck” Metro Regions

The Hartford-West Hartford-East Hartford metro area is #7 on the Forbes list of cities where people earn the biggest paychecks. And the Bridgeport-Stamford-Norwalk has earned an even higher slot in the top ten, at #4.

To identify the best-paying cities for jobs, Forbes turned to PayScale.com. Their experts looked at compensation data for professionals in the 100 largest Metropolitan Statistical Areas (based on 2010 population estimates by the Census), and identified the median pay for workers who hold at least a bachelor’s degree, across three experience levels: starting (5 or less years of experience), mid-career (10 or more years of experience) and overall (all years of experience).

The top three citieshartford, w e, according to Payscale economist Katie Bardaro, “are dominated by high wage industries like tech (both IT and Biotech), finance or oil.”  (Metro San Jose, San Francisco and Houston.) Unlike the top three, number 4 is dominated by the finance industry.

“There are a number of Fortune 500 corporate headquarters in this metropolitan area,” she says of the Bridgeport-Stamford-Norwalk metro area. “In fact, it is one of the largest financial districts in the Northeast.”

The median overall pay for mapworkers there is $71,800 annually, while average starting pay is $55,500 and mid-career is $96,900 a year, on average, the magazine reported.  Coming in at #7, the Hartford-West Hartford-East Hartford metro area has overall median pay of $69,200; starting median pay of $53,000; and mid-career median pay of $92,000.

Connecticut and California are the only states to have more than one metropolitan area in the top 10 – California regions finished at #1, #2, and #payscaleforbes10.

The overall median income for all college educated professionals across the U.S. is $61,900 a year, according to PayScale. The mean starting salary is $49,200, while the average mid-career pay is $84,800.

At the other end of the spectrum is the Youngstown-Warren-Boardman, Ohio-Penn., area - the worst-paying city in the U.S.  Here are the top 10, as identified by PayScale and Forbes:

1 San Jose-Sunnyvale-Santa Clara, Calif.

Overall median pay: $99,600 Starting median pay: $73,300 Mid-career median pay: $133,000

 2 San Francisco-Oakland-Fremont, Calif.

Overall median pay: $79,000

Starting median pay: $60,400

Mid-career median pay: $114,000

 3 Houston-Sugar Land-Baytown, Texas

Overall median pay: $71,900

Starting median pay: $56,400

Mid-career median pay: $99,000

4 Bridgeport-Stamford-Norwalk, Conn.

Overall median pay: $71,800

Starting median pay: $55,500

Mid-career median pay: $96,900

No. 5 Seattle-Tacoma-Bellevue, Wash.

Overall median pay: $71,200

Starting median pay: $53,900

 Mid-career median pay: $99,000

6 Washington-Arlington-Alexandria, D.C.-Va.-Md.-W.V.

Overall median pay: $70,200

Starting median pay: $54,800

Mid-career median pay: $104,000

7 Hartford-West Hartford-East Hartford, Conn.

Overall median pay: $69,200

Starting median pay: $53,000

Mid-career median pay: $92,000

8 Boston-Cambridge-Quincy, Mass.-N.H.

Overall median pay: $68,900

Starting median pay: $53,300

Mid-career median pay: $99,600

9 New York-Northern New Jersey-Long Island, N.Y.-N.J.

Overall median pay: $68,800

Starting median pay: $52,900

Mid-career median pay: $101,000

10 San Diego-Carlsbad-San Marcos, Calif.

Overall median pay: $67,900

Starting median pay: $51,700

Mid-career median pay: $96,500

Revitalizing CT Downtowns Earns Recognition, Success

For the Connecticut Main Street Center, a greater role in the advancement of downtowns across Connecticut is bringing both recognition and a facelift.  The organization, recently selected by the Connecticut Chapter of the American Planning Association (CCAPA) to receive the 2013 Education & Outreach Award for its "Come Home to Downtown" initiative, is launching a new branding initiative to match its more visible role supporting the state’s municipal main street initiatives.

Their new, updated  logo reflects the changing face of tCT Main Street Centerhe state’s downtowns, one that commands attention and respect for being forward-thinking while preserving the integrity and values of the past.  At CMSC, “we'll continue to promote the Four Point Approach to downtown management while also championing innovations in transit and sustainable design, promoting our local businesses and attractions, and advocating for mixed-use development that integrates housing with a diversity of uses, cultures and incomes.”

Through the Come Home to Downtown program, which just concluded its pilot year, CMSC and its team of expert consultants worked with community leaders, local stakeholders, and downtown management groups to educate them on the value and potential of mixed-use development. The organization also sought input and feedback from the public at community meetings held in each of the towns on the plans for redeveloping the model buildings and the demand for downtown housing.Come-Home-logo-150x150

CMSC chose three communities – Middletown, Torrington and Waterbury – as well as three property owners and their buildings as the focus of the program’s in augural year.  It is a pilot program aimed at facilitating viable, interesting housing opportunities while revitalizing downtown neighborhoods by providing customized technical assistance to communities and owners of small, under-utilized downtown properties.

CMSC worked with municipal officials and the building owners to develop viable redevelopment options including: determining what financing would likely be needed for redevelopment; performing an assessment of zoning and regulatory requirements; reviewing the downtown management function; and measuring the downtown's walkability. APA CT

Specific recommendations for improving the buildings, including a recommended floor plan designed to attract new residents and bring market rate housing downtown, was also provided to each property owner. Once rehabilitated, these buildings are expected to create 60 new units of rental housing in downtown Middletown, Torrington and Waterbury, as well as make approximately 25,000 square feet of commercial and retail space available. The total development cost to renovate all three buildings is estimated to be $11.4 million.

The 2013 Education & Outreach Award was presented to CMSC at CCAPA's Annual Award Luncheon last month. CCAPA is the Connecticut Chapter of the American Planning Association, the national organization of professional planners and citizens involved in planning communities. CCAPA is dedicated to advancing the practice of good planning in Connecticut. Every year, CCAPA solicits nominations for notable planning projects in a variety of categories from public service and citizen planners to physical development and plan implementation.

Health Risks of Flame-Retardant Chemicals Require Policy Changes in CT, Nation, Report Says

The 2014 session of the Connecticut General Assembly is expected to include consideration of legislation designed to protect the public from potential health risks of flame retardant chemicals that are present in many consumer products.  Such a proposal, currently being developed, comes following a report from North Haven-based Environment and Human Health Inc. (EHHI), an organization of physicians and public health professionals, that calls on state and federal governments to institute new policies to protect the public from flame-retardant exposures that the researchers say “pose health risks to fetuses, infants, children and the human population as a whole.”

The comprehensive 107-page report, “Flame Retardants: The Case for Policy Change,” closely examines the health risks that flame-retardants pose to the general population and recommends sweeping policy changes to protect the public.

"It has become clear that flame-retardants are proving to be a health risk to both the human population and the environment,” said Nancy Aldermaflame reportn, president of Environment and Human health, Inc. “It is time for flame-retardants to be removed from all low fire-risk situations and products. As well, a certification program should be established where manufacturers certify the absence of flame-retardants, just as organic food programs certify the absence of pesticides.”

The report examines the history of flame-retardants and demonstrates the enormous scope of the problem, noting that flame-retardants “are now ubiquitous in our environment.”  The history of flame-retardant use in the United States is a story of substituting one dangerous flame-retardant for another, the report outlines. The country lived through decades when asbestos was used as a fire-retardant. Then when asbestos was proven too dangerous to be used, the country moved over to PCBs, and five decades later, when PCBs were deemed too dangerous for use, the country moved on to chlorinated and brominated flame-retardants.

The report points out that “the labeling of flame-retardant chemicals in consumer products is NOT required by Congress, EPA, FDA or the Consumer Product Safety Commission.  It is therefore impossible for consumers to avoid flame-retardants in their purchases.”  Sources of exposure cited in the report include carpets, mattresses, children’s and baby products, furniture, and electronics.  falame retardant

In the 1970s, a flame-retardant called "Tris" was added to children's sleepwear. Tris was later found not only to be carcinogenic but also capable of being absorbed through the skin. Tris was finally banned in children's sleepwear in 1977, according to the report.  Tris is still used in many other infant products, such as crib mattresses, changing tables, nap mats, and infant car seats, the report indicated.

"Tris was, and remains, carcinogenic," said Dr. D. Barry Boyd, oncologist at Greenwich Hospital and Affiliate Member of the Yale Cancer Center.  There is ample evidence concerning the health risks from Tris to conclude that it should be removed from all infant products."

John Wargo, Ph.D., first author of the report and the Tweedy-Ordway Professor of Environmental Health and Political Science at Yale University, said, "Flame-retardants are not required to undergo health and environmental testing, and they are not required to be labeled on the products that contain them. Because exposures to flame-retardants carry health risks, they should only be used when the risk of fire outweighs the risk from flame-retardant exposures. When risk from fire is high, such as in airplanes, then the use of flame-retardants is warranted; when the risk from fire is low, flame-retardants should not be used."

Recent toxicological studies demonstrate that flame-retardants pose the greatest risk to the normal growth and development of fetuses, infants and children. "Manufacturers should start labeling their products so that consumers can understand when flame-retardants have been added," said Dr. Andrea Asnes, associate professor of pediatrics at the Yale School of Medicine.

Environment and Human Health, Inc. (EHHI) is a non-profit organization composed of physicians, public health professionals and policy experts, dedicated to protectinEHHI
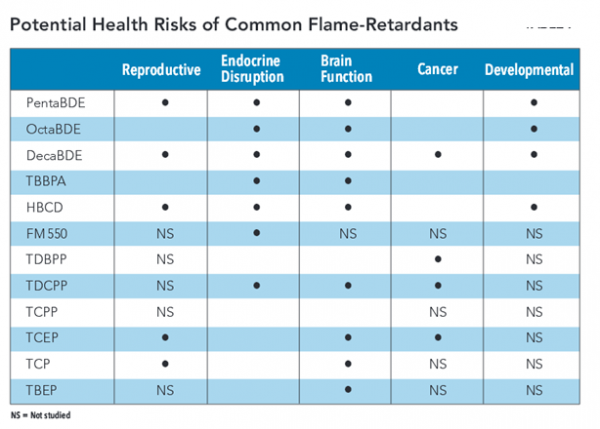
g human health from environmental harms. EHHI does not receive any funds from businesses or corporations.   The organization’s mission is “to conduct research to identify environmental harms affecting human populations, promote public education concerning the relationships between the environment and human health, and promote policies in all sectors that ensure the protection of human and environmental health with fairness and timeliness.

By promoting effective communication of environmental health risks to those exposed and to responsible public and private officials, EHHI hopes to empower individuals and groups to take control over the quality of their environment and be more protective of themselves and their families.  The report was issued in November 2013.  Among the recommendations :

  • States should pass laws that protect their citizens from flame-retardant exposures.  Industry will always work to pre-empt states’ legal authority to set safety standards that are more stringent than those adopted by the federal government. States should have the right to protect their citizens when the federal government fails to do so.
  • States should restrict flame-retardants in infant and toddler products.  Recent toxicological studies show that flame-retardants pose the greatest risk to the normal growth and development of fetuses, infants and children. Infants and small children’s body weight is so low that their exposures to flame retardants, in relation to their body weight, is simply too great. The health risks that all infants and children are experiencing, due to the federal law mandating that flame retardants be in many of their products, far outweigh the risk of fire.
  • States should require that products containing flame-retardants be labeled.  Any product containing a flame-retardant should be labeled as such. Labels should include which flame-retardant has been used.
  • States should promote fire-prevention programs.  States should invigorate their fire prevention programs. Promotion of fire prevention is the most effective, least expensive, least environmentally damaging priority our nation could pursue to reduce loss of health, life and property from fires. States should promote low-cost and highly effective early warning technologies. Smoke alarms save lives. They should be available to all, regardless of income status.
  • States should offer opportunities to recycle electronic products.  Foam that contains flame-retardants remains a problem for landfills. State and local governments have primary responsibility for managing the disposal of solid and hazardous wastes. Most solid wastes in Connecticut are disposed of via incineration, but some are still placed in landfills. The broad failure to effectively recycle electronics, building materials, auto plastics and foam means that most products containing flame-retardants are released to the environment at the end of their life-cycle.

Exodus: Connecticut Ranked #1 in People Moving From State

Connecticut residents are on the move.  Out.

The state led the nation with the highest percentage of outbound moves in 2013, according to Atlas Van Lines’ annual report of moves throughout the U.S. and Canada. Of 2,055 residents' moves during the year, 1,230 of them, or 60 percent, were out of state – the highest percentage in the nation.  That's compared to 825 moves from other states into Connecticut.new_atlas_logo

A year ago, Connecticut was #7 in the nation in the ratio people moving out-of-state, with 1,123 outbound and 834 inbound moves, in a survey by United Van Lines.  This year, Connecticut led the nation in outflow of residents in the Atlas Van Lines survey.

us moving mapDuring the past five years, inbound moves peaked in 2010 at 1,009 – with a just slightly higher  1,160 outbound moves.  Since then, the numbers have skewed increasingly out-of-state, Atlas reported.

The 2013 year was the state's highest outbound percentage and highest total number of outbound moves since 2009.  Connecticut has been an outbound state for six of the past ten years, including the past three consecutively, according to Atlas.  An “outbound” state is defined as one that has more than 55 percent of moves outbound.

The remainder of the New England states were "balanced" in 2013, with the exception of New Hampshire, which was considered an inbound state in 2013. The data indicates that progressively fewer people were moving into Connecticut in the last three years, a pattern not consistent throughout New England.  None of the other New England states were outbound states in 2013.  In the previous year, Maine joined Connecticut as an outbound state in the United Van Lines survey.

States that saw the greatest percentage of inbound movers: North Dakota, North Carolina, and Texas.  States with the highest outbound move percentage after Connecticut were New York and Indiana, both at 59 percent.  Only 12 states were net outbound states:  Connecticut, New York, Indiana, Wyoming, Delaware, Nebraska, Minnesota, Illinois, Indiana, Ohio, Pennsylvania, and New Jersey.Connecticut

The Greenwich Time reported that the branch manager of Danbury's Certified Van Service of Connecticut say, his truckers – part of the United Van Lines company - relocated about 100 families from the Hartford area to Charlotte, N.C., and from Fairfield County to Atlanta. For Kevin Kaster, president and owner of Kaster Moving in Stamford, the study confirms one trend he's recently experienced.  "Texas has been a hotspot the last two years, no question," he said. "An inordinate amount of people from around here are going to Texas."  Brielle Sollinger, aoutboundssistant marketing manager at Fallon Moving and Storage in Windsor, agreed.   "Texas is big. We also do lots of Virginia, North Carolina and South Carolina," she said in a phone interview Friday afternoon.

Atlas reported that across the nation, most states were balanced evenly between inbound and outbound moves. The company also reported that the number of total moves increased during the year, something it said could be an indicator of an improving economy.  The data covered the period from January 1 through December 31, 2013.

Small Business Friendliness in CT Improved to D+ in 2013, Data Shows

Connecticut’s small business climate is improving – slowly.  That’s according to the 2013 Small Business Friendliness Survey by Thumbtack.com, in partnership with the Ewing Marion Kauffman Foundation, which ranked the state #35 for overall small business friendliness.

The 2013 study draws upon data from over 7,000 small business owners nationwide and shows that Connecticut improved its overall grade slightly, rising from a 'D' in 2012 to a 'D+' in state mapthis year's study.

Although the state struggled overall, the study authors reported, it received high marks in several categories. Some of the key findings for Connecticut include:

Connecticut earned an 'A' for the state's small business training and networking programs, which ranked among the top-5 nationally. Business owners were critical of Connecticut's regulatory systems, giving the state a 'C' in this category, although this was an improvement from the 'D+' grade received last year.

Among its neighbors, Connecticut ranked just behind New York (which had trailed Connecticut in last year's study) and Massachusetts, but ahead of Rhode Island for overall small business-friendliness.

The state’s overall grades, and comparison with last year, in the 11 categories compared in the survey:

D+         Overall friendliness (D last year)

D+         Ease of starting a business  (C last year)

B            Ease of hiring (C last year)

C             Regulations  (D+ last year)

B-            Health & Safety  (C+ last year)CT welcomes you

C-            Employment, labor & hiring  (D+ last year)

C-            Tax code (D last year)

C             Licensing  (D+ last year)

D+          Environmental (D+ last year)

C-            Zoning (C+ last year)

A             Training & networking program

The study aims to learn what small businesses believe constitutes a healthy political and regulatory climate by having them rate how it is to do business in their specific location along various metrics.

Over 99% of U.S. employer firms qualify as small businesses, and they employ half of all private sector employees. Over the past two decades, almost two-thirds of net new private sector jobs have come from small businesses, and that number has accelerated in recent years.

The thumbtack survey also compared the age and size of the businesses with those of the general business population. The Small Business Adkauffman-details-logoministration reports that 69% of small businesses are at least two years old, and 51% are at least five years old.  The survey sample is very close to these numbers, with 76% over two years old and 57% at least five years old.

According to US Census data, 91.6% of small businesses have between one and four employees. Another 3.8% have 5-9 employees, and 4.6% have 10 or more employees. The survey respondents followed a very similar distribution: 89.3% have between one and four employees, 6.7% have 5-9 employees, and 4% have 10 or more employees.

Some of the key findings at the national level include:

  • Professional licensing requirements were 30 percent more important than taxes in determining a state's overall business-friendliness, confirming the findings from last year's study. Furthermore, this year's research revealed that 40 percent of U.S. small businesses are subject to licensing regulations by multiple jurisdictions or levels of government.
  • Utah was the top rated state, and Austin, TX was the top rated city. At the other end of the spectrum, Rhode Island and Newark, NJ were the lowest rated state and city.
  • The ease of obtaining health insurance was an important factor for many businesses. One-third of small business owners rated obtaining and keeping health insurance as "Very Difficult," versus only 6 percent who rated it "Very Easy."
  • Small businesses were relatively unconcerned with tax rates – more than half of small business owners felt they pay about the right share of taxes.

The top 10 states were Utah, Alabama, New Hampshire, Idaho, Texas, Virginia, Kansas, Colorado, South Carolina, Georgia, Minnesota, Nevada and North Carolina. Professional/nonprofessional services make up a large share of Thumbtack’s clients, so fewer manufacturers and retailers were surveyed, which may have impacted the survey results.

"It is critical to the economic health of every city and state to create an entrepreneur-friendly environment," said Dane Stangler, director of Research and Policy at the Kauffman Foundation. "Policymakers put themselves in the best position to encourage sustainable growth and long-term prosperity by listening to the voices of small business owners themselves."

Hartford Hospital Will Devote Annual Fundraiser to Mental Health

The call to action regarding mental health awareness and treatment, which intensified in the aftermath of the Sandy Hook Elementary School murders a year ago, now has a strong local voice for the New Year.  Hartford Hospital is kicking off a campaign to end the stigma of mental illness at the annual Black & Red Gala on January 25, 2014 at The Bushnell Center for the Performing Arts in Hartford. The goal is to obtain 5,000 pledges, spreading the message that changing attitudes can begin to change minds.

Proceeds raised at this year’s Black &Red will benefit the Institute of Living (IOL) at Hartford Hospital. The IOL will be better able to respond to this national call to action with improved access to mental health care for adolescents and young adults –a critical need not only in Connecticut, but throughout the nation. Support will help carry out critically needed research, offer increased shhMainLogoSubervices and treatments, and provide much needed education to those impacted by mental illness.

An estimated 26.2 percent of Americans ages 18 and older — about one in four adults — suffer from a diagnosable mental disorder in a given year. In addition, mental disorders are the leading cause of disability in the U.S. and Canada. Many people suffer from more than one mental disorder at a given time.

Mental health stigma can be divided into two distinct types, according to the Hartford Hospital website:

  • social stigma is characterized by prejudicial attitudes and discriminating behavior directed towards individuals with mental health problems as a result of the psychiatric label they have been given.
  • perceived stigma or self-stigma, is the internalizing by the mental health sufferer of their perceptions of discrimination and perceived stigma can significantly affect feelings of shame and lead to poorer treatment outcomes.StopTheStigma_WordsMatter

The annual gala – Hartford Hospital's lead fundraising event - will feature entertainment by Barenaked Ladies, winner of two American Billboard Music Awards and two Grammy nominations.

Individuals attending the event will be asked to sign a “pledge” to...

  • Show compassion by reaching out to those in need of help. I will not let anyone suffer in silence.
  • Have the courage to speak up and challenge stereotypes and attitudes. I will not tolerate or perpetuate stigma.
  • Teach by sharing my own experiences with mental illness and encouraging others to share their stories with me. I will learn in order to change.
  • Demand a change in how we view and address mental illness. I will help lead the way.

The pledge, and additional information about mental illness and the Hartford Hospital initiative, is now available on a new webpage on the Hospital’s website, at www.stopthestigma.org   Individuals do not need to attend the event in order to sign the pledge – that can be accomplished directly on the website.

 “We will be looking to our employees of Hartford Hospital and across the Hartford HealthCare system to take the pledge. As a healthcare leader in the community and the state, it is our duty to set the example and stop the stigma associated with mental illness. Together, we can do it,” said Stuart Markowitz, M.D., President Hartford Hospital and Hartford Region, Senior Vice President Hartford HealthCare.

Harold (Hank) Schwartz, M.D., Hartford HealthCare Regional Vice President, Psychiatrist in Chief, Institute of Living at Hartford Hospital, says for some people, a mental illness iol_logo_300x175may be a lifelong condition, like diabetes. “However, as with diabetes, proper treatment enables many people with a mental illness to lead fulfilling and productive lives. By helping combat the stigma associated with mental illness, we can help increase the number of people that seek treatment.”

Examples of common mental illnesses include bipolar disorder, depression, PTSD, schizophrenia, OCD, anxiety disorders, eating disorders, ADD/ADHD, autism and Asperger’s.  CT by the Numbers has previously reported on research underway at the Institute of Living.

A year ago, over $1,000,000 in net proceeds was raised at the Black & Red gala for Hartford Hospital’s transplant services.

Connecticut is Nation’s Fourth Most Innovative State, Data Reveals

Connecticut is ranked as the nation’s fourth most innovative state, in a new analysis from Bloomberg Technology.  The state’s ranking was based on factors including education, professionals in science, technology, engineering and math (STEM) fields, state research and development spending, and technology companies.

The state’s overall score in the analysis, 76.45, is just behind top-ranked Washington’s 83.25, California’s 81.97 and Massachusetts’ 80.93. States were ranked on a scale of zero to 100 in six factors, and received an overall score that was an average of the six. Because productivity consisted of two sub-factors, each was weighted 50%.

 Connecticut’s ranking was based on the following factors:states of innovation

  • STEM professionals as a percentage of state population: 2.72% (CT ranked #7)
  • Science and tech degree holders as a percentage of state population: 10.2% (CT ranked #6)
  • Utility patents granted as a percentage of U.S. total: 1.74% (CT ranked #17)
  • State government R&D spending as a percentage of U.S. total: 2.79% (CT ranked #8)
  • Gross state product per employed person: $114,891 (CT ranked #5)
  • Three-year change in productivity: 0.88% (CT ranked #32)
  • Public tech companies as a percentage of all public companies based in the state: 17.65% (CT ranked #17)

Sources of the data include Bloomberg, Bureau of Economic Analysis, Bureau of Labor Statistics, National Science Foundation, U.S. Census, and the U.S. Patent and Trademark Office.  The analysis was updated in November 2013, and the rankings were published this month.

The remainder of the top 20 innovative states were:

5. Oregon 6. New York 7. New Jersey 8. Colorado 9. Maryland 10. Minnesotabloomberg technology 11. Virginia 12. Texas 13. Utah 14. Arizona 15. North Carolina 16.  Illinois 17. Pennsylvania 18. Kansas 19. New Hampshire 20. D.C.

At the bottom of the list of innovative states were Louisiana, Tennessee, Wyoming, Mississippi and Arkansas.

College Coaches Are Highest Paid Public Employees in 40 of 50 States, Including CT

When UConn announced the hiring of Bob Diaco as new head football coach earlier this month few flinched at the compensation – a reported five-year $8 million contract.  Diaco, who served on the Notre Dame coaching staff as the defensive coordinator for the past four years and the assistant head coach for the past two, was the 2012 winner of the Frank Broyles Award, given to the top assistant college football coach in the country and was the first Irish assistant to receive the prestigious award. He was a semifinalist for the award in 2011.

Earlier this year, the Yankee Institute for Public Policycoaches salaries 
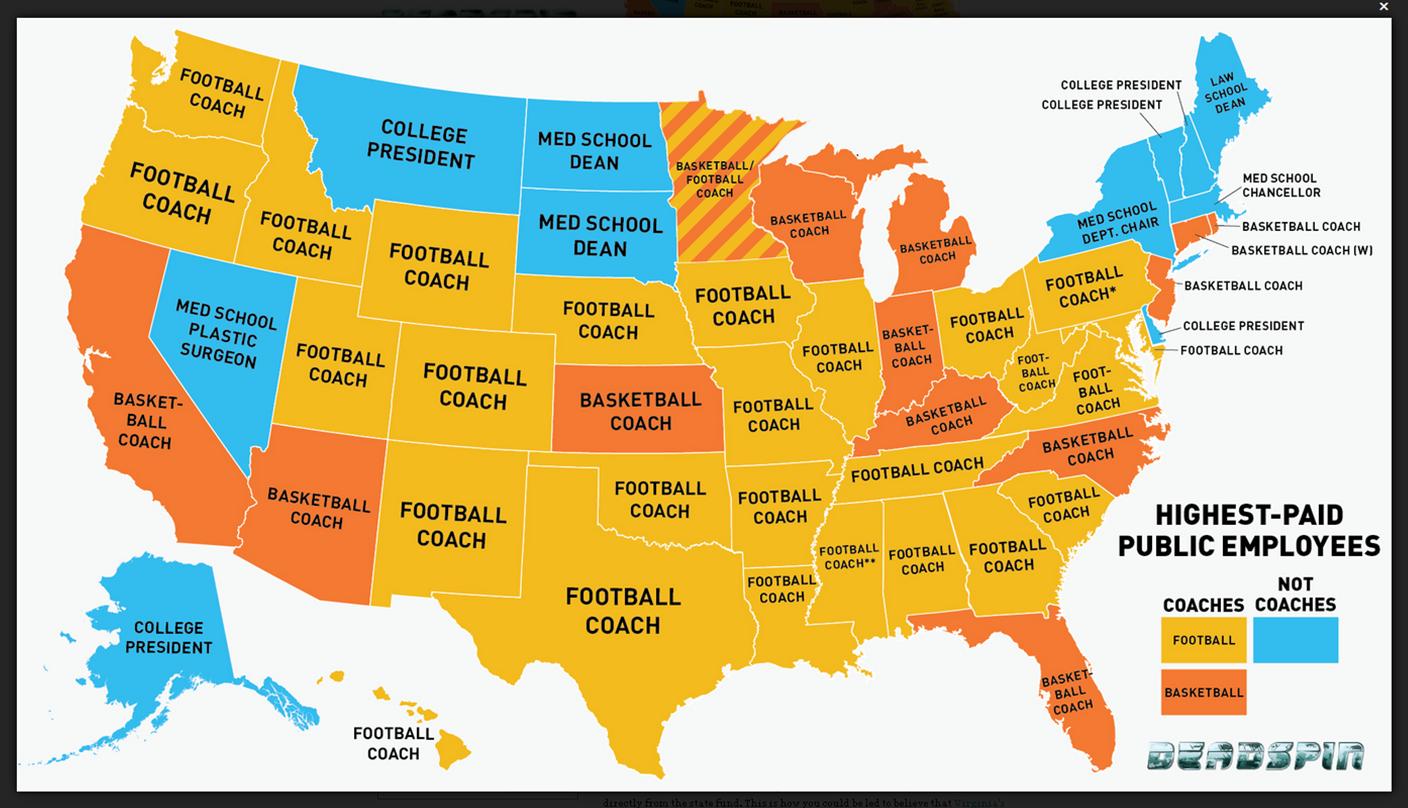
compiled a list of the highest paid state employees, and three UConn coaches led the list:

  • 1. Calhoun, James A., Men's Basketball Head Coach, UConn $2,865,769
  • 2. Auriemma, Geno, Women's Basketball Head Coach, UConn $1,829,052
  • 3. Pasqualoni, Paul L., Football Head Coach, UConn $1,613,920  (dismissed as coach earlier this fall)

As it turns out, that is not unusual.  According to data compiled by the website Deadspin, the ranks of the highest-paid active public employees in states across the country include 27 football coaches, 13 basketball coaches, one hockey coach, and  10 state employees with responsibilities outside of athletics.  That’s 80 percent of the states with a public employee salary roster led by a coach.

Perhaps surprisingly, the states of New York, Massachusetts, Vermont, New Hampshire and Maine are among those where a college president, law school dean medical school dean or department chair top the state employee salary list.  In Rhode Island, it is the men’s basketball coach, and in Connecticut, with the retirement of Jim Calhoun, the leader is now women’s basketball coach Geno Auriemma.

Last December, UConn and head men's basketball coach Kevin Ollie, a 1995 UConn graduate,  announced a new agreement to run from January 1, 2013 through April 15, 2018.  Under the coaching contract, Ollie receives a base salary of $400,000 per calendar year and for 2013 he will receive $800,000 for institutional speaking engagements and media related appearances for a total of $1,200,000, according to the University's announcement. The payment for institutional speaking engagements will increase by $50,000 each year. Ollie's total compensation for each year of the agreement will be: 2013-$1,200,000; 2014-$1,250,000; 2015-$1,300,000; 2016-$1,325,000; 2017-$1,340,000; 2018-$502,500 (annualized from Jan. 1-April 15).

The website reports that “looking at data from 2011-2012, athletic departments at 99 major schools lost an average of $5 million once you take out revenue generated from "student fees" and "university subsidies.”

Rounding out the top 10 list in Connecticut, as of 2012:

  • 3. Onyiuke, Hilary Chief, Division of Neurosurgery UConn Health Center $1,030,732
  • 4. Nulsen, John Director, Center for Advanced Reproductive Services, UConn Health Center $917,373
  • 5. Makkar, Hanspaul Chief, Division of Pediatric Dermatology, UConn Health Center $916,600
  • 6. Whalen, James Vice Chair, Dermatology UConn Health Center $884,602
  • 7. Laurencin, Cato CEO, Connecticut Institute for Clinical and Translational Science, UConn Health Center, $701,576
  • 8. Herbst, Susan ,President, UConn $612,500
  • 9. McFadden, David, Chief, Department of Surgery, UConn Health Center $576,923
  • 10. Manuel, Warde Athletic Director UConn $551,305


New Haven Is Among Most Walkable Cities in America, Ranks #8 Nationwide

New Haven is one of America’s most walkable cities, with 11.2 percent of commuters walking to work, the 8th highest percentage in the nation, among cities with populations of at least 100,000.  The top 10 list of Most Walkable Cities, published by GOVERNING magazine, notes that many of top communities are in the Northeast, and that communities across the country are stepping up efforts to enhance alternative ways of commuting from home to work. New_Haven_downtown_map
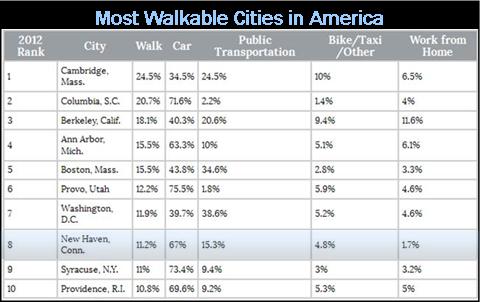
The top cities were Cambridge, MA (24.5%), Columbia , SC (20.7%), Berkeley, CA (18.1%), Ann Arbor, MI (15.5%), Boston, MA (15.5%), Provo, UT (12.2%), Washington, DC (11.9%), New Haven, CT (11.2%), Syracuse, NY (11%) and Providence, RI (10.8%).OLYMPUS DIGITAL CAMERA

Overall, 67 percent of New Haven commuters use their car, 11.2 percent walk, 4.8 percent bike or use other modes of transportation, and 1.7 percent work from home., according to the data developed from the U.S. Census Bureau's American Communities Survey, which included 300 metropolitan areas.

Nationally, only 2.8 percent of workers primarily commuted by walking last year, a figure that remains mostly unchanged from recent annual estimates, GOVERNING reported.

Among the New Haven walkers, 36 percent are age 16-24, 52 percent are age 25-44, 9 percent are age 45-64 and 2 percent are age 65 or older.  The median age of walk commuters is 27.8, according to the date.  In categorizing individuals, a person’s longest distance traveled is used, so those walking tp transit stations are designated as public transportation commuters, even though a portion of their daily commute involves walking.

Among Connecticut’s most populous cities, in Bridgeport 4.3 percent of commuters walk to work; in Stamford the figure is 4.7 percent, in  Hartford 7.9 percent, and in Waterbury 2.6 percent.

walkable chart