More People Working From Home in Connecticut, Nationally

“Technologically-enabled opportunities for telework could be one factor contributing to the reduction in driving,” according to a report issued by ConnPIRG which has identified a drop in driving frequency in nearly every state in the nation, including Connecticut.

The report, “Moving Off the Road: A State-by-State Analysis of the National Decline in Driving,” notes that “the internet and other communications technologies have enabled many people to perform work from home that could only be done in an office previously. Email, conference calls, videoconferencing, and shared digital files have made it far easier for people to “telecommute” from home. In this way, telework might reduce household driving by eliminating commuting trips.”

The number of people who work from home a majority of the time stood at 4.3 percent in 2011.Counting a broader measure of all workers who report that they perform some of their job from home at least one day a Home-iconweek, 9.5 percent did so by 2010, up from 7 percent in 1999.

The most recent National Household Travel Survey indicates that 9 percent of city commuters telecommute even once per month, compared to 14 percent of suburban commuters and 10 percent of rural and town commuters, the report indicated.

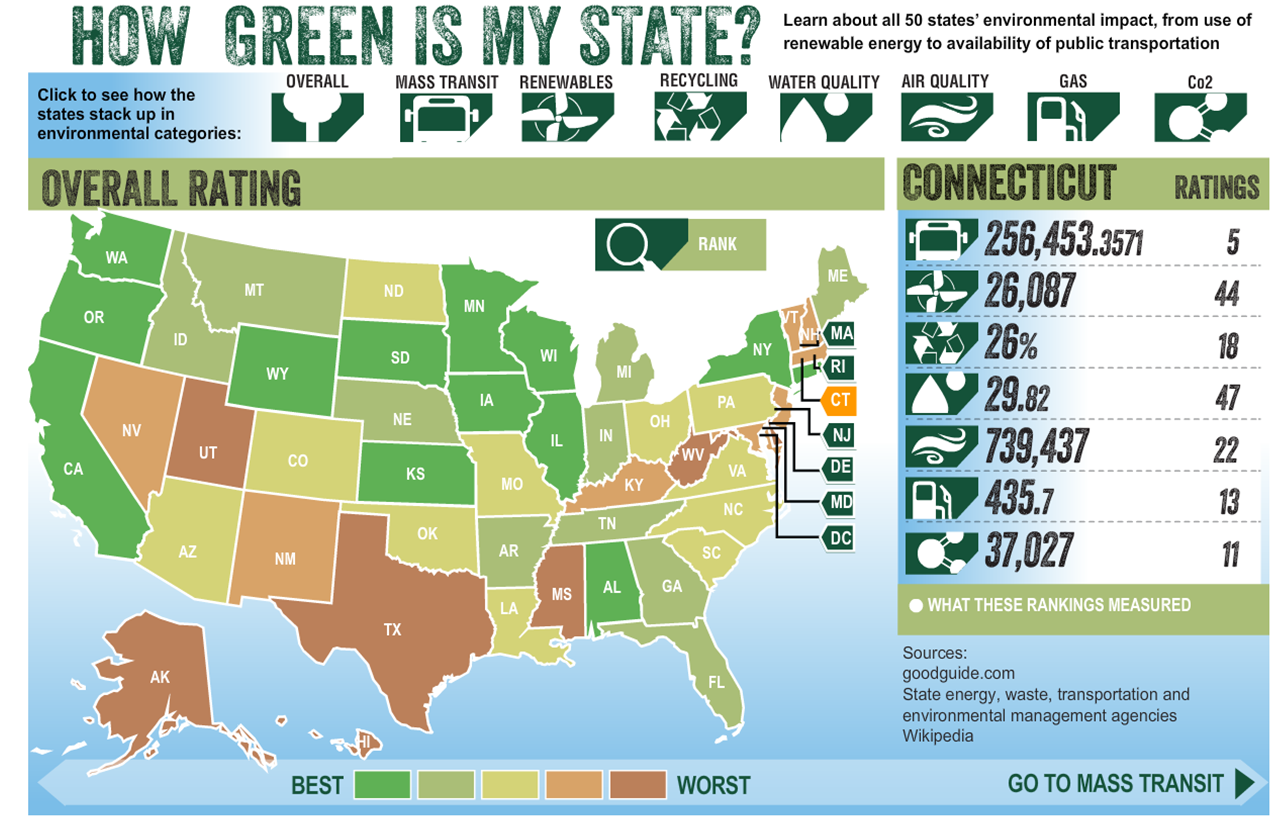
According to the report, it is more common for people to work from home in New England and the entire West, except Nevada. One reason for differences may be the industrial make up of states, since working from home is more feasible in some types of work than others. The following figure bears out the ambiguous relationship between working from home and the volume of driving.

 ConnPIRG Education Fund, a 501(c)(3) organization, works to protect consumers and promote good government. ConnPIRG Education Fund offers an independent voice that works on behalf of the public interest, investigating problems, crafting solutions, educating the public, and offering meaningful opportunities for civic participation.

The new ConnPIRG analysis and report found that after sixty years of almost constant increases iworking from home map
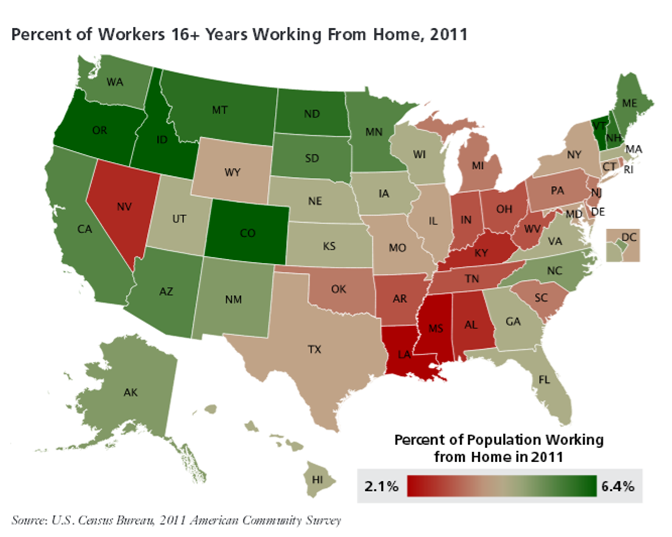
n the annual number of miles Americans drive, since 2004 Americans have decreased their driving per-capita for eight consecutive years. Driving miles per person are down especially sharply among Millennials, America’s largest generation that will increasingly dominate national transportation trends.

The website Global Workplace Analytics reports that regular telecommuting grew by 73% between 2005 and 2011 compared to only 4.3% growth of the overall workforce (not including the self-employed). Growth within different sectors of the workforce varied widely:

  • Federal employees - 424% growth
  • State government employees - 114% growth
  • Not-for-profit employees - 85% growth
  • For profit employees - 63%
  • Local government employees - 67%

While many conjectured that telecommuting would decline during the recession, it actually grew by 11.4% from 2008 to 2011.   Based on current trends, with no growth acceleration, regular telecommuters will total 4.9 million by 2016, a 69% increase from the current level, according to Global Workplace Analytics, which conducts independent research and consult on emerging workplace issues and opportunities.

CT is Among Leaders in Long Marriages, Less Popular for Divorcees

It seems that Connecticut is a great place for a long marriage and those who have never been married, and not so popular for divorced individuals.  Data indicate that Connecticut ranks #12 in longest married residents, #14 in never-married residents, #32 in currently married residents and #33 in divorced residents –as a percentage of population, comparing the 50 states and Washington, D.C.

Bloomberg Visual Data ranked the U.S. states and the District of Columbia based on the median duration of current marriages in years which was calculated by averaging the medians for males and females for each state, using the 2011 U.S. Census American Community Survey data.marraige stats

The top ten states for longest marriages, based on the median duration of current marriages in years, were South Dakota (23.1 years), West Virginia (23.0), Maine (22.8) , North Dakota, Pennsylvania and Vermont (22.4), Iowa (22.1) Montana, Wisconsin(21.8), Nebraska (21.7) and Delaware 21.5).  Tied with Connecticut at #12 is Michigan, at 21.4 years.

In every state in the nation, at least a quarter of residents ages 15 and older have never married.  Far outdistancing the field is the District of Columbia, where 58 percent have never married – the only instance where that number exceeds half the population.  Next highest is New York, with 37.7 percent, followed by California, Massachusetts, Rhode Island, Maryland, Illinois, Louisiana, New Jersey Mississippi, Delaware, Pennsylvania, Georgia.  Connecticut is next, with a third of the population – 33.1 percent – never having been married.Wedding_rings

When comparing the estimated percentage of those currently married, Connecticut ranks at #32, with 48.4 percent.  Topping the list is Utah with 56.2 percent, Idaho at 55.5 percent and New Hampshire at 53.6 percent.

New Jersey and New York have the lowest percentage of divorced people in the U.S., at #49 and #50 respectively in the estimated percentage of divorced residents.  Connecticut ranked at #33, with 10.7 percent of the population (age 15+) being divorced.  The most divorced residents?  Nevada at 14 percent, followed by Maine at 13.7 percent and Arkansas and New Mexico, tied at 13.4 percent.

New Audio Service To Help Students Challenged by Reading; Innovative Pilot is First in Nation

As students across the state return to begin a new academic year, the Connecticut Radio Information System (CRIS) is launching a first-of-its-kind service for schools, providing instant access to audio versions of educational materials, the Common Core State Standard text exemplars, and children’s magazines on any mobile device, including tablets, smartphones, and MP3 players, or computers with Internet access.

CRISKids™ For Schools is geared for students who are visually impaired or are print-challenged for any reason including a learning, physical, intellectual or emotional disability. The new service also provides custom recordings to fit the needs of the students.cris-logo

Nearly a dozen schools have signed up to participate in the pilot of CRISKids For Schools.  Student outcomes will be submitted for evaluation by the U.S. Department of Education.  CRISKids For Schools is the only extensive line-up of audio versions of children’s magazines, educational materials and the Common Core State Standards featuring human narration in the nation.

Early results of the new initiative have been impressive, officials say, noting that teachers report that students participating in the CRISKids pilot are reading and enjoying it more. Megan O’Brien, a Grade 5 teacher at Clover Street School in Windsor, has noticed a transformation with her reluctant Grade 5 readers since using MP3 players downloaded with CRISKids.

“They think it’saudio board awesome,” she said, noting that the students are far more motivated to read now with the help of CRISKids.

Support for CRISKids for Schools comes from the generous funding of several foundations, including Help for the Blind of Eastern Connecticut, Fund for Greater Hartford, The Gibney Family Foundation, and the Hartford Foundation for Public Giving.

The Connecticut Radio Information System is Connecticut's only radio reading service, and is registered with the state of Connecticut as a private, nonprofit 501(c)(3) charitable organization. CRIS broadcasts 24 hours a day, 7 days a week, from a broadcast center in Windsor, and regional satellite studios in Danbury, Norwich, Trumbull, and West Haven.

The programs broadcast on CRIS Radio are available to individuals who, because of vision loss, learning disability or physical handicap, are unable to read printed material.   CRIS Radio's live programming is provided free of charge and is available on specially tuned radios (provided free), cable providers, your telephone and online.  In addition, in recent years CRIS has become available on an iPhone, iPad/tablet, Internet radio or downloaded onto an iPod/MP3 player.

Earlier this year, the organization launched CRISKids™ Magazines, which provides audio versions of more than a dozen children’s magazines, and brought the initiative directly to children’s hospital beds.  In another first-in-the-nation initiative, Connecticut Children’s Medical Center teamed with CRIS Radio to offer the audio service to their patients  unable to turn the pages of magazines due to their medical condition or while receiving treatment.

Connecticut Ranks #4 in Back-to-School Stores

With students now settling into their classrooms and the hectic back-to-school shopping mostly in the rear view mirror, we learn that Connecticut ranks #4 among the nation’s states in the number of back-to-school retail stores per square mile.

The Land of Steady Habits is outpaced only by New Jersey, Rhode Island and Massachusetts as retail meccas for pre-school year shoppers, just ahead of Maryland, Delaware, New York and Florida.

Connecticut has 3,477 back-to-school retailers, for an average per square mile of .718, according to a Bloomberg Visual Data using NAICS data.  The data defines an establishment is a single physical location at which business is conducted. Retail totals were only for establishments identified in the following NAICS sectors and subsectors: electronics and appliance stor4es; clothing and clothing accessory stores; sporting goods stores; hobby, toy and game stores; musical instrument and supplies stores; bookstores; general merchandise stores; and office supply and stationery stores.

Alaska and Wyoming had the smallest number of retailers, at 661 and 678 respectively, as well as the smallest number per square mile. (Alaska was .001)

Connecticut’s annual tax-free week for clothing and footwear under $300 was conducted Aug. 18 through Aug. 24 at stores across the state, just prior to the start of the school year in most communities. On average, it is estimated that families spend nearly $700 on back to school purchases. The state expects to lose about $7 million to $8 million in revenue from the week of tax-free shopping.

According to the National Retail Federation projections prior to the back-to-school shopping season, the biggest portion of back-to-school shoppers’ budgets will go toward new apparel and accessories: 95.3 percent of those with school-age children will spend an average of $230.85 on fall sweaters, denim and other chic pieces of attire. Additionally, families will spend on shoes ($114.39) and school supplies ($90.49). Fewer families with children in grades K-12 will purchase electronics (55.7%), and those that are going to invest in a new tablet or smartphone are going to spend slightly less than last year.

back to school

“Hometown” Banks Continue to Locate Away From Home

Apparently hometown pride and banking are mutually exclusive – or at least travel well.  The volume of banks bearing a community’s name that are opening branches far, far away from home continues to grow, which suggests that banks have clear and convincing evidence that the distant moniker just isn’t an issue for consumers.

The latest: Vernon-based Rockville Bank is asking state approval to open a Hamden branch, its first retail incursion into New Haven County, the Hartford Business Journal hasbank-vault reported.  The bank is planning to establish a 2,000-square-foot, full-service retail branch near the commercial- and residential-loan production office the bank opened in July 2011.  Earlier this year Rockville Bank crossed the Connecticut River to open a high profile branch in thriving West Hartford Center.

Connecticut by the Numbers has previously reported on the increasing number of banks with the name of a Connecticut town within the bank’s name that have opened branches – and many of them – in other towns.  An increasing number are opening in towns far afield, and last month, Massachusetts-based Westfield Bank opened a branch in Granby, CT.

Already, the list of town names doing double-duty as bank names is lengthy, with the institutions numbering two dozen:  Fairfield, New Canaan, Groton, Darien, Essex, Farmington, Greenwich, Suffield, Guilford, Jewett City, Litchfield, Milford, Naugatuck, Putnam, Rockville, Salisbury, Danbury, Simsbury, Stafford, Thomaston, Torrington, Wilton and Windsor.  And those are only the Connecticut towns, of course.

Among the town-line-jumping trendsetters:  Farmington Bank in South Windsor, Essex Savings Bank in Madison,  Jewett City Savings Bank (“your hometown bank”) in Brooklyn, Simsbury Bank in Bloomfield, and the Savings Bank of Danbury in Waterbury.  There are many more.

Although there are 25 out-of-state banks connecticutwith a presence in Connecticut, only Rhode Island-based Newport Federal Savings Bank, with an office in Stonington, included the name of a town – until the arrival of Westfield Bank.  Other well-known names, evoking out-of-state regions, include Bank of New York, Berkshire Bank (which is now in the process of purchasing 20 Bank of America branches in New York State), First Niagra Bank, and Hudson Valley Bank.

To look back at the CT by the Numbers hometown bank story, click here:

http://ctbythenumbers.info/2013/04/17/hometown-names-go-beyond-hometown-for-connecticut-banks/

To review the list of banking institutions in Connecticut, see the state Department of Banking list:

http://www.ct.gov/dob/cwp/view.asp?a=2228&q=296954

Connecticut's Green Report Card: Needs Improvement

Connecticut’s state government received mixed grades in the new edition of the Connecticut Green Guide, published by Hartford Business Journal.  The publication reviewed state policy in our areas – microgrids, gasoline taxes, wind turbines and greenhouse gas reduction efforts – and graded the state’s efforts.

Connecticut received an “A” for recently announcing an $18 million grant program with nine microgrid projects in eight Connecticut communities, “adding protection from power outages and moving away from a centralized electriciMalloy aParkvillety system.”  Just a week ago, Gov. Malloy was joined by the White House Chair of the Council on Environmental Quality to highlight one of the state’s microgrid sites, in the Parkville neighborhood of Hartford.

The state received an “F” because of a moratorium on wind turbines, which has been in place since 2001, according to the Green Guide.  “Because of poorly written legislation and prolonged bureaucracy,” the publication explained, several projects have been delayed.  Another poor grade, a D+, was assigned because state taxes on gasoline rose 4 cents on July 1, “giving Connecticut the third highest taxes on motor vehicle fuel in the country.”  The publication noted that while “higher prices might egreen guilde logoncourage conservation, very little of the tax revenue goes toward fixing the aging transportation system, leading to vehicle inefficiencies and congestion.”

Connecticut fared better. earning a B+, in the analysis of the state’s participation in the Regional Greenhouse Gas Initiative, along with the other eight states in the region, which will “further lower the cap on power plant pollution,” which should, according to the publica50 statestion’s review, “make the air cleaner, and the proceeds will aid the clean energy industry.”

The publication also noted that Connecticut became the first state in the country to mandate mattress recycling, with a new law approved by the legislature this year, also adding a new paint recycling requirement to existing laws that call for recycling of electronic waste and mercury thermostats.  The state’s move toward a greater emphasis on “product stewardship,” is characterized by an increasing obligation imposed on consumers to recycle designated products, which helps the environment and provides business opportunities in the recycling of those products.

In a report on the green initiatives across all 50 states, published by Forbes magazine in July, Connecticut excelled in the areas of mass transit, ranking 5th among the states, in CO2 controls, ranking 11th, and recycling, ranking 18th.  The state was 44th in use of renewables and 47th in water quality.  That's according to this recent green ranking of states from MPHOline.org, a website that provides information on a variety of public health topics.

Data from the green product rating site GoodGuide was used to assess air and water quality, information from Wikipedia was the basis of the comparison on the number of mass transit systems in each state, and state agencies were used to provide information on the other categories.

Time Short to Nominate State’s Top Librarians; CT Seeks Another Stand-out Year

Nominations for the 2013 Carnegie Corporation of New York/New York Times I Love My Librarian Awards are open through September 6.  For Connecticut librarians, last year’s success will be tough to top.

The I Love My Librarian Award encourages library users to recognize the accomplishments of exceptional public, school, college, community college, or university liblove my librarianrarians. It is a collaborative program of Carnegie Corporation of New York, The New York Times and the American Library Association.

Ten librarians in 2012 – including two from Connecticut - received a $5,000 cash award, a plaque and $500 travel stipend to attend an awards reception hosted by The New York Times. A plaque was also given to each award winner’s library.

Rachel Hyland, a reference and collection development librarian at Tunxis Community College in Farmington, and Rae Anne Locke, library/media specialist at the Saugatuck Elementary “Secret Garden” Library in Westport, were two of the 10 recipients a year ago.  The others worked at libraries in New Mexico, California, North Carolina, New York and Florida.

In order to be eligible, each nominee must be a librarian with a master’s degree from a program accredited by the ALA in library and information studies or a master’s degree with a specialty in school library media from an educational unit accredited by the National Council for the Accreditation of Teacher Education.

rachel-hyland135rae-anne-locke135Nominees must be currently working in the United States in a public library, a library at an accredited two- or four-year college or university or at an accredited K-12 school.

Hyland (left), nominated by Sally Terrell, is described as “a rock-star librarian.  The intelligence, wit, energy she brings to her work has changed the way all of us – from students to faculty to administrators – think about information literacy.”  Locke (right) , nominated by Melissa Augari, has “poured her heart and soul into planning, creating and growing the SES Secret Garden Library, a vibrant, warm and inviting place that is much more than a school library. It is truly the learning hub for our entire school community.” Her collaborative projects “often reach out beyond the school community” and one student said simply, “it’s magical.”

In order to nominate a librarian, five questions must be answered on the contest’s website:

  • What sets him/her apart?
  • Please list a few ways in which the nominee has helped you and made your experience of the library a positive one. For instance, did the nominee inspire in you a love for literature; assist you in a project or finding other information?
  • How has the librarian made a difference in the community?
  • How has the library, and the nominee, improved the quality of your life?
  • How does the nominee make the library a better place?

More information is available at www.ilovelibraries.org. Nominations must be submitted using the online form, and submitted in their entirety.


love librarians

Cost of Raising A Child Is Highest in Northeast U.S., Including CT

The cost of raising a child:  priceless.  Well, no, there is a price-tag.  The U.S. Department of Agriculture (USDA) released its annual report, Expenditures on Children by Families, which shows that a middle-income family with a child born in 2012 can expect to spend about $241,080 ($301,970 adjusted for projected inflation*) for food, shelter, and other necessities associated with child-rearing expenses over the next 17 years.

There was an overall 2.6 percent increase from 2011.  Expenses for child care, education, health care, and clothing saw the largest percentage increases related to child rearing from 2011. However, there were smaller increases in housing, food, transportation, and miscellaneous expenses during the same period. The 2.6 percent increase from 2011 to 2012 is also lower than the average annual increase of 4.4 percent since 1960.

The report notes geographic variations in the cost of raising a child, with expenses the highest for families living in the urban Northeast  - the 9-state northeast region, which includes Connecticut, Maine, Massachusetts, New Hampshire, New Jersey, New York, Pennsylvania, Rhode Island, and Vermont -followed by the urban West and urban Midwest. Families living in the urban South and rural areas have the lowest child-rearing expenses.report child expense

The report, issued annually, is based on data from the Federal government's Consumer Expenditure Survey, the most comprehensive source of information available on household expenditures. There is also  an interactive web version of the report where individuals can easily enter the number and ages of their children to obtain an estimate of costs through age 17.

Housing accounted for the largest share of total child-rearing expenses. For the middle and highest income groups (for households with the expense), child care and education was the second largest expenditure on a child, accounting for 18 and 23 percent of child-rearing expenses, respectively. For the lowest income group, child care and education accounted for 14 percent of total child-rearing expenses (again, for households with the expense). For lower income families, child care may be provided by relatives or friends at no cost due to affordability issues, the report pointed out.

Expenses per child decrease as a family has more children. Families with three or more children spend 22 percent less per child than families with two chchild expensesildren. As families have more children, the children can share bedrooms, clothing and toys can be handed down to younger children, food can be purchased in larger and more economical quantities, and private schools or child care centers may offer sibling discounts.

Among the largest potential costs in child-rearing is the cost of a college education, which was not included in this study, which only included direct parent expenses through age 17. The College Board estimated that in 2012-2013, annual average (enrollment-weighted) tuition and fees were $8,655 at 4-year public colleges (in-State tuition) and $29,056 at 4-year private (non-profit) colleges; annual room and board was $9,205 at 4-year public colleges and $10,462 at 4-year private colleges. For 2-year colleges in 2012-2013, annual average tuition and fees were $3,131 at public colleges. These college costs may be offset by financial aid.

The report concluded, as only a government report could, by stating: “The direct and indirect costs of raising children are considerable, absorbing a major share of the household budget. On the other hand, these costs may be outweighed by the benefits of children.”

The full report is available on the web at www.cnpp.usda.gov. A video highlighting the report is at http://www.youtube.com/watch?v=Di14Y3kTbHE

Mathematics and Transportation of Cities Draws New Research Analysis

UConn researchers have collaborated to develop a new index that will measure the sustainability of complex urban transportation systems.  The index will allow policymakers, scientists and the public to understand not just how congested cities’ transportation systems are, but the economic, social, and environmental impacts of the system as a whole.

A team of researchers in UConn’s departments of geography and civil and environmental engineering developed The Transportation Index for Sustainable Places, or TISP.  The new approach is part of the July themed issue of the journal Research in Transportation Business & Management, edited by  Carol Atkinson-Palombo, assistant professor of geography, Norman Garrick, associate professor of civil and environmental engineering, and Wesley Marshall, a former graduate student of Garrick’s who is now a faculty member at the University of Colorado, Denver. TISP

“Policy in developed countries and in the U.S. in particular has tended to focus on relieving congestion and has largely ignored social and environmental impacts associated with expanding freeways,” says Carol Atkinson-Palombo. “This index takes a more holistic approach, which gives a comprehensive sense of the effects of the system.”

The TISP takes into account environmental factors like land use efficiency, minimizing natural resource consumption, and reducing greenhouse gas emissions. Social factors are also measured, such as meeting access needs, incorporating public health and safety and maintaining a community in areas served by transportation. These factors combine with economic measures, such as affordability, self-sufficiency, and efficiency, to create a comprehensive metric, UConn Today reported.

Garrick says that many people only think about transportation in terms of traffic. These so-called congestion indices, he says, are misleading because they are not necessarily about making the city better, but simply moving cars more efficiently.

“In many cities, only 40 percenNewHavenRoute34aftert of the people commuting are in cars,” he points out. “The majority of the people aren’t affected by the congestion index, yet this is the only measure of the impact of the transportation system that is ever discussed in the media.”

Mathematics of Cities

In another initiative aimed at taking a closer look at the function of cities, the view that cities are dissimilar and disordered systems has begun to change.  Patterns have emerged within the supposed chaos, and researchers in economics, physics, complexity theory and statistical mechanics have concluded that cities, mathematically speaking, might actually be basically the same. Though strikingly different in culture and layout, cities like London and Beijing, for example, share many properties with regard to infrastructure, social interactions and productivity.

The new conclusions – decades in the making - are part of a growing field dedicated to the science of cities, Science News, the magazine of the Society for Science & The Public, reports in its most recent edition.   Roughly 75 percent of people in the developed world now live in urban environments. While much of the research is in its early days, eventually it may serve as a powerful, widely used tool for urban planners and policymakers, the publication reports.

Physicist and complex systems scientist Luís Bettencourt of the Santa Fe Institute in New Mexico has developed a theory which captures the interplay between a city’s population, its area, the properties of its infrastructure and its social connectivity. His theory suggests that city planning should not involve grand, top-down projects, but perhaps well-considered smaller ones.

The mathematical work is rooted in and reinforces the view “that cities grow from the bottom up,” says Michael Batty, who trained as an architect, planner and geographer and went on to found the Centre for Advanced Spatial Analysis at University College London. “The diversity of life [in cities] offers greater opportunities for mixing ideas.”

The emerging mathematical theory of cities stands on four basic assumptions:

  1. Cities mix varied people together, allowing them to reach each other.
  2. Cities are networks that grow gradually and incrementally, connecting people.
  3. Human effort isn’t limitless and stays the same regardless of urban size.
  4.   Measures of the socioeconomic output of a city — things like the number of patents awarded or crime rate — are proportional to the number of social interactions.

 “In a nutshell, the city is the best way of creating a vast, open-ended social network that minimizes the cost of moving things in and around an environment,” Bettencourt says. “When people brush up against each other, that’s when the magic of the city happens — the social reactor begins to work.”

Cities Reshape Transportation Mix

At UConn, when the research team used the TISP index to look at transportation in the U.S., they found some not-so-surprising results: areas with higher rates of driving rather than public transportation have greater carbon emissions, and having more cars and highways increases traffic fatality risk.  But despite the prevailing perception, says Garceau, the researchers found that decityveloping varied transportation systems that include a combination of roads and public transportation are more cost-effective than simply building highways.

Many cities have already begun to adjust their transportation planning. Some have begun dismantling freeways that run through their downtowns to reconstruct a truly urban atmosphere. New Haven is in the midst of doing precisely that in Connecticut, eliminating the Route 34 connector and replacing it with an urban boulevard that will reconnect city neighborhoods cut off for decades.

Others cities are moving forward with light rail and bus rapid transit systems (such as CTfastrak between Hartford and New Britain, now under construction) and encouraging walking and bicycle use by building compact, mixed-use communities that focus on pedestrians rather than cars.  Garrick points to Cambridge, Mass., Portland, Ore., and New York City as U.S. cities that have taken strides toward sustainable transportation. On a smaller scale, he cites Storrs, the home of UConn’s main campus, for developing a walkable town center from scratch, and planning for greater bus access as the newly-minted downtown area unfolds.

Need a Job? Study Says Volunteering First Can Help

If you are unemployed, it pays to volunteer.  That is the finding of a new analysis by the Center for Economic and Policy Research, tracking individuals out of work who chose to volunteer, and the impact it had on their search for employment.

The report, “Does It Pay to Volunteer: The Relationship Between Volunteer Work and Paid Work,”  estimates non-working individuals’ probability of being employed a year later if they volunteered during the 12-month period. Pooling three years of data from the Current Population Survey (CPS) Volunteer Supplement covering the period ending in September of 2011, the analysis found a positive volunteer effect on the probability of employment for persons who were not employed and volunteered for more than 20 hours per year.

For example, the employment rate for non-working persons who volunteered between 20 and 49 hours per year was 57 percent higher than the rate of non-voluntewhere people volunteerers. And controlling for personal characteristics such as age, gender and ethnicity, there was a substantial increase (6.8 percentage points) in the probability of employment for persons who volunteered between 20 and 99 hours per year.

In Connecticut, among the many ways to volunteer - most with local community-based organizations - the United Way has developed a web site, www.volunteerConnecticut.org , to match interested individuals with volunteer opportunities.  The Connecticut Association of Nonprofits, at www.ctnonprofits.org, also has a website devoted to volunteering.

The latest statewide data for Connecticut, complied by the Corporation for National & Community Service using 2011 data, indicates that volunteerism is considerable across the state:

  • 28.5% of residents volunteer, ranking them 22nd among the 50 states & Washington, DC.
  • 29.3 volunteer hours per resident.
  • 72.8% do favors for their neighbors.
  • 793,710 volunteers.
  • 81.7 million hours of service.
  • $1.8 billion of service contributed.

In the survey, many volunteers did not volunteer in the professional field in which they were seeking employment. This suggests that even without accumulating the relevant human capital for the fields in which they were seeking employment, volunteering may have signaled to prospective employers that the applicant possessed desirable qualities such as motivation, creativity and reliability.

Thus, volunteering could be particularly useful for job applicants with little prior experience such as recent college graduates or persons attempting to re-enter the labor market after a period of joblessness. The data did not indicate that volunteering has a significant impact on wage growth of the typicheaderal person.

For purposes of the survey, a volunteer was defined as person who performed unpaid volunteer activities over the previous 12 months through or for an association, society or group of people who share a common interest.  Volunteering in an informal manner, such as helping an elderly neighbor is not included in the survey. Unpaid work, including internships for for-profit employers, is also not considered volunteer work, while some other types of unpaid internships may be included, if the person considered it volunteering rather than work.