Spring Flu Hits Connecticut and Northeast Harder than Rest of USA

Not only does winter refuse to quit in Connecticut, the flu season is also slow to recede, with a second wave hitting the region this month.  According to data monitored by the state Department of Public Health, Connecticut is one of only a handful of states where flu cases have remained widespread well into April.

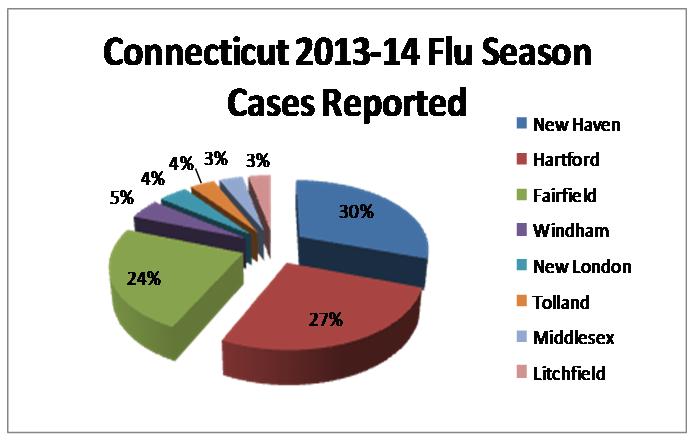
Overall, more than 5,000 cases of various strains of flu have been reported in Connecticut since the start of flu season last fall, with the largest number coming in New Haven County, followed by Hartford and Fairfield Counties.

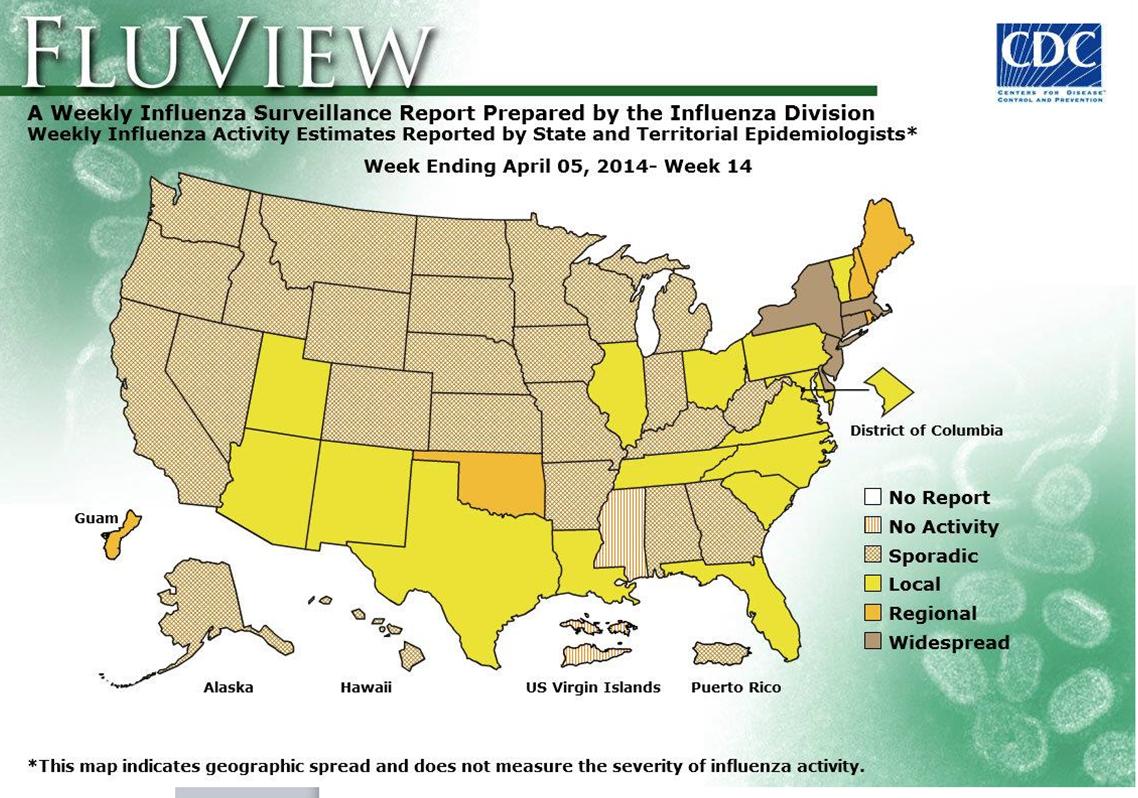
The latest “Flu View” map from the national Centers for Disease Control and Prevention (CDC) indicate while flu season appears to have ended across most of the nation, Connecticut is one of less than a half-dozen states that continue to have “widespread” influenza activity.
flu CTConnecticut is joined by regional neighbors New York, Massachusetts, New Jersey and Delaware in the recent spike in flu cases.  New York has recently been reporting its highest volumes of the entire flu season.  The states of Maine, New Hampshire, Rhode Island and Oklahoma have the next highest level of flu cases, according to the CDC data.

The most recent data, for the week ending April 5, indicates that statewide emergency department visits attributed to the “fever/flu syndrome” have recently increased in Connecticut and continue at a level near or above 5 percent statewide during the last 16 weeks.  The CDC reports that the region including Connecticut, Maine, Massachusetts, New Hampshire Vermont and Rhode Island is one of only two in the nation with “elevated” out-patient flu levels as of early April; the other region with elevated levels includes New York and New Jersey.  The rest of the nation is characterized as being at “normal” levels of flu incidence.
flu view

A total of 5,162 positive influenza reports have been reported for the current season, which is due to conclude, for data collection purposes, next month.  The initial peak in January brought record emergency volumes to some facilities, including Hartford Hospital.  This year’s second wave, is occurring later than a year ago, into April.  Last year's second wave occurred in March.

Influenza has been reported in all eight Connecticut counties since the start of flu season: New Haven (1,559 reports), Hartford (1,384), Fairfield (1,221), Windham (242), New London (220), Tolland (186), Middlesex (179), and Litchfield (171).

This month, Connecticut influenza activity continues to be classified geographically as “widespread” according to the state Department of Health, and many regions in the state are experiencing a second wave of flu activity, led by the influenza B strain, often referred to as “spring flu.”

In Connecticut, the Department of Public Health (DPH) uses multiple systems to monitor circulating influenza viruses. During the influenza season, weekly flu updates are posted from October of the current year, through May of the following year.

Last winter’s flu season brought 57 flu-related deaths to Connecticut, all were among patients at least 55 years of age including 48 (84%) who were greater than 65 years old. The year-long stats, reflecting August 2012 – August 2013, reflected flu instances from residents of all eight Connecticut counties and included: 4,177 from Fairfield County, 2,789 from New Haven County, 1,915 from Hartford County, 672 in Windham, 638 New London, 613 Middlesex, 388 Litchfield, and 319 from Tolland County.  Last year’s total was 11,511 confirmed flu cases, with the number of cases peaking twice, in the week ending Jan. 12, predominantly Type A flu, and the week ending March 23, predominantly Type B.

All data for the current flu season are considered preliminary and are updated with available information each week starting in October and ending in May; a final report will be available from DPH before the start of the next season.


Signatures Sought: Libraries Make A Stand At State Capitol

The Connecticut Library Association, working in conjunction with the Connecticut State Library and the Connecticut Library Consortium, will mark National Library Week at the State Capitol on Wednesday, April 16.  They will be “bringing the Declaration for the Right to Libraries to life by visually illustrating its ten principles” – and looking for indiviuals to sign the declaration, which is part of a year-long initiative of the American Library Association.

The effort in Connecticut is aimed at legislators, other elected officials, and visitors who walk the Capitol’s concourse – offering displays of “powerful, living examples of the work that is currently taking place declaration-402x600in Connecticut libraries and why it is so important that they continue to support our institutions,” officials said.

The Declaration states that “In the spirit of the United States Declaration of Independence and the Universal Declaration of Human Rights, we believe that libraries are essential to a democratic society.”

The ten principles include:

  1. Libraries Empower the Individual -  Whether developing skills to succeed in school, looking for a job, exploring possible careers, having a baby, or planning retirement, people of all ages turn to libraries for instruction, support, and access to computers and other resources to help them lead better lives.
  2. Libraries Support Literacy and Lifelong Learning - Many children and adults learn to read at their school and public libraries via story times, research projects, summer reading, tutoring and other opportunities. Others come to the library to learn the technology and information skills that help them answer their questions, discover new interests, and share their ideas with others.
  3. Libraries Strengthen Families -  Families find a comfortable, welcoming space and a wealth of resources to help them learn, grow and play together.
  4. Libraries are the Great Equalizer - Libraries serve people of every age, education level, income level, ethnicity and physical ability. For many people, libraries provide resources that they could not otherwise afford – resources they need to live, learn, work and govern.
  5. Libraries Build Communities - Libraries bring people together, both in person and online, to have conversations and to learn from and help each other. Libraries provide support for seniors, immigrants and others with special needs.
  6. Libraries Protect Our Right to Know -  Our right to read, seek information, and speak freely must not be taken for granted. Libraries and librarians actively defend this most basic freedom as guaranteed by the First Amendment.
  7. Libraries Strengthen Our Nation - The economic health and successful governance of our nation depend on people who are literate and informed. School, public, academic, and special libraries support this basic right.
  8. Libraries Advance Research and Scholarship -  Knowledge grows from knowledge. Whether doing a school assignment, seeking a cure for cancer, pursuing an academic degree, or developing a more fuel efficient engine, scholars and researchers of all ages depend on the knowledge and expertise that libraries and librarians offer.
  9. Libraries Help Us to Better Understand Each Other -   People from all walks of life come together at libraries to discuss issues of common concern. Libraries provide programs, collections, and meeting spaces to help us share and learn from our differences.
  10. Libraries Preserve Our Nation’s Cultural Heritage - The past is key to our future.  Libraries collect, digitize, and preserve original and unique historical documents that help us to better understand our past, present and future.connecticut.library.association

Based in Middletown, the Connecticut Library Association is Connecticut's 1,000 member strong professional organization of librarians, library staff, friends, and trustees working together to improve library service, advance the interests of librarians, library staff, and librarianship, and increase public awareness of libraries and library services.

There are 165 “principal” public libraries in Connecticut’s 169 towns (four towns are served by libraries in neighboring towns), as well as 27 additional libraries and 47 branch libraries in communities across the state.  A list of public libraries in Connecticut is available at http://www.ctstatelibrary.org/dld/files/community/connecticut-public-librar

Pilot Project Boosts Voter Engagement in Latino Community

It turns out, all that was necessary to improve voter engagement and turnout was asking – and repeated, substantive, and informative reminders.  The results of a pilot study in Hartford’s Latino community may provide critical insight into how to improve voting levels in the state’s ethnic or urban communities, as the next election season beckons.

In 2012-13, the Hartford Votes~Hartford Vota Coalition conducted a Latino Voter Engagement Initiative with the support of a grant obtained by Hartford Public Library, a founding member of the Coalition.  The goal of the initiative was to increase historically low voter engagement in Hartford’s Latino community.  It did.

The initiative includevoted traditional voter registration activities, but because voter registration by itself tends not to result in higher voter engagement, additional activities were also included in the initiative.  Among them:  candidate forums, public programs on relevant topics, production and distribution of publications such as voter guides, canvassing portions of Hartford neighborhoods, conducting a reminder to vote campaign, and civics classes in Hartford high schools.

In addition, a number of meetings were held with leaders and others from Hartford’s Latino community.  None of the conversations or interactions were partisan.  They focused exclusively on the electoral process, the importance of exercising the right to vote, and providing basic information about public issues.  The results of the initiative were impressive:

  • Voter Registration:  392 Hartford Latinos were registered to vote.
  • Voter Information: 174 Hartford Latinos attended three candidate forums and two public programs.  Three publications were produced (Hartford Voters Guide, Citizens Guide, and Guide to the Hartford Board of Education) in English and Spanish and over 4,000 copies were distributed.
  • Voter Education: 124 Hartford Latinos participated in the neighborhood canvass; 172 Hartford Latino high school students attended civics classes.

According to a sample survey conducted at the end of the project, 44 percent of Hartford Latinos with whom program organizers interacted reported an increase in their voter engagement.  For example, they registered to vote, they voted, or they attended a candidate forum or public program related to major public issues during the project period.

Project organizers concluded that “we identified and demonstrated a successful strategy that can help address the very complex problem of low voter engagement (among Latinos 1_Percentage_Increaseand others):  people vote and get involved in greater numbers when they are encouraged to do so through face-to-face contact, and multiple contacts are more effective than single contacts.”
The neighborhood canvass produced especially notable results:

  • 54 percent of Latinos who were inactive voters (i.e., they had never voted before or were registered but had not voted in the 2008 and/or the 2010 elections) who participated in the neighborhood canvass reported that they voted in 2012 as a result of the interaction.
  • 64 percent of all Latinos who participated in the neighborhood canvass reported that they voted in 2012 as a result of the interaction.
  • Those who were spoken with twice voted at a rate 21 percent higher than those that only had one interaction
  • 2012 voter turnout among all people included in the neighborhood canvass was 9.1 percent higher than overall turnout in voting districts in which an informational canvass was conducted, and 6.7 percent higher than turnout citywide.

 In addition, thirteen high school civics classes were conducted in four different Hartford schools in May and June 2013, which were attended by 172 Latino students. According to evaluation forms completed by most of the students, 91 percent said the class helped them understand more about civics and 82 percent said they were more likely to vote or take action in their community as a result of having taken the class.  Comments ranged from “I made my voice heard through my vote” to “I didn’t do it for politics but because people motivated me.”

 The Hartford experience has been corroborated by similar research in Detroit and Arizona, according to project organizers.  The Coalition’s goal in 2014 is to secure resources that will enable it to ramp up the successful strategies identified through the pilot project and as a result have greater impact.

“Through these strategies,” they suggest, “we can play a significant role in reducing the effects of low voter engagement, which is a major threat to our democracy.”

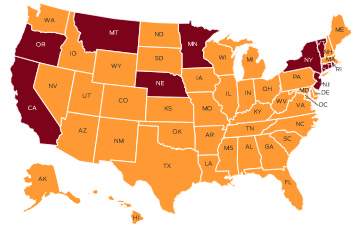
Connecticut Ranks Third Among Least Tax-Friendly for Retirees

“The Constitution State is a tax nightmare for many retirees.” That is the thumbnail summary for Connecticut, which ranked third among the 10 Least Tax-Friendly States for Retirees, according to a list compiled by the business and personal finance publication Kiplinger’s.

Worst in the nation, according to the list, is Rhode Island, followed by Vermont, Connecticut, Minnesota and Montana.  The publication used data from state tax departments, Commerce Clearing House and the Tax Foundation to develop the rankings. “Some states offer attractive tax benefits to woo retirees,” the publication indicated. “Then there are these ten states that are stingy with retirement tax breaks.”

Kiplinger’s pointed out that “Conneticut’s “real estate taxes are the second-highest in the nation, according to the Tax Foundation.”  Rhode Island was described as “particularly tough on retirees,” and retirees in Vermont should “prepare to pay lofty taxes,” according to Kiplinger.

  1. Rhode Islandtax friendly map
  2. Vermont
  3. Connecticut
  4. Minnesota
  5. Montana
  6. Oregon
  7. Nebraska
  8. California
  9. New Jersey
  10. New York

“When you're living on a fixed income, every penny counts, which makes these states particularly unwelcoming for retirees,” the publication noted.  Most of the states tax at least a portion of Social Security benefits. Some also have higher-than-average income taxes. Others make up for low income and sales taxes with high property taxes. The survey also considered  estate and  inheritance taxes.

The tax friendliest state for retirees is Alaska, which has no income tax, no sales tax and no inheritance tax. Alaska is followed by Wyoming, Georgia and Arizona.

Connecticut’s high cost of living —  more than 30% higher than the national average, according to Sperling’s Best Places.  However, “high prices and taxes don’t deter retirees who like the scenery and who want to stay close to children, grandchildren and lifelong friends in the nearby metropolitan areas,” according to MarketWatch, a service of the Wall Street Journal, published this week.  The data compiled by Kiplinger’s Senior Associate Editor was first reported last summer.

Kiplinger is a Washington, D.C.-based publisher of business forecasts and personal finance advice, available in print, online, audio, video and software products.  The company’s best-known publications are The Kiplinger Letter, a weekly business and economic forecasting periodical for people in management, and the monthly Kiplinger's Personal Finance magazine.

International Migration Growth Keeping Population Numbers Steady

The Hartford region ranked third in the nation among metropolitan areas showing significant international migration amidst near-stagnant overall population change during the past three years.  The New Haven-Milford and Norwich-New London regions also ranked in the top 20 nationally among metro regions with less than one percent overall population growth but strong international migration.

The overall population change for the three metro areas in Connecticut were two-tenths of a percent population growth in the Hartford region, and virtually no change at all for New Haven and Norwich-New London region, each having zero percent population growth over the past three years.

The migration into the Hartford region from outside the U.S. during the three years was 16,251 people, behind only to Chicago and Detroit among the 20 metro areas where overall population change was at or near zero.  The New Haven metro area ranked 7th, with an international migration total of 10,717 and Norwich – New London was 19th, with 4,008.

During the past three years, the Norwicworld-map-background1h-New London region total population change reflected a net loss of 95 people, New Haven had a net loss of 187 people and Hartford region saw a slight increase of 2, 827 people.migration

The analysis of U.S. Census data by Governing magazine indicates that in some American cities, international migration far outpaced population gains from natural change (births and deaths) and domestic migration.  The three Connecticut metropolitan areas were among those that experienced little to no change in total population, but welcomed sizable tallies of residents from abroad.

The analysis indicated 20 metro areas across the country where total population change between 2010 and 2013 was at or near zero, while international migration was substantial – and made up, or nearly made up, for population declines to due domestic migration or natural factors. Among the other metro regions were Providence, St. Louis, Cleveland, Springfield, Pittsburgh, Rochester, Buffalo and Trenton.

Across the U.S. between 2010 and 2013, metro areas welcomed a net total of 2.6 million residents from international migration. Over the same three-year period, net domestic migration increased by just 382,000 as those who did move mostly relocated to other metro areas, the magazine reported.

The Census Bureau’s international migration estimates include not only foreign immigrants, but natives moving back home and movement of members of the military.

The country’s largest immigration hubs welcomed significant numbers of residents from abroad. Since 2010, the New York City-Newark metro area gained nearly 400,000 residents from other countries, followed by the Miami-Fort Lauderdale-West Palm Beach, Fla., area (+164,000) and the Los Angeles-Long Beach-Anaheim (+156,000) area.

According to the data, Hartford lost 18,917 people to domestic migration while it picked up 16,251 people through international migration, nearly off-setting the departing over the past three years.

University of New Haven Named a “Best for Vets” College

The University of New Haven (UNH) has been ranked among the nation’s best colleges for veterans.  The 2014 “Best for Vets Colleges” list, developed by Military Times, places New Haven among the top 80 institutions in the nation, ranking at number 59.  UNH is the only higher education institution from Connecticut to earn a place on the list.

In addition to ebfv-colleges-2014valuating schools’ veteran-focused operations, the publication considered more than a dozen different measures of academic success, quality and rigor, as reported by schools and the Education Department, to develop the rankings.

Representatives of about 600 schools responded to the Best for Vets: Colleges 2014 survey, comprising of 150 questions that delved into school operations in unprecedented detail, according to the publication.

The results indicated that many more schools are tracking the academic success of their military and veteran students — but the majority still do not.  Last year, fewer than 11 percent of school representatives responding to the survey said they track completion rates for current and former service members. This year, more than a third said they track similar academic success measures for such students, the publication’s website pointed out.660556

Military veterans of UNH (MVUNH) is a Student Group formed to both support current UNH Veteran student and encourage a UNH "Veteran friendly" campus to attract new Veteran students.  The university’s purpose is to create a community of veterans who will use their knowledge and experiences to educate the university community and advocate on behalf of student veterans.  Members meet once a month to discuss current events and provide new information.

The newly renovated and furnished Veterans Success Center on the UNH campus serves as common place for students to study, gather for MVUNH club meetings and relax.  The Center has four computers with access to printing, a microwave and refrigerator available to student veterans to use during breaks between classes.  The Veteran Success Center is heralded as a great place to meet fellow veterans and find out about veteran programming on campus and within the community.

In an effort to strengthen support for student veterans, Veteran Services and the University of New Haven have created a Student Veteran Emergency Fund.  Entirely dependent upon donations, the Student Veteran Emergency Fund has been established to assist student veterans who encounter an unforeseen financial emergency throughout the semester, including a delay iLove Your Country1n benefits, BAH and book stipends from the VA.
The University of New Haven is also a partner of the VA Connecticut Healthcare System, located in West Haven.  VITAL is a VA initiative aimed to support student veterans on campus in their successful transition to academia and in completion of their educational goals.  The University also participates in the Yellow Ribbon Program for veterans.

Playground Remembering Ana Grace Marquez-Greene Opens April 4 at Hartford’s Elizabeth Park

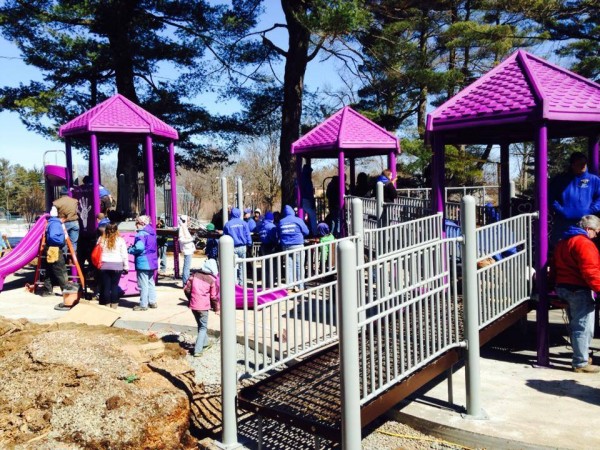
Early next month, Hartford will become the eighth Connecticut community to welcome a playground commemorating one of the children and educators killed at Sandy Hook Elementary School in Newtown on December 14, 2012. The Hartford playground, at Elizabeth Park, will commemorate Ana Grace Marquez-Greene, who was 6 years old. The official opening of the playground on Friday, April 4 will also commemorate her birthday.Bez-nazwy-4

New Jersey-based The Sandy Ground Project: Where Angels Play has been building the playground on the East Lawn of Elizabeth Park along the Hartford-West Hartford town line, with the help of volunteers from throughout the region.

The Sandy Ground Project was founded in the wake of the Newtown shootings and the devastation of Hurricane Sandy the month before. The idea was inspired by three playgrounds the New Jersey State Firefighters Mutual Benevolent Association, the organization behind the project, had built in Mississippi after Hurricane Katrina. The New Jersey firefighters plan to build 26 playgrounds across the tri-state area, each one dedicated to the memory of a Sandy Hook student or educator lost on that day.

Ana Grace’s parents, Jimmy Greene and Nelba Marquez, both graduated from the University of Hartford, and at a brief ceremony marking the beginning of construction on a cold wintery day just a few weeks ago, they recalled good times at Eliz1979705_694808787224242_110546287_nabeth Park.

“I used to play with Ana and Isaiah right here, in this park, when they were little,” Marquez said. “We’re so incredibly grateful to this community, to embrace this here where it means so much to us.”  Ana Grace’s brother, Isaiah, played piano at the ceremony, and was joined by a chorus of children, in tribute to his sister. (watch video)

Friends and family from Hartford, Newtown, New York, New Jersey and Winnipeg, Canada, where the Marquez-Greene family lived prior to moving to Newtown, were on hand to lend a hand at the start of construction, at the corner of Elizabeth Ave. and Whitney St. in the Park.  The opening ceremony on April 4 begins at 6 PM.

The playground at Elizabeth Park is the 18th constructed to date in the tri-state region of New York, New Jersey and Connecticut as part of the Where Angels Play project.  Among the playgrounds located in Connecticut are those in memory of James Mattioli in Milford, Josephine Gay in Bridgeport, Dylan Hockley in Westport, Allison Wyatt in Norwalk, Emilie Parker in New London, Jessica Rekos in Fairfield, and Victoria Soto in Stratford.AnaGrace-logo1

The Marquez-Greene family selected Elizabeth Park as the site for the playground honoring their daughter’s memory, and it’s playscapes feature the vibrant purple color that was her favorite.

In December, the family held “Love Wins: A Conference on Promoting Love, Connection and Community for Every Child & Family” at the University of Hartford.  It was the inaugural event of the Center for Community and Connection, a transformative initiative of the Ana Grace Project of the Klingberg Family Centers, attended by more than 500 people.  Participants in the December 2 symposium represented the fields of medicine, nursing, education, mentoring, early childhood, mental health, foster care, and the faith community, as well as state and local government.

Prison System As De facto Mental Health Service Center Brings Personal, Fiscal Costs

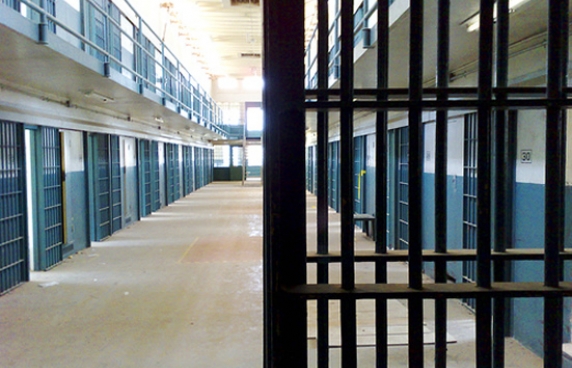
The UConn Health Center, on the pages of its Correctional Managed Health Care website, points out that “the public health burden that jails and prisons bear is enormous. A disproportionate number of incarcerated individuals are medically and/or psychiatrically compromised.” Connecticut is one of only six states with an integrated jail and prison system.

Statewide, each of the 24,936 annual jail and prison “admissions” requires a medical and mental health intake health screening. Generally, the website notes, “one out of five requires prompt medical or mental health intervention.” Schizophrenia, bipolar disorder, post traumatic stress disorder, depression, severe personality disorders, traumatic brain injury and addictive disorders are “overrepresented in this population,” the website indicates.

Mental health services aMental_Healthre available at all prisons and jails in the state, with comprehensive mental health programs at Osborn, Northern, York, Manson Youth, and Garner correctional institutions. Mental health services are comprehensive from admission to discharge, the website explains, and “focus on access to care and outreach, screening and assessment, identification, treatment planning, classification, provision of distinct levels of service and continuity of care upon discharge to the community.”
The mental health department includes approximately 14 psychiatrists, 17 psychologists, 10 mental health nurse practitioners, 19 psychiatric nurse clinicians, 69 social workers, and 15 professional counselors to serve the needs of approximately 19 percent of the inmate population, about 3,400 individuals.  The website indicates that as of June 2013, the prison population was 17,998 individuals (16,985 incarcerated and 1,013 in halfway houses).

A  recent The New York Times column by Nicholas Kristof posited that people suffering from mental illness often commit a crime in order to obtain treatment.  Because of the acute shortage of treatment facilities outside of prison, decades after the wholesale closing of mental health care facilities nationwide, prisons have become the nation’s de facto treatment centers.  Among the stark facts outlined:

  • More than half of prisoners in the United States have a mental health problem, according to a 2006 U.S. Justice Department Study.
  • Among female inmates, almost three-quarters have a mental disorder.
  •  Nationwide, more than three times as many mentally ill people are housed in prisons and jails as in hospitals, according to a 2010 study by the National Sheriffs’ Association and the Treatment Advocacy Center.
  • Forty percent of people with serious mental illnesses have been arrested at some point in their lives
  •  Taxpayers spend as much as $300 or $400 a day supporting patients with psychiatric disorders while they are in jail, partly because the mentally ill require mediation and extra supervision and care.
  • In 1955, there was one bed in a psychiatric ward for every 300 Americans; now there is one for every 3,000 Americans, according to a 2010 study.

Writing in the Connecticut Law Review, Christina Canales pointed out in 2012 that “Although a good plan in theory, deinstitutionalization quickly became one of the main reasons for the substantial increase in mentally ill individuals in prisons.  Many of the originally considered community mental health centers were never developed, leaving such individuals with nowhere to turn for treatment.”

The 2013 Legislation Report of the National Alliance on Mental Illness indicated that “Disproportionate numbers of people with mental illness are involved in the criminal justice system often as a result of untreated or undertreated mental illnesprisons. Thoughtful release planning and progressive probation or parole procedures increase the likelihood of successful re-entry for prisoners living with mental illness.”

In FY 2013, the UConn Health Center website details, there were 191,202 visits to social workers, psychologists and psychiatric nurse clinicians, including suicide risk assessments within DOC facilities. In addition, there were 20,056 visits to psychiatrists and 16,826 visits to Advanced Practice Registered Nurses.

The Connecticut Health Investigative Team (C-HIT) has reported that in 2003, "an estimated 13 percent were considered mentally ill."  In 2003, Connecticut’s prison population was 19, 605, according to the Office of Policy and Management’s Criminal Justice Policy and Planning Division.  That would have been approximately 2,549 individuals.

Connecticut Ranks #30 in Nation in Native Born Residents; Louisiana #1, Nevada Has Least

Just over half of Connecticut’s residents were born here, ranking the state 30th in the nation for the percentage of population who are native born.

Data from the U.S. Census Bureau’s American Community Survey, as analyzed by AARP, indicate that 55.2 percent of Connecticut residents were born in the Constitution State.   That places Connecticut fourth30 in New England, behind Massachusetts, Maine and Rhode Island.

The top 8 states with native born residents – all above 70 percent - are Louisiana, with 78.7 percent, followed by Michigan (76.7%), Ohio (75%), Pennsylvania (73.8%), Mississippi (72%), Iowa (71.6), Wisconsin (71.5%) and Alabama (70.2%).  The Rust Belt and Deep South generally had the highest percentages of resident born and raised in the states were they still live.

The lowest percentages of native born residents were in the states of Nevada (25%), Florida (35.7%), the District of Columbia (37%), Alaska (40.4%), New Hampshire (42%)  and Colorado (42%) .  The only Western state above 60 percent was Utah, at 61.8 percent.

In the tri-state region, native New Yorkers came in at 63.6 percent (ranked #18) and New Jersey at 52.6 percent, slightly lower than Connecticut.  Just one-tenth of a percent ahead of Connecticut was Georgia, with 55.3 percent.Born-in-the-USA

Just behind Connecticut in the rankings at #31 was California, with 54.5 percent of residents born in the state, and Hawaii, at 54.2 percent.

In thirteen states and Washington, D.C. – mostly in the West but also including Delaware (44.9%) and New Hampshire (42%) - less than half of residents are native sons and daughters.

1.       Louisiana78.7%

2.       Michigan 76.7%

3.       Ohio 75.0% 4.       Pennsylvania 73.8%

5.       Mississippi 72%

6.       Iowa 71.6%

7.       Wisconsin 71.5%

8.       Alabama 70.2%

9.       West Virginia 69.6%

10.   Kentucky 69.8%

11.   Indiana 68.4%

12.   Illinois 66.9%

13.   North Dakota 66.9%

14.   Missouri 66.6%

15.   Maine 65.2%

16.   Nebraska 65.1%

17.   South Dakota 64.4%

18.   New York 63.6%

19.   Massachusetts 63%

20.   Utah 61.8%

21.   Arkansas 61.5%

22.   Tennessee 61.4%

23.   Oklahoma 60.9%

24.   Texas 60.6%

25.   Kansas 59.4%

26.   Rhode Island 58.1%

27.   North Carolina 58%

28.   South Carolina 58.25

29.   Georgia 55.3%

30.   Connecticut 55.2%

31.   California 54.4%

32.   Hawaii 54.2%