Hartford County Population Losses Go Near and Far, Gains Are Fewer and Closer

Each day in the United States, about 130,000 people move from one county to another.  That’s the bottom line of the new migration patterns released by the U.S. Census Bureau, which include a web mapping application intended to provide users with a simple interface to view, save and print county-to-county migration flows maps of the United States. The data are from the 2006-2010 American Community Survey (ACS).

In Hartford County, for example, there were 17,442 who moved here from a different state, but 20,524 who moved to another state.  In addition, there were 14,982 people who moved to Hartford County from another of the state’s eight counties.  There were also 5,212 people who moved to Hartford County from abroad, according to the Census data.

The American Community Survey (ACS) is an ongoing survey that provides data every year -- giving communities the current information they need to plan investments and services. Information from the survey generates data that help determine how more than $400 billion in federal and state funds are distributed each year.  The detailed data is combined into statistics that are used to help decide everything from school lunch programs to new hospitals, according to thecensus Census Bureau.

Hartford County’s strongest outward bound numbers are reflected elsewhere in Connecticut, and to North Carolina.  The top losses of population were:  827 people to Tolland County, 743 to Windham County, 305 to Wake County in North Carolina, 299 to Providence County in Rhode Island, and 286 to New London County, 261 to Worcester County, MA and 226 to Mecklenburg County in North Carolina.

The population gains in Hartford County were led by other parts of the state, and New York City.  The top six:  1,005 people from New Haven County, 599 from Fairfield County, 555 from Brooklyn, 548 from the Bronx, and 368 from Middlesex County and 300 from Westchester.

The web mapping application provides data for Hartford, Windham, New Haven, Middlesex, Tolland, Fairfield, Litchfield and New London counties.  In addition to the maps, the data can also be imported into spreadsheets.

Connecticut Ranks #3 in Ultra-High Net Worth Individuals Per Capita

Connecticut has the third highest percentage of ultra-high net worth individuals per capita, according to an analysis developed by the cable business network CNBC.

The network’s website noted, on America’s tax filing deadline day, that “one of the enduring legacies of the Occupy Wall Street movement” from a year ago is the term "One Percent," referring to the percentage of top wage earners in the United States - those who make an annual income of $343,000 or more. But even more selective at the top is the subset of the population known as "ultra-high net worth," or UHNW.

UHNW individuals are defined by David Friedman, president of the global wealth intelligence firm Wealth-X, as individuals with a net worth of at least $30 million, after accounting for shares in public and private companies, residential and investment properties, art collections, planes, cash and other assets.  The firm estimates that 59,805 such individuals live in the United States.CNBC

Using figures provided by Wealth-X, population data from the U.S. Census Bureau and the insights offered by Friedman, CNBC.com developed the list of the 10 states with the most UHNW individuals on a per capita basis.   Connecticut ranked third, between Montana and New York.

The network reported that “In Connecticut, the primary driver of wealth is the financial services sector, with most of the rich individuals in the state having made their money in this business.”  UHNW individuals living in Connecticut, according to CNBC, include Vornado Realty Trust CEO Michael D. Fascitelli, whose net worth is approximately $700 million; and Raymond T. Dalio of Bridgewater Associates, who lives in Westport and has a net worth of approximately $10 billion.

A surprising number one:  Wyoming.  An example, and an explanation by CNBC:  Christy Walton, the widow of John T. Walton, heir to the Wal-Mart empire. According to Wealth-X, her net worth is $25.7 billion. Wyoming is an example of the type of state that the very wealthy are finding an ideal tax haven. "This is a strategy in a lot of states," Friedman told CNBC. "A fusion of natural assets, in terms of what the state has to offer from a tourist perspective, combined with a low tax regime. It has the ability to offer executives a place of rest, and to get away from everything."

The top 10 states with ultra-high net worth individuals, per capita:

10. Vermont

Number of residents per UHNW individual: 4,635 UHNW population: 135     Total population: 625,741

9. Illinois

Number of residents per UHNW individual: 4,615 UHNW population: 2,780     Total population: 12,830,632

8. Wisconsin

Number of residents per UHNW individual: 4,391 UHNW population: 1,295     Total population: 5,686,986

7. Texas

Number of residents per UHNW individual: 4,269 UHNW population: 5,890     Total population: 25,145,561

6. Rhode Island

Number of residents per UHNW individual: 4,048 UHNW population: 260     Total population: 1,052,567

5. California

Number of residents per UHNW individual: 3,401 UHNW population: 10,955     Total population: 37,253,956

4. Montana

Number of residents per UHNW individual: 2,910 UHNW population: 340     Total population: 989,415

3. Connecticut

Number of residents per UHNW individual: 2,657 UHNW population: 1,345     Total population: 3,574,097

2. New York

Number of residents per UHNW individual: 2,255 UHNW population: 8,595     Total population: 19,378,102

1. Wyoming

Number of residents per UHNW individual: 1,911 UHNW population: 295     Total population: 563,626


Amtrak ridership breaks all-time records, local corridor sees increase

Amtrak ridership increased in the first six months of fiscal year 2013, with ridership in March setting a record as the single best month ever in Amtrak’s history.  Ridership grew 0.9 percent from October 2012 to March compared to the prior year, despite disruptions from weather, including Superstorm Sandy.  Amtrak said 26 of 45 routes had rider increases during the period and monthly records were set in October, December and January. Ridership on the New Haven – Springfield shuttle grew from 33,196 in March 2012 to 36,962 in March 2013, an increase of 11.3 percent.  Ridership from October 2012 through March 2013 grew by 5.2 percent from the same period a year earlier.  The Acela Express ridership dropped off slightly amid the record-breaking numbers, likely due to service interruptions due to Superstorm Sandy, down 2.5 percent last month compared with a year ago.NHHS

The numbers are encouraging as plans continue to move forward for dramatic improvements and expansions of service on the 62-mile New Haven-Hartford-Springfield (NHHS) corridor in the coming years.  Amtrak is continuing the installation of underground signal and communication cables, required to upgrade signal and communication systems for the NHHS rail corridor.

Work this month is scheduled in Newington, Hartford and Windsor.  The NHHS rail service project will connect communities, generate sustainable economic growth, help build energy independence, and provide links to travel corridors and markets beyond the region, officials say.

The new NHHS rail service will operate at speeds of up to 110 mph, cutting travel time between Springfield and New Haven to just 78 minutes. When the new service is launched in 2016, travelers at New Haven, Wallingford, Meriden, Berlin, Hartford, Windsor, Windsor Locks, and Springfield will board trains hourly during the peak morning and evening rush hours and every 90 minutes during off-peak periods. When all the planned improvements are completed, trains will operate every 30 minutes during peak periods. The full program also includes future, amtrak1new train stations at North Haven, Newington, West Hartford, and Enfield.

Nationally, long-distance routes with ridership growth in the October-to-March period included the New York City to Georgia route, the Palmetto, up 10.5 percent, and the Coast Starlight, which operates between Los Angeles and Seattle, up 10 percent.  Amtrak said ridership was up 9.8 percent on the Illini/Saluki, which operates between Chicago and New Orleans; 8.9 percent on the San Joaquin in California, 8.6 percent on the Piedmont in North Carolina and 8.2 percent on the Wolverine route in Michigan.

Amtrak officials say they expect to end the fiscal year at or above last year’s record of 31.2 million passengers.  The sixth annual National Train Day will be celebrated around the country on May 11.

Amtrak is America’s Railroad®, the nation’s intercity passenger rail service and its high-speed rail operator, with more than 300 daily trains – at speeds up to 150 mph (241 kph) – that connect 46 states, the District of Columbia and three Canadian Provinces. Amtrak operates intercity trains in partnership with 15 states and contracts with 13 commuter rail agencies to provide a variety of services.


Women-Owned Firms Propel Economic Growth, CT Ranked #22

Connecticut ranks 22nd in the “economic clout” of women-owned firms, according to a new study which averages each states’ ranking in the growth of the number, revenue and employment levels of women-owned firms between 1997 and 2013. The number of women-owned businesses in Connecticut increased 35 percent since 1997 and sales at those firms increased by nearly 67 percent,  in an analysis of U.S. Census data by American Express Open.  The review of state-by-state and national data estimates the number of Connecticut businesses owned by women increased to 97,800 this year. Those businesses will have $15.5 billion in sales and employ 92,200 workers in 2013, according to The 2013 State of Women-Owned Businesses Report.   Connecticut firms exceeded the national average in hiring employees (up 17 percent in the state vs. 10 percent nationally) and in sales growth (67 percent vs. 63 percent).

As of 2013, it is estimated that there are over 8.6 million women-owned businesses in the United States, generating over $1.3 trillion in revenues and employing nearly 7.8 million people. The American Express analysis showed Connecticut still lags behind the 59 percent national average in growth among women-owned businesses since 1997.women owned

Driving Growth

Between 1997 and 2013, when the number of businesses in the United States increased by 41%, the number of women-owned firms increased by 59%— a rate 1½ times the national average.

The report noted that in the six years since the beginning of the recession in 2007, private sector job growth in the United States has come from two main sources: large, publicly traded corporations, and privately-owned majority women-owned businesses.

Women of Color

In 1997, there were just under 1 million (929,445) firms owned by women of color, accounting for one in six (17%) women-owned firms. That number has skyrocketed to an estimated 2,677,700 as of 2013, now comprising one in three (31%) women-owned firms.

The number of firms owned by Latinas are estimated at 944,000 as of 2013, according to the analysis. These firms employ 408,100 workers and generate an estimated $65.5 billion in revenue. Latina women own 36% of all Latino-owned firms, employ 20% of the workers employed by Latino-owned firms, and contribute 16% of the revenue generated by Latino-owned businesses. While nationally 11% of women-owned firms are owned by Latinas, they comprise the greatest share of all women-owned firms in New Mexico (29%), Texas (25%), Florida (24%) and California (20%).

Across All Industries

The states with the fastest growth in the number, employment and revenues of women-owned firms are the District of Columbia, North Dakota, Nevada, Wyoming and Georgia. The states with the lowest growth in the number of women-owned firms between 1997 and 2013 are: Alaska (12%), West Virginia (23%), Iowa (23%), Ohio (27%) and Kansas (27%).  Among the nation’s 25 most populous metropolitan areas, the fastest growing for women-owned firms are San Antonio TX, Portland OR, Houston TX, Riverside CA, and Washington DC/MD/VA.

Women-owned firms continue to diversify into all industries. The industries with the highest concentration of women-owned firms are: health care and social assistance (53% of firms in this sector are women-owned, compared to a 29% share overall), educational services (45%), other services (41%), and administrative support and waste management services (44%).

The industries with the lowest concentration of women-owned firms (in industries contributing 2% or more of the business population) are construction (where just 7% of firms are women-owned), transportation and warehousing (11%) and finance and insurance (20%). All other industries are close to the 29% share in all industries—illustrating that women-owned firms are staking a claim in all sectors of the U.S. economy.

Connecticut's overall ranking at #22 falls between Pennsylvania and West Virginia.


Reductions in Financial Aid Would Harm CT Students in Independent Colleges

Leaders of the state’s independent colleges and universities are expressing concern about the impact on their students of proposed plans that would merge the state’s three financial aid programs into one and substantially reduce funding over the next four years. The proposal would restrict both the amount of funds that financial aid directors may award needy Connecticut students and to whom they may award the funds, points out Judith Greiman, president of Connecticut Conference of Independent Colleges.  Because the revamped system would no longer considering the cost of attendance, students at private colleges would be disproportionately impacted.

The plan is part of Gov. Malloy’s budget proposal is now being considered by the legislature.  It consolidates the longstanding financial aid programs into a single Governor’s Scholarship Program.  University of Hartford President Walter Harrison said the plan “will begin, brick by brick, to dismantle the strong array of independent colleges and universities” in Connecticut.

“While we understand the difficult budget issues that continue to impact state services, we must point out that the three primary state-funded financial aid programs, CICS, CAPCS and Capitol Scholars, have been substantially cut in the past two budgets and in the FY 13 rescission,” Greiman told the legislature. “This comes at a time of historically high student need. Cutting need-based grant aid any further will only hurt Connecticut’s students and families.”

Chart1The proposal also shifts funding from the two need-based aid programs to a program that determines financial aid based on need and merit.  In addition, for the first time it would reduce the amount of grant funds available to students by using some of the money to pay for state agency administrative costs.

Discussing the students helped by the state grants, Martha Shouldis, President of St. Vincent’s College in Bridgeport, told the legislature’s Higher Education committee that almost one-half of nursing graduates in the state, for example, are educated at private colleges.   She pointed out that students are “not only educated here but have a record of gaining employment here in Connecticut – they are an important part of the state health care labor pool now and in the future.”

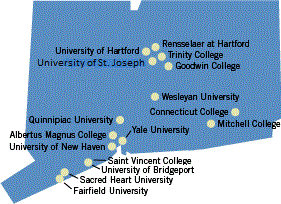
CCIC has highlighted the role of the 16 independent institutions on Connecticut.  The schools:

  • Enroll 31% of all college students statewide including 45% of four-year minority students.
  • Award 44% of all degrees granted in Connecticut in 2010-11, including 44% of all Bachelor’s, 64% of all Master’s and 58.5% of all Doctoral and 57% of all Professional degrees.
  • Award 57% of all degrees received by minority students (four-year and above).
  • Award 53-72% of four-year and above degrees given in key economic development cluster areas.
  • Provided almost $65 million annually in need-based institutional financial aid to Connecticut undergraduates in 2010-11.map_2012

The CCIC institutions include Albertus Magnus College, Connecticut College, Fairfield University, Goodwin College, Mitchell College, Quinnipiac University, Rensselaer at Hartford, Sacred Heart University, St. Vincent’s College, Trinity College, University of Bridgeport, University of New Haven, University of Hartford, University of Saint Joseph, Wesleyan University and Yale University.

Young Adult Unemployment Rates Persist at High Levels, Education Remains Key Factor

Analyzing the enduring economic effects of youth unemployment, a new report by Demos outlines a serious job crisis, especially those with less education and individuals of color.  Surveying a full year of U.S. Bureau of Labor Statistics data from 2012, Stuck: Young America’s Persistent Jobs Crisis shows that 18 to 34 year-olds make up 45% of the total share of the unemployed population nationwide and continue to face a serious jobs gap—with 4.1 million new jobs needed to return to pre-recession levels of employment.STUCK Among the report’s key findings:

  • Young adults gained little ground in 2012. Altogether, there are more than 5.6 million 18 to 34-year-olds, 45 percent of all unemployed Americans, who are willing and able to take a job, but have been shut out of opportunities for employment.
  • Young adult Hispanic workers experience unemployment rates 25 percent higher than those of whites, while African Americans face rates approximately double.
  • The greatest differences were attributed to education: the unemployment rate for 18 to 24 year olds with a Bachelor’s degree was 7.7% compared to 19.7% for those with a high school diploma.
  • In 2012, the labor force participation rate of 18 to 24 year olds declined to its lowest point in more than four decades.
  • Workers with a four-year degree are 9 to 12 percentage points more likely to be in the labor market than workers with a high school diploma in every age group. The unemployment rate for workers with a high school diploma is twice as high as unemployment among workers with a Bachelor’s degreegraph

The findings update data provided in 2012 to the Connecticut Commission on Children and Connecticut Workforce Development Council, which indicated that teenage labor force participation had dropped 48.2 percent over the past 22 years across the US, and employment rates were lowest among teens of color.   The Commission and Council held a public forum on youth unemployment last year, noting that “For young people, the Great Depression isn't a history lesson - it's a current event.  While the overall unemployment rate hovered around 8 percent last summer, it stood at 17.3 percent for those between the ages of 16 and 24.”  The new Demos report suggests that progress has been negligible in the year since.

Demos is a public policy organization “working for an America where we all have an equal say in our democracy and an equal chance in our economy.”  The organization is led by former Connecticut Secretary of the State Miles Rapoport, and has offices in New York, Washington and Boston.   The new report indicates that if job growth continues at 2012 levels,  “it will be another ten years before the country recovers to full employment. Even then, workers under 25 will face unemployment rates twice the national average.”

The Demos report recommends that “Public investment to directly employ young adults—especially young adults of color and those without a college degree—could address the jobs crisis facing this generation, contribute to the recovery through increased consumer spending, and accomplish the kind of strong, stable, and diverse society that we envision for our future.”

Single Person Households on the Rise in Connecticut, Nationwide

People of a certain age remember the phrase “one is the loneliest number” from the Three Dog Night song of the ‘70’s.  Well, apparently in Connecticut and the nation, that’s not as true as it once was. In 1950, 22 percent of American adults were single. Four million lived alone. They accounted for 9 percent of all households. Today, more than 50 percent of American adults are single -- 31 million, about one out of every seven, live alone. These so-called “singletons” are the focus of a recent book by Eric Klinenberg, a sociologist at New York University, "Going Solo: The Extraordinary Rise and Surprising Appeal of Going Alone."

About 17 mil­lion women are living alone, compared to 14 million men. The majority, more than 15 million, are middle-age adults between the ages of 35 and 64.  About ten million are age 65 plus. Young adults be­tween 18 and 34 total more than five million, compared to 500,000 in 1950, making them the fastest-growing segment of the solo-dwelling population, Klinenberg points out.

Data from the 2010 U.S. Census on households and families reflect that in Connecticut 27.3 percent of households are one-person households, and 10.6 percent are a one-person household where the individual is 65 or older.  Those numbers are both slightly higher than the U.S. average nationwide of 26.7 percent one-person households, with 9.4 percent age 65 or older.

The Census Bureau also noted that the 2010 data was “the first time that husband-wife families fell below 50 percent of all households in the United States since data on families were first tabulated in 1940.”living alone

Among non-family households, the Census found that “one-person households predominated (31.2 million) and were more than three times as common as nonfamily households with two or more people (8.0 million).”  In addition, The Pew Research Center reports that the average age of first marriage for men and women is 'the highest ever recorded, having risen by roughly five years in the past half century. The percentage of Americans living by themselves has doubled since 1960.

"People who live alone are now tied with childless couples as the most prominent residential type -- more common than the nuclear family, the multigenerational family, and the roommate or group home. Surprisingly, living alone is also one of the most stable household arrangements. Over a five-year period, people who live alone are more likely to stay that way than everyone except married couples with children,” Klinenberg reports.

In the last century, he points out, living alone was by far most common in the open, sprawl­ing Western states -- Alaska, Montana and Nevada -- that attracted migrant working men, and “it was usually a short-lived stage on the road to a more conventional domestic life.” Today, people who live alone are most-often in metropolitan areas in all regions. The cities with the highest proportion of people living alone include Wash­ington, D.C., Seattle, Denver, San Francisco, Minneapolis, Chicago, Dallas, New York City, and Miami.

As Connecticut’s cities seek to add downtown living options to boost their 24-hour populations, the trends in the nation’s leading cities – and the national overall - are not going unnoticed.  The City of Hartford’s plan of development, for example, notes that “there are approximately 2,500 to 2,800 residents living in Downtown Hartford. A resident population of between 8,000 and 10,000 people is needed for a vibrant Downtown Hartford that is self-sustaining.”  It calls for an increase in “housing types that should include active adult housing, housing for college students, housing for young professionals and housing for families.”

Hartford Is Top-50 City for Volunteers, Survey Finds

A survey of the level of volunteering in 75 American cities  places Hartford in the top 50, finishing in a tie for 47th, with 26 percent of adults having participated in volunteer work, volunteering programs or volunteering organizations in the past 12 months.  That’s just slightly below the national average of 27 percent.  Hartford, which tied with Albany, Memphis, Oklahoma City, Greensboro and Sacramento, was the only Connecticut city on the list, developed by Scarborough Research. The top local markets were Salt Lake City, UT (42%); Minneapolis, MN (34%); Des Moines, IA (volunteers34%); Portland, OR (34%) and Grand Rapids, MI (33%).

The generational breakdown of volunteers, according to the survey: Millennials (20% of adults participated in volunteer work in the past 12 months), Generation X (27%), Baby Boomers (34%) and the Silent Generation (18%).

The survey also revealed additional demographic information about volunteers. Adults who are self-employed or small business owners are 12 percent more likely than all U.S. adults to be volunteers. While 43 percent of volunteers are employed full-time, they are 16 percent more likely to hold white collar employment and 34 percent more likely to have a college degree or higher.

Volunteers are not only generous with their time; they are financially charitable as well. They are:

  • 84 percent more likely than all U.S. adults to have contributed to an arts/cultural organization in the past 12 months,
  • 61 percent more likely to donate to an environmental organization and
  • 60 percent more likely to contribute to a political or social care/welfare organization in the same time period.

Fifty-seven percent of volunteers contributed to a religious organization in the past year.

For nonprofit organizations seeking to communicate with and reach out to potential volunteers, the survey suggests where and how to do so.  The survey reported that 56 percent of volunteers read the local news section of their newspaper and 38 percent read the international/national sections.

Regarding television and radio habits, the survey found that volunteers are 17 percent more likely than all U.S. adults to tune in to HGTV, 16 percent more likely to watch PBS and 13 percent more likely to watch TLC. The top radio formats for volunteers are Adult Contemporary (26% of volunteers listen), Pop Contemporary (26%) and Country (25%).

The survey was conducted in November 2012, covering the previous 12 months.  Scarborough Research, based in New York City, is a joint venture between Arbitron Inc. and The Nielsen Company.

Danbury Is Safest CT City; Stamford, Waterbury Next

Danbury has been ranked as the safest city in Connecticut according to the annual publication, City Crime Rankings 2012-2013: Crime in Metropolitan America, released by CQ Press.  The city narrowly missed the top 100 safest cities in the U.S, ranking at #106 nationally, sandwiched between Aurora, IL and Peoria, AZ. The other ranked Connecticut cities were Stamford at #152 (just ahead of Santa Rosa, CA) and Waterbury at #218 (just ahead of Raleigh, NC), followed lower down the list by a close grouping of Bridgeport at #404 (just ahead of Buffalo, NY), Hartford at #411 (just ahead of Dayton, OH) and New Haven at #418 (just ahead of Little Rock, AK).

“Our city employs some of the finest Police Officers in our region.  The deep dedication that our Officers have for our community’s well-being is evident by this ranking,” said Danbury Mayor Mark Boughton.  We are proud of their work and we will continue focusing our efforts on maintaining exceptional public safety.”

The rankings of the safest and most dangerous cities and metropolitan areas are calculated using six basic cricrimeme categories: murder, rape, robbery, aggravated assault, burglary, and motor vehicle theft.  These categories have been used for determining city ratings since 1999.  The rankings include all cities of at least 75,000 residents that reported crime data to the FBI in the categories noted.

Among cities with 500,000 residents or more, the lowest crime rate rankings were in El Paso, TX;  San Diego, CA and New York City.  Cities with between 100,000 and 499,000 population were led by Naperville, IL; Amherst, NY and Irvine, CA.  Among cities with between 75,000 and 100,000 population, the lowest crime rates were in Fishers, IN; Johns Creek, GA and O'Fallon, MO (Newton, MA was fifth).

The nation's highest crime rates, according to the rankings, were in Detroit and Flint, MI and Camden, NJ.

The purpose of City Crime Rankings, according to the publisher, is to serve as a resource for researchers, city and law enforcement officials, and the community.

Immigration Becomes Focus at State Capitol

Immigration continues to be not only part of the American historical fabric, but one of the current hot button issues in Congress and the country. The Connecticut Immigrant Rights Alliance (CIRA) is organizing a rally that will march from the Old State House to the State Capitol on April 10, beginning at 3:30 PM.  Organizers say “the time is now” for a “realistic path to citizenship” and “reform that keeps families together, raises standards for all working people, and keeps the economy strong.”  They will be urging President Obama and Congress to pass “common sense immigration reform” this year.

The following day, April 11, the Connecticut Immigrant and Refugee Coalition will host the 16th annual Connecticut Immigrant Day ceremony at the State Capitol’s Old Appropriations Room from 1:00 to 2:30 PM.  The keynote speaker will be Jose B. Gonzales of New London, associate professor of English at the U.S. Coast Guard Academy, and the recipient of the Connecticut Department of Education's Faculty of the Year Award in higher education.  A native Spanish speaker, he was born in San Salvador, and is an Essayist and Poet.immigration

In a recent public opinion poll, sixty-eight percent (68%) of likely U.S. voters think immigration - when done within the law - is good for America. The Rasmussen Reports national telephone survey fund that only 19% disagree and feel legal immigration is bad for the country. Thirteen percent (13%) are not sure.

The recently formed CIRA is comprised of immigrant families, community leaders and elected officials -  a new statewide coalition calling for a path to citizenship for all undocumented immigrants, an end to family separations, and a moratorium on deportations.

The nonprofit Connecticut Immigrant and Refugee Coalition (CIRC) was established in 1996 as a broad-based network of community agencies, religious groups, legal service providers and immigrant rights activists committed to protecting the rights and welfare of refugee and immigrant communities in the state. Within this network, numerous refugee and immigrant groups are represented.

Amidst all the policy discussion, the Hartford Public Library conducts free citizenship classes on Saturday mornings, 10 am- 12 pm, for a 12-week cycle, at the branch at 1250 Albany Avenue.  They also offer DVDs, CDs and books to support the classes, and volunteer tutors are available on request.  The classes are funded in part by the U.S. Citizenship and Immigration Service, according to the Library.