Half of Eligible Teenagers Delay Drivers License, Study Finds

In an unexpected sign of the times, about half of the teenagers in the U.S. who are old enough to obtain a drivers license are waiting to do so, according to a new survey.  The most common reasons cited for delayed licensure were not having a car, being able to get around without driving, and costs associated with driving.

The study, by the AAA Foundation for Traffic Safety, found that less than half (44 percent) of teens obtain a driver’s license within 12 months of the minimum age for licensing and just over half (54 percent) are licensed before their 18th birthday. These findings mark a significant drop from two decades ago when data showed more than two-thirds of teens were licensed by the time they turned 18, accordidelayed licenseng to AAA.

The report found “Large social and economic disparities in licensing rates and in the timing of licensure.” Low-income, African-American and Hispanic teens are the least likely to obtain a driver’s license before age 18.

Only 25 percent of teens living in households with incomes less than $20,000 obtained their license before they turned 18, while 79 percent of teens were licensed by their 18th birthday in households with incomes of $100,000 or more.

 The findings for licensure by age 18 also differed significantly by race and ethnicity, with 67 percent for non-Hispanic white teens, 37 percent for non-Hispanic black teens, and 29 percent for Hispanic teens.

Some had suggested that teens were waiting simply to avoid graduated driver’s licensing (GDL), missing both the limitations and benefits of the laws, which vary across states, aimed at improving new driver training and safety, and causing some concern.  The survey, however, did not find this to be a prominent reason in delayed licensing.  A number of other reasons for delaying licensure were cited, including:

  • 44 %– Did not have a car
  • 39 % – Could get around without driving
  • 36 %– Gas was too expensive
  • 36 % – Driving was too expensive
  • 35 % – Just didn’t get around to it

Many states impose the GDL restrictions only for new drivers younger than 18.  The AAA report indicated that “Given the  large proportion of new drivers who are 18 years old or older, further research is needed to investigate their levels of safety or risk, to evaluate the potential impacts of extending GDL systems to new drivers aged 18 and older, and to explore other ways to address the needs of older novice drivers.”

In Connecticut, anyone 18 years of age or older must hold an adult learner’s permit for 3 months before obtaining a driver's license.  The state Department of Motor Vehicles website outlines the procedures in Connecticut, which have been revised as recently as January 2013 based on new laws approved by the state legislature.

The proportion of teens who were licensed varied strongly by geographic region, the AAA study found: licensing rates were much higher in the Midwest (82%) than in the Northeast (64%), South (68%), or West (71%).

The study did not discern major variations by gender among teens.  Although males were slightly more likely than females to obtain a license within six months of their state’s minimum age (33% vs. 28%), females were actually slightly more likely than males to obtain a license within 1-2 months of their state’s minimum age.

The researchers surveyed a nationally-representative sample of 1,039 respondents ages 18-20. The full research report and results are available on the AAA Foundation for Traffic Safety website.

Mapping of Introduced Legislation Shows Subjects of Most Interest

Wondering in which subject areas the greatest volume of proposed legislation was centered during the 2013 Connecticut General Assembly session?  There’s a map for that.

Data compiled and presented in a brightly colored, multi-layered, interactive display by the website Readily Apparent illustrates the leading legislative areas of focus, based on the number of bills introduced by lawmakers during the five-month session that concluded in June.

Leading the way in 2013 was Government Administration and Elections with 458 proposed bills, followed by Criminal Justice and the Courts with 320, Education with 248, Public Safety & Security with 194 and Public Health with 181.

In each of 23 subject areas, Readily Apparent “drills down” to break each subject into subcategories – visible with the click of a mouse.square map

In Government Administration & Elections, for example, the breakdown, also visually displayed, is 246 bills related to state government operations, 93 dealing with elections, 62 focused on the legislature, 29 on government contracts, 24 on municipalities, and 4 on regulated activities.  Each of those categories is subdivided further.  The “state government operations” category, for example, includes six distinct sub-categories.

In addition to the three levels of breakdowns, the website also provides a listing of all the bills introduced in each category, forming a comprehensive list of bills introduced to be considered by lawmakers during the legislative session.

The site describes the “What’s Getting Lawmakers Attention” tree-map interactive data display as providing a “30,000-foot view” of activity by policy area in the 2013 CGA session.

Readily Apparent co-founder Brendan Hanrahan’s primary interest, according to the website, “is in conveying new insights that can be gained with the use of relational data designs and dynamic graphics.  He has been exploring, designing and developing web-based applications for data management, analysis and visualization since 2004.

Free Summer Meals Program for Children Aims to Provide Nutrition, Sustain Academic Progress

Turns out, there is a free lunch.  In fact, Connecticut’s summer meal program for children 18 and under is providing hundreds of lunches – and breakfasts.  As Governor Malloy points out in a radio commercial now being broadcast around the state, 3 in 4 Connecticut children who could receive free meals aren’t doing so.

Officials say that the absence of good nutrition over the summer – when children are out of school and school lunch programs are unavailable - may contribute to children slipping somewhat in their educational progress.  “Summer learning loss,” they say, may be caused in part by “summer nutrition loss.”  The free Summer Meals program aims to turn that around.

The statistics are startling.  There are 100,000 children in Connecticut who don’t know where their next meal is coming from, according to Lieut. Gov. Nancy Wyman, who helped to kickoff the statewide initiative, and joins the Governor in the radio announcement.   That is why more than 400 locations around the state,  including churches, parks, schools and even some pools, are serving free meals to children throughout the summer afree lunchs part of the summer meals program and the state’s ongoing End Hunger Connecticut initiative.

A new interactive website, www.ctsummerfoods.org, was launched at the beginning of the summer that lists all the locations serving the meals.  The site allows people to simply type in a town or zip code to see a list of locations in that area that offer the meals.

Children and teens, under 18, do not have to be receiving free or reduced price school meals during the school year to eat a free, nutritious, summer meal and/or snack at participating locations.  Connecticut ranks 5th in country, as of 2012, for such programs, with  about 25% of children who are eligible are receiving the breakfasts.  “We need to do better,” said Stefan Pryor, Commissioner of the State Department of Education, when the program began just after the school year ended.

The program website notes that “Only 25.8 of every 100 low-income students that participate in school lunch also participate in summer nutrition. If participation reached 40 percent, an additional 19,558 students would be reached and that would bring an additional $1.35 million federal dollars into the state.”

By heightening visibility of this program, the Connecticut No Kid Hungry campaign and its partners aim to increase participation in the state’s 2013 summer meals program by 9 percent. Flyers and other program material is available on-line to help local organizers get the word out in their communities.

In launching the program, “Blitz Days” were held in Hartford, Groton, Naugatuck, Norwalk and Waterbury to bring attention to the initiative, which is mostly funded by the federal government.  CT News Junkie has reported that program organizers don’t ask too many questions of those coming to receive meals. Income guidelines are not required because the idea is not to discourage anyone from receiving a meal, state officials said.

Last year the state of Connecticut received 20120717-ShareOurStrength_CT-0062-slider$1.55 million to administer the program. The bulk of that or $1.3 million was used to purchase food. Summer meals are paid for by the United States Department of Agriculture (USDA). The Connecticut State Department of Education works with the USDA to reimburse sponsors for the summer meals they provide to children and teens, under 18, at participating summer meals locations.

For details on dates and times that meals and/or snacks are being served at particular locations, individuals can use the Location Finder, text “CTmeals” to 877877, or call, toll-free, 2-1-1.  It is anticipated that the program will continue until the start of the school year in late August.

Patients Rate Hospitals in CT: Middlesex, Danbury, St. Vincent's Top Lists

When asked how they rated their hospital stay, about two-thirds of patients in Connecticut hospitals offer the highest, or very high, ratings.  And when asked if they would recommend the hospital to friends and family, a greater number, 72 percent on average, say they “definitely” would.  A closer look at the number  included in the U.S. News report on best hospitals, shows distinctions among Connecticut’s medical institutions – according to their patients.

Those receiving the largest percentage of very high overall ratings from patients are Middlesex Hospital (76%), St. Vincent’s Medical Center (73%), Danbury Hospital (72%) and Yale-New Haven Hospital (68%) – the only facilities to exceed the statewide average of 66 percent.

Topping the liPatient-Survey-st of those that would definitely be recommended to family and friends by patients were Middlesex Hospital and Danbury Hospital, both with 79%, and St. Vincent’s Medical Center and Yale-New Haven Hospital, each with 77%.  Others exceeding the statewide average of 72 percent were St. Francis Hospital and Medical Center, Hartford Hospital, and Stamford Hospital, all with 73 percent.

The hospitals with the lowest percentage of patients offering the highest overall rating were Waterbury Hospital and Bristol Hospital.  The lowest percentage who would recommend the hospital at which they were patients to their friends and family were Charlotte Hungerford Hospital in Torrington, Bristol Hospital, and Waterbury Hospital.

In addition to those responses, data is developed based on patient responses to questions related to pain control, staff courtesy, cleanliness of facilities, staff responsiveness to patient needs, and information provided related to discharge and recovery.

The data was compiled in August 2012 and release this month.

patients say

New Leadership at UConn's Roper Center for Public Opinion Research

There is new leadership at the helm of UConn’s Roper Center for Public Opinion Research - the leading educational facility in the field of public opinion. Paul Herrnson takes over this week as Executive Director of the Roper Center, and joins the faculty as a Professor of Political Science. The Roper Center, which was founded in 1947, promotes the intelligent, responsible and imaginative use of public opinion in addressing the problems faced by Americans and citizens of other nations. Dr. Herrnson comes to UConn from the University of Maryland, where he was a Professor in the Department of Government and Politics and recipient of outstanding teaching awards from the University and the American Political Science Association. He was also the Founding Director of the Center for American Politics and Government at the University of Maryland.roper

The Roper Center is an archive—it preserves the data from polls conducted by many leading survey organizations for the use of researchers, students, and journalists. Its collection now includes 18,000 datasets and continues to grow by hundreds of datasets per year. In total, it includes responses from millions of individuals on a vast range of topics.

Since its beginning, the Roper Center has focused on surveys conducted by the news media and commercial polling firms. However, it also holds many academic surveys, including important historical collections from the National Opinion Research Corporationherrnson and Princeton University's Office of Public Opinion Research.

Today, the Roper Center Facebook page includes current polling data from around the world, including questions culled from recent surveys on breaking news and topical events.

Herrnson is a well-published scholar whose research papers have appeared in the leading journals. His recent books include: Interest Groups Unleashed (2012), and the 6th edition of his widely used text, Congressional Elections (2011). According to the University of Maryland web site, Herrndon’s “dedication to civic responsibility and the political process fuels a number of activities on local and national levels.” He has provided expert testimony to the Maryland legislature, U.S. Congress and federal courts in the areas of voting technology, ballot access and campaign finance.

When the Center was launched, Elmo Roper and others in the emerging field of survey research recognized that the information they were gathering should be preserved for future generations of scholars, students, and journalists. Since that time, the Roper Center has continued to acquire and archive public opinion data.

Since its founding, the Center has maintained two key objectives: (1) to preserve the voice of the public in the form of public opinion polling data and maintain these data in the most current formats possible, and (2) to re-disseminate the data in detailed and complete form via intuitive access tools.

Most of the surveys in the Roper Center are national samples, but there are also some state and local surveys, as well as a number of surveys of special populations of interest. Nearly all of the surveys are based on representative samples drawn according to the best practices of the time. The Roper Center now focuses on data from the United States, but continues to acquire some surveys from other parts of the world, particularly Latin America.

The Roper Center contributes to education at the University of Connecticut.  Although the Roper Center does not offer any degree programs, it works with a wide range of programs-including the departments of Political Science, Sociology, and Statistics—in giving employment and research opportunities for graduate and undergraduate students.

Waterbury, New Haven Among Nation's Leading Cities for Healthcare Social Workers

Connecticut, always on the lookout for occupations with strong potential for job growth, appears to already have one in our midst.  New statistics indicate that Waterbury and New Haven are among the top five metropolitan areas in the nation for healthcare social workers – a status that could serve to attract individuals in the fast-growing field to the state.

Nationwide, the median salary for a healthcare social worker is $47,770, and the job outlook is bright: jobs are projected to grow 26 percent from 2010 - 2020, which is twelve percentage points above the projected national job growth of 14 percent.  In Waterbury, the median salary is $65,250, the second highest in the nation; in New Haven, ranked at #5, it is $61Waterbury CT,950, according to data compiled by the data analysis website ValuePenquin.

Healthcare social workers are professionals who provide a range of services that support patients' medical needs in their psychosocial environment, from advising caregivers to coordinating medical services.  With healthcare becoming increasingly complex, the need for healthcare social workers has grown, as reflected in the analysis that determined the Best Cities for Healthcare Social Workers, based on May 2012 data.

The U.S. Bureau of Labor Statistics has reported that Connecticut is ranked fourth nationwide in  job prospects and has the fourth highest annual wages, at $60,830.  The Bureau defines the occupation as one that provides individuals, families, and groups with the psychosocial support needed to cope with chronic, acute, or terminal illnesses.  Services include advising family care givers, providing patient education and counseling, and making referrals for other services. Individuals in the field may also provide care and case management or interventions designed to promote health, prevent disease, and address barriers to access to healthcare.

In the ValuePenquin study methodology, median annual pay - a substantial factor in the decision process for people looking for work – was considered, along with how expensive the city is to live in.  Since the focus was on job opportunities, the study also factored in cities’ concentration of healthcare social workers. The ‘location quotient’ measures the concentration of a particular occupation in a city as a proportion of all occupations relative to the national average. They infer a higher location quotient to mean a relatively higher demand for a profession's services.  Data from the Bureau of Labor Statistics underscored the recent study, ranking Connecticut fourth in the nation in location quotient, reflecting a field in demand.

While the study ranked Waterbury and New Haven in the top five, Massachusetts communities also had a strong showing, reflecting the regions attractiveness for professionals in the field.  The top ten:

  1. Carson City, NV
  2. Waterbury, CT
  3.  Cumberland, MD
  4. Taunton/Norton/Raynham, MA
  5.   New Haven, CT
  6.  Napa, CA
  7.  Yuba City,  CA
  8.  Springfield, MA
  9. Boston/Cambridge/Quincy, MA
  10. Hanford/Corcoran, CA

In addition, New Bedford ranked #14, Worcester was #16, Brockton/Bridgewater/Easton, MA was #17, Providence/Fall River/Warwick was #18, Pittsfield was #19 and Barnstable was #20.

BLS

In Only 37 Communities Do More Than 2/3 of 4th Graders Pass All Physical Fitness Tests

What do the towns of Preston, East Windsor, Bethany, Stafford, and Clinton, have in common?  Less than 20 percent of fourth grade students in those communities meet the standard on all four physical fitness tests – the lowest percentages in the state.  For Preston, it’s the second consecutive year in the bottom five. 

At the upper end of the spectrum, 95.5 percent of 4th graders in Eastford meet the standard on all four physical fitness tests, in Westbrook 89.5 percent, in Sterling 85.4 percent in New Canaan 83.3 percent and Union 80 percent – the only towns to exceed 80 percent in the most recent data, for 2011.  In 2010, 100% of fourth grade students in two towns – Union and Caanan – passed all four physical fitness tests, no towns reached that level in 2011 data.

Overall, in only 37 communities did more than two-thirds the fourth grade students pass all four physical fitness tests, and in another 63 communities more than half (but less than two-thirds) of the students did so.  In 69 communities, fewer than half of the fourth graders pass all four tests - compared with  67 communities the preceding year..  Connecticut has 169data visualization towns and cities.

The data is available on the web site of the Connecticut Data Collaborative, which is bringing together data from various state agencies, making it more readily available to the public, along with the means to combine data from different agencies and chart the information in data visualization charts that help to illustrate patterns that enhance understanding.

The Connecticut Data Collaborative is a collaborative public-private effort to improve the quality of and access to policy-related data in the state – a central portal where all Connecticut organizations and residents can access a wide range of data from federal, state, local and private sources relating to the health, well-being and economy of the residents of the State of Connecticut. The goals of the Collaborative include:

  • Advocacy – Advocating for the public availability of all state data to inform public debate and to drive planning, policy, budgeting and decision making in state government.
  • Standards – Promoting and modeling use of data standards around privacy, interoperability, data definitions and quality.
  • Access – Meeting demands for public access to data through the Collaborative’s data portal, CTData.org, and the associated Connecticut Nonprofit Strategy Platform.
  • Building Capacity — Creating opportunities for Collaborative and peer support in data development and use both online and in person.

Yale-New Haven Hospital Ranked Among Best Employers in USA for Workers Over 50

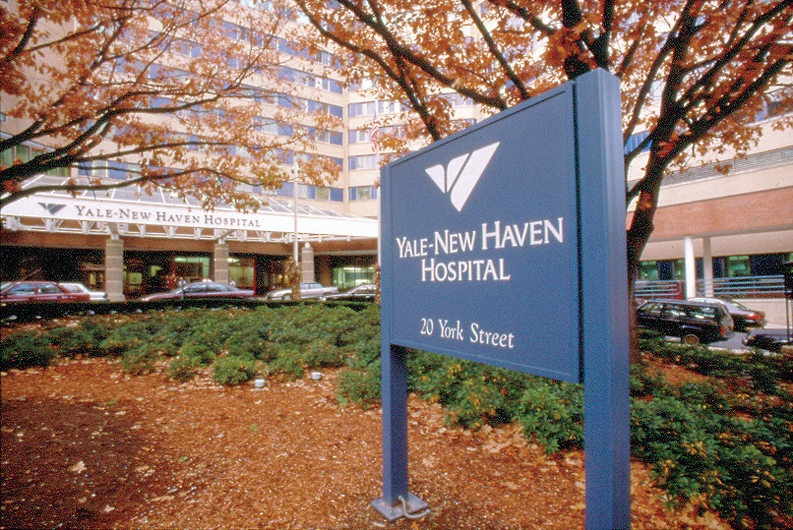
Yale-New Haven Hospital (YNHH) in New Haven is being honored by AARP and the Society for Human Resource Management (SHRM) as one of the 2013 Best Employers for Workers Over 50.  YNHH, which ranked 23rd in the nationwide survey, joins a diverse group of health systems, corporations, government agencies, and non-profits from across the country on the list, announced this week by AARP and SHRM.  It is the lone Connecticut-headquartered organization on the list of the top 50.

Thirty percent of YNHH employees are age 50+ with an average tenure of 18 years. YNHH offers a number of programs and benefits that support mature workers, including tuition reimbursement and training opportunities, fleAARPxible work schedules and alternative work arrangements, free health screenings and wellness programs, financial and retirement planning and dependent care benefits.

One program of particular interest to mature employees at YNHH is the ‘School at Work Program’.  This seven month refresher educational program is for individuals who have been out of a traditional learning setting for a significant time period and prepares the employee for additional formal education or a career change.

In addition, Retiree Medical Accounts are offered for employees retiring at age 55+ with at least ten years of service.  The medical account is funded annually, starting at age 40, and the retiree can use the funds after retirement for medical expenses and insurance premiums.

Also on the national list of Best Companies, at number 27, is Cianbro a national construction engineering firm with a regional office on East Dudley Town Road in  Bloomfield, Connecticut.  Cianbro self-performs civil, structural, mechanical, electrical, instrumentation, fabrication, and coating, in twelve different mynhh1arkets, throughout the United States. The company has experience in Construction Management, Design-Build, and Engineer Procure Construct (EPC), in addition to Conventional Design-Bid-Build.

This year’s list of the top 50 organizations was led by the National Institutes of Health (NIH), one of the world’s premiere medical research institutions.  Scripps Health of Southern California, which headed the list in 2011, is runner-up this year.  Rounding out the top 10 are Atlantic Health System, The University of Texas MD Anderson Cancer Center, Mercy Health System, The YMCA of Greater Rochester, West Virginia University, Bon Secours Virginia, National Rural Electric Cooperative Association, and WellStar Health System.

Key areas of consideration include: recruiting practices; opportunities for training, education and career development; workplace accommodations; alternative work options, such as flexible scheduling, job sharing and phased retirement; employee health and retirement benefits, and retiree work opportunities. The list of 2013 winners includes employers from a variety of industry sectors, including for-profit and nonprofit, health care, universities, financial services, construction, aerospace, and federal and county government.

Among Connecticut-based organizations, Yale-New Haven Hospital was previously honored as a Best Employer for Workers Over 50 in 2005 and 2006.  Past winners from Connecticut also include CTTRANSIT, Pitney Bowes and Hartford Financial.

Announcement of the top 50 came jointly by AARP and SHRM, which is co-sponsoring the Best Employers program for the first time. SHRM is the world’s largest association devoted to human resource management.

Report Warns of Separate But Unequal Community Colleges

Community colleges "are in great danger of becoming indelibly separate and unequal institutions in the higher-education landscape," a Century Foundation task force warns in new report.

The report, "Bridging the Higher Education Divide: Strengthening Community Colleges and Restoring the American Dream," outlines a series of proposals aimed at shifting the patterns that result in four-year colleges' enrolling disproportionably more wealthy and white students while two-year colleges enroll a higher proportion of needy and minority students.

Among its recommendations, the group urges states and the federal government to provide additional funds to two-year colleges that serve the neediest students, much in the way the federal Title I program works for elementary and secondary schools.

The Chronicle of Higher Education reports that the task force effort is premised on the notion that community colleges, which enroll about 44 percent of the nation's college population, are in many cases not serving students well now and will be ill equipped to handle future demands without radical change.  Research undertaken for the report found that, at some community colleges, almost two-thirds of the students are COMMUNITY_COLLEGEblack, Hispanic, or members of other groups typically considered underrepresented in higher education.

The approach outlined in the report could not only create more-affordable college pathways for middle-class families and improve educational outcomes at community colleges, it could also give community colleges more political clout, the Chronicle reported.

Connecticut’s 12 community colleges have 58,228 students, according to the Connecticut State Colleges & Universities website.  According to a 2011 report by the now defunct Board of Governors for Higher Education, nearly two-thirds (62.1 percent in fall of 2010) of all Hispanic/Latino and African American students attending community college do so at four of the system’s 12 institutions – Capital Community College in Hartford, Gateway Community College in New Haven, Housatonic Community College in Bridgeport and Norwalk Community College – all situated within or near urban cities with large low-income and minority populations. These institutions also awarded more than two-thirds (68.9 percent) of the associate degrees conferred to Hispanic/Latino and African American students by the community colleges during the 2009-10.

The Board of Governors report added that “it is clear that there is no problem regarding access for minority students at the state’s community colleges; thus, the Department’s grant program designed to reward and support their diversity efforts will require that they focus solely upon the retention and graduation of targeted students.”   In 2011, the Connecticut Mirror reported that the state pays about $7,000 a year for each full-time student enrolled in one of the 12 two-year community colleges -- but only one out of every 10 full-time students who enroll seeking an associates degree or certificate will earn one in three years. That ranks Connecticut's community college graduation rate 47th in the nation, according to a report by the state Department of Higher Education.

Earlier this year, in March, the Board of Regents for Higher Education, which now oversees the state’s 12 community colleges and four state universities voted to increase tuition by 5 percent in the coming year, despite student protests.  Students at Connecticut's community colleges would pay 5.25 percent more. For a full time student, that's an increase of $188 more, for a total of $3,786, the Hartford Courant reported.

The report by the Century Foundation noted that in a survey, eighty-one percent of students entering community college for the first time saying they eventually want to transfer and earn at least a bachelor’s degree but just 12 percent do so within six years. Among low-income students with “high” qualifications for college (those who completed “at least Trigonometry”), 69 percent of students who began in a four-year institution earned a bachelor’s degree, compared with just 19 percent of those who started in a community college.

Richard D. Kahlenberg, a senior fellow at the Foundation, questions how "we shower the most resources on the wealthiest college students and the least on the neediest," noting that the idea of reducing stratification by enhancing community colleges is an important focus in the report. The 22-member task force was led by Anthony W. Marx, the former president of Amherst College who now heads the New York Public Library, and Eduardo Padrón, president of Miami Dade College.

CT Differs from National Trend: Top Baby Names are Mason and Emma

Across the nation in 2012, the most frequent names for newborn babies were Jacob and Sophia.  Not in Connecticut.  Here, the leading names were Mason and Emma, choices that were runners-up nationally.

The top ten boys’ names in Connecticut were:  Mason, Jacob, Michael, Liam, Ethan, Jayden, Anthony, Matthew Noah and Ryan.  The top ten girls’ names in Connecticut were:  Emma, Olivia, Isabella, Sophia, Ava, Mia, Emily, Charlotte and Abigail.

Nationally, the leading boys names in 2012 were, Jacob, Mason, Ethan, Noah, William, Liam, Jayden, Michael, Alexander and Alden.  The most frequent girls names were Sophia, Emma, Isabella, Olivia, Ava, Emily, Abigail, Mia, Madison and Elizabeth.

In Connecticut, Sophia also topped the list in 2011, while Alexander was the leading name among boys.    Mason ranked third that year.  In 2010, Michael and Isabella were the most popular names chosen by Connecticut parents. Alexander dropped from number one in 2011 to number 13 in 2012.  Emma jumped from number four in 2011 to the top spot in 2012 in Connecticut.baby-cute-baby-1680x1050

The data is based on Social Security card application information, and compiled by the Social Security Administration. A decade ago, in 2002, the top names selected in Connecticut were Michael and Emily.  In 1992, Michael and Jessica topped the list.  By 2012, Jessica did not make the top 100 girls names in Connecticut.

Another name on the move – perhaps reflecting the growing popularity of the location in New York (and perhaps Connecticut, too?)  – is the name Brooklyn.  After finishing 75th in 2010 and 76th in 2011, the name jumped to47th in popularity in 2012.    Elizabeth is more popular outside Connecticut, ranked at number 10 nationally in 2012 and at number 20 in Connecticut, up slightly from number 23 the previous year.

Reasons for name selection vary widely.  One of the more recent findings, published in the October 2012 issue of Psychological Science, was developed by researchers Jonah Berger, Eric Bradlow, Alex Braunstein and Yao Zhang of the University of Pennsylvania’s Wharton School.  Writing in the journal of the Association for Psychological Science, they found that names starting with K, such as Karl and Katie, became about 9% more popular after Hurricane Katrina – evidence that parents’ choices about what to call their children are influenced by the sound of names in the news.   It is unclear whether Storm Sandy had a similar effect in Connecticut, since the storm occurred mid-way through the year.

A recent study by Bohan + Ipsos for WhyMomsRule.com found that nearly nine in ten Americans approve of their first names – 31 percent “love it,” 56 percent “like it,” 10 percent “dislike it” and 3 percent “hate it.”  The study also found a marked shift toward “unique” names and away from family and traditional names during the 20th century.  Daughters have more unusual names than sons, and sons have names that are easier to spell than daughters, the study, conducted in March 2013, found.

Closing out the top 100 most popular names in Connecticut were Antonio, for boys, and a three-way tie between Melanie, Serenity and Valentina among girls.  And just in case you’re wondering, in addition to Connecticut, Mason and Emma were the #1 names for 2012 in West Virginia.