Connecticut Ranks #4 in Back-to-School Stores

With students now settling into their classrooms and the hectic back-to-school shopping mostly in the rear view mirror, we learn that Connecticut ranks #4 among the nation’s states in the number of back-to-school retail stores per square mile.

The Land of Steady Habits is outpaced only by New Jersey, Rhode Island and Massachusetts as retail meccas for pre-school year shoppers, just ahead of Maryland, Delaware, New York and Florida.

Connecticut has 3,477 back-to-school retailers, for an average per square mile of .718, according to a Bloomberg Visual Data using NAICS data.  The data defines an establishment is a single physical location at which business is conducted. Retail totals were only for establishments identified in the following NAICS sectors and subsectors: electronics and appliance stor4es; clothing and clothing accessory stores; sporting goods stores; hobby, toy and game stores; musical instrument and supplies stores; bookstores; general merchandise stores; and office supply and stationery stores.

Alaska and Wyoming had the smallest number of retailers, at 661 and 678 respectively, as well as the smallest number per square mile. (Alaska was .001)

Connecticut’s annual tax-free week for clothing and footwear under $300 was conducted Aug. 18 through Aug. 24 at stores across the state, just prior to the start of the school year in most communities. On average, it is estimated that families spend nearly $700 on back to school purchases. The state expects to lose about $7 million to $8 million in revenue from the week of tax-free shopping.

According to the National Retail Federation projections prior to the back-to-school shopping season, the biggest portion of back-to-school shoppers’ budgets will go toward new apparel and accessories: 95.3 percent of those with school-age children will spend an average of $230.85 on fall sweaters, denim and other chic pieces of attire. Additionally, families will spend on shoes ($114.39) and school supplies ($90.49). Fewer families with children in grades K-12 will purchase electronics (55.7%), and those that are going to invest in a new tablet or smartphone are going to spend slightly less than last year.

back to school

CT Worst in Nation for Unemployed, Near Bottom in GDP Growth - But Not Miserable

Connecticut is the worst state in the nation for the unemployed, according to data compiled by Bloomberg news.  The state ranked last among the 50 states and District of Columbia on the difficulty of life for the unemployed based on three equally weighted criteria: income replacement, the unemployment pool and income disparity, based on data compiled from U.S. Bureau of Economic Analysis, U.S. Bureau of Labor Statistics, and U.S. Census.

According tbea_logo_460o the business news service, the ten most challenging states for unemployed residents are Connecticut, New Jersey, District of Columbia, California, Maryland, Alaska, New York, Virginia, Delaware, Massachusetts and New Hampshire.

The best states – at the opposite end of the data compilation – are North Dakota, Utah, Iowa, New Mexico, Oklahoma, Arkansas, West Virginia, Montana and Idaho.economic-indicators2

In developing the rankings, Bloomberg used the following:  Average weekly unemployment benefits was the quarterly average from 2Q 2012 to 1Q 2013. Personal Income per capita was calculated by dividing 2013 preliminary total personal income by state data from the Bureau of Economic Analysis by the state population from the Census as of mid-year 2012. Unemployment rates were the July 2012 to June 2013 seasonally adjusted 12-month average figures for the civilian non-institutional population. Household income ratios were from the U.S. Census Bureau, 2011.  The three scores were averaged for the final ranking.

Connecticut also ranked third from the bottom on Gross Domestic Product growth between 2008 and 2012, according to a companion Bloomberg report of data from the U.S. Bureau of Economic Analysis.  Only Arizona and Nevada had a worse track-record during the period.  Connecticut was one of ten states to experience negative GDP growth during the years of the comparison.  The state’s GDP dropped to 197.2 billion last year, from 202.5 billion in 2008.  The most dramatic increase in GDP was in North Dakota, where GDP grew 35 percent.  Next was Texas, with a 12 percent increase, followed by Oregon, West Virginia, Alaska, Louisiana, Utah, Nebraska, Maryland and Indiana.

There was some good news for the Land of Steady Habits in recent data.  Connecticut ranked #13 among the "least miserable" states in the nation.  Which are the most miserable states?  Louisiana, Mississippi, Arkansas, West Virginia, New Mexico, SoutCT welcomes youh Carolina, Alabama, Nevada, Tennessee and Kentucky.  All of which seems to indicate that a state can have solid GDP growth and still be relatively miserable - particularly for the unemployed.

Thirteen variables from the United Health Foundation's America's Health Rankings were isolated to determine each state's Misery Score. Among them:  Air pollution levels refer to micrograms of fine particles per cubic meter. High school graduation rates refer to percent of incoming ninth graders who graduate within four years. Poor health days refer to the number of days in which a person could not perform work or household tasks due to poor mental or physical health. Personal income refers to income from all sources and is not inflation adjusted.

The least miserable states were – from the top - Minnesota, North Dakota, New Hampshire, Vermont, Massachusetts, Hawaii, Iowa, Nebraska, Utah, Wisconsin, Wyoming, South Dakota – and then Connecticut, at lucky #13.

State Lottery Shows Strength in Connecticut, Land of Steady Habits

What would you do if you won the lottery?  According to a new survey, you’d go to work.  That's true not only in the Land of Steady Habits, but nationwide.

Two-thirds of American workers say they would continue working even if they won $10 million in the lottery, while 31% say they would stop, according to a new Gallup poll, released earlier this month. The desire to keep working after enjoying a financial windfall is higher today than in three earlier Gallup measures, all prior to the 2008-2009 recession, the polling firm reported.

Additionally, most American workers who predict they would continue working even after winning the lottery say they would want to stay at the same job rgallup pollather than seek a new job. The roughly 2-to-1 ratio in favor of keeping the same job versus getting a new one is about the same as in 2004, but slightly higher than in 2005 and 1997.

Bloomberg News has reported that lottery players in the U.S. spend an average of $396 a year purchasing lottery tickets, with residents of Massachusetts, Georgia and New York leading the way.  Using data from this analysis, Bloomberg identified which states see the highest and lowest payout ratios. Connecticut tops  neither list. On average, Massachusetts players spend $861, Georgians spend $471 and New Yorkers spend $450 on lottery tickets.  At the bottom in per person spending, on average, are Oklahoma ($71), Montana ($61) and North Dakota ($47).

In fiscal year 2012, players in Connecticut won $659.9 million in prize money. At the same time the CT Lottery provided a record $310 million to support the services and programs founded by the state’s General Fund including public health, libraries, public safety, education and more, according to state lottery officials. Connecticut’s first lottery btop 3egan in 1972, and was the fourth in the nation.

According to the quasi-public Connecticut Lottery Corp.'s most recent annual report, released in May, the lottery achieved record sales totaling nearly $1.1 billion in fiscal year 2012, an increase of $65.1 million from the previous fiscal year, the Day of New London reported.  The lottery credited a number of factors for its total sales increase, including higher sales of instant tickets and higher sales of multistate games, such as Powerball, Mega Millions and Lucky for Life. Also, 2012 was a leap year, meaning an extra day for sales.

For the first time in 15 years in fiscal year 2013 (which ended on June 30), the lottery is bringing in more revenue ($16 million) than both Foxwoods and payoutsMohegan Sun, WTNH-TV reported last week.  Lotteries are ubiquitous.  In North America every Canadian province, 43 U.S. states, the District of Columbia, Mexico, Puerto Rico, and the U.S. Virgin Islands all offer government-operated lotteries. Elsewhere in the world, according to NASPL, publicly-operated lotteries exist in at least 100 countries on every inhabited continent.

According to the U.S. Bureau of Economic Analysis, only seven U.S. states don't run lotteries: Alabama, Alaska, Hawaii, Mississippi, Utah, Wyoming, and Nevada. Of the 43 states that do run lotteries, the average payout is just under 60% of the revenue dollars collected. Using U.S. Census data, Bloomberg reported that of the estimated $50 billion spent on lottery tickets in 2010, only $32.8 billion was returned in prize money.

A previous Gallup Poll on Gambling in America found that 57% of American adults reported buying a lottery ticket in the past 12 months. People with incomes of $45,000 to $75,000 were the most likely to play -- 65 percent had played in the past year -- while those with incomes under $25,000 were the least likely to play at 53 percent. Further, people with incomes in excess of $75,000 spend roughly three times as much on lotteries each month as do those with incomes under $25,000, the National Association of State and Provincial Lotteries (NASPL) points out.

As Enrollment Climbs, Caliber and Diversity of UConn Students Also Increases

Five years ago, at the start of the 2008-09 school year, published reports trumpeted that “UConn is expecting about 300 more freshmen this fall compared to last, making the 3,500-strong class the largest in the school's history.  Déjà vu all over again, as students arrive on campus to begin the 2013-14 academic year. The state’s flagship university reports a freshman class of “approximately 3,750 members – the largest in the school’s history.”

UConn is also pointing with pride at a freshman class that has:UConn

  • an average SAT score of 1233, which outpaces last year’s incoming freshmen, whose average of 1226 had set the previous UConn record;
  • the most diverse group of students that UConn has ever recruited, with 27 percent of its members representing minority groups;
  • the largest number of Honors Program students (456) to enroll in UConn in a single year;
  • 149 valedictorians and salutatorians in the freshman class (continuing steady growth from 43 in 2002, according to the Daily Campus).

UConn’s new freshmen class draws 32 percent of its students from other states, the same level as in 2002.  In 2010, the Connecticut Post reported that out-of-state students made up 35 percent of the 3,339 freshmen who started their college careers at UConn's main caUConn enrollmentmpus and more than 26 percent of all 4,580 freshmen across the university's main and five regional campuses. That was up from 17 percent in 1995.

This summer, a record number of UConn students enrolled in summer school, taking advantage of incentives that include lower tuition and half-priced housing.  More than 8,800 students enrolled in one or both of the school's summer sessions, according to school officials.  That is up 22 percent from 2009, the year before the school began offering housing incentives for its summer programs.

UConn President Susan Herbst told the Day of New London this week that UConn plans to hire 259 new faculty members, 200 of whom will be teach the so-called STEM subjects - science, technology, engineering and math - and will enroll an additional 6,580 undergraduates in the coming yuconn-night1ears, after legislative approved of Gov. Malloy’s plan for more than $1.5 billion in bonding and $137 million from the state's general fund for "Next Generation Connecticut."  Total enrollment last fall was 30,250, including more than 17,000 undergraduates on its main campus in Storrs.

A decade ago, in October 2002, UConn reported that “freshmen enrollment at the Storrs campus has increased so significantly over the last five years that it will be maintained at about 3,200 students for the next few years."

Official  enrollment figures for the 2013-14 academic year will not be available until September.


Cost of Raising A Child Is Highest in Northeast U.S., Including CT

The cost of raising a child:  priceless.  Well, no, there is a price-tag.  The U.S. Department of Agriculture (USDA) released its annual report, Expenditures on Children by Families, which shows that a middle-income family with a child born in 2012 can expect to spend about $241,080 ($301,970 adjusted for projected inflation*) for food, shelter, and other necessities associated with child-rearing expenses over the next 17 years.

There was an overall 2.6 percent increase from 2011.  Expenses for child care, education, health care, and clothing saw the largest percentage increases related to child rearing from 2011. However, there were smaller increases in housing, food, transportation, and miscellaneous expenses during the same period. The 2.6 percent increase from 2011 to 2012 is also lower than the average annual increase of 4.4 percent since 1960.

The report notes geographic variations in the cost of raising a child, with expenses the highest for families living in the urban Northeast  - the 9-state northeast region, which includes Connecticut, Maine, Massachusetts, New Hampshire, New Jersey, New York, Pennsylvania, Rhode Island, and Vermont -followed by the urban West and urban Midwest. Families living in the urban South and rural areas have the lowest child-rearing expenses.report child expense

The report, issued annually, is based on data from the Federal government's Consumer Expenditure Survey, the most comprehensive source of information available on household expenditures. There is also  an interactive web version of the report where individuals can easily enter the number and ages of their children to obtain an estimate of costs through age 17.

Housing accounted for the largest share of total child-rearing expenses. For the middle and highest income groups (for households with the expense), child care and education was the second largest expenditure on a child, accounting for 18 and 23 percent of child-rearing expenses, respectively. For the lowest income group, child care and education accounted for 14 percent of total child-rearing expenses (again, for households with the expense). For lower income families, child care may be provided by relatives or friends at no cost due to affordability issues, the report pointed out.

Expenses per child decrease as a family has more children. Families with three or more children spend 22 percent less per child than families with two chchild expensesildren. As families have more children, the children can share bedrooms, clothing and toys can be handed down to younger children, food can be purchased in larger and more economical quantities, and private schools or child care centers may offer sibling discounts.

Among the largest potential costs in child-rearing is the cost of a college education, which was not included in this study, which only included direct parent expenses through age 17. The College Board estimated that in 2012-2013, annual average (enrollment-weighted) tuition and fees were $8,655 at 4-year public colleges (in-State tuition) and $29,056 at 4-year private (non-profit) colleges; annual room and board was $9,205 at 4-year public colleges and $10,462 at 4-year private colleges. For 2-year colleges in 2012-2013, annual average tuition and fees were $3,131 at public colleges. These college costs may be offset by financial aid.

The report concluded, as only a government report could, by stating: “The direct and indirect costs of raising children are considerable, absorbing a major share of the household budget. On the other hand, these costs may be outweighed by the benefits of children.”

The full report is available on the web at www.cnpp.usda.gov. A video highlighting the report is at http://www.youtube.com/watch?v=Di14Y3kTbHE

Achievement Gap Persists Despite Progress Reflected in High School Graduation Rates

The academic achievement gap is alive and well and living in Connecticut.

While the high school graduation rate in the state has edged upward for the third consecutive year in 2012, 15.2 percent - 43,883 students – in the cohort of the class of 2012 failed to complete high school in four years.  This is down from 17.2 the previous year, according to the State Department of Education’s newly released data.  The state’s graduation rate is 84.8 percent – the percentage of students who graduate high school within four years.

Of the 15.2 percent of students who failed to graduate in four years, just over one-third - 5.4 percent - was still enrolled when their fellow students received their diplomas.  Overall, the disparity in graduate rates among whites, blacks and Hispanics was pronounced:

  • The graduation rate of Hispanic students (68.6 percent) is 22.7 percent lower than that of White students (91.3 percent); the corresponding gap between Black/African American students (73 percent) and their White counterparts is 18.3 percent.
  • The graduation rate for low-income students (those eligible for free lunch) is 66.6 percent, whch is 26.5 percent lower than that of students not eligible for any lunch subsidies (93.1 percent).
  • The graduation rate for English Language Learners (62.7 percent) is 23.2 percent lower than that of their non-ELL peers (85.9 percent).

The graduation rate for Hispanics increased 4.4 percent last year over 2011, and it increased 1.8 percent for Black students, reflecting the state’s progress in narrowing the longstanding gap.

However, “just 54.2 percent of Hispanic males and only 57.6 percent of Black males who are eligible for free lunch graduated high school within four years,” the department reported, pointing out the demographic with the greatest disparities.

The report also noted that the high school graduation rate remains higher for males than females in Connecticut , 88.3 percent compared with 81.5 percent.  Anclass seatsd the graduation rate improved more for females (2.3 percent) than males (1.9 percent) from 2011 to 2012.

Across the state’s 188 high schools, the graduation rate was above 90 percent in 100 high schools, 40 high schools had a graduation rate of between 80 and 90 percent, and 38 high schools had a graduation rate of less than 80 percent.

Graduation rates are calculated according to the Adjusted Cohort Graduation Rate method, which was developed by the National Governors Association and is considered to be the most precise method. These rates represent the percentage of students who graduated with a regular high school diploma in four years or less. It is based on individual student level data, excludes 9th grade repeaters, late graduates, and accounts for transfers in and out of the graduating class over the four-year period.

By way of comparison, in North Carolina, 80.4 percent of students graduated high school within four years, somewhat below Connecticut’s overall 84.8 percent.  However, among students of color, North Carolina’s numbers outpace Connecticut.  In North Carolina, 73 percent of Hispanic students now graduate in four years, compared with 68.6 percent in Connecticut.  Among black students, the percentage graduating in four years is 74.7 percent in North Carolina, compared to 73 percent in Connecticut.

Nonprofits Boost Voter Turnout When They Reach Out to Clients, Study Finds

Voter turnout increases when nonprofit organizations are doing the asking.  That is the finding of a new study by Nonprofit Vote, which tracked the impact of nonprofit voter engagement efforts in seven states.  In addition, the demographic characteristics of the new voters is differs from the general voting population in ways that respond in traditional voting disparities.

“The clients and constituents engaged by nonprofits were markedly more diverse, lower income and younger than all registered voters in the seven states, made up of populations with a history of lower voter turnout in past elections,” the study indicated in its analysis of 2012 voting.  Among the key findings:

Voter turnout among those contacted by nonprofits was 74%, six points above the 68% turnout rate for all registered voters. In fact, nonprofit voters outperformed their counterparts across all demographics.

Voter turnout among voters contacted by nonprofits compared to all registered voters was 18 points higher for Latino voters, 15 points higher for voters under the age of 30, and 1turnout5 points higher for voters with household incomes under $25,000.

“The action by nonprofits had its biggest impact on turnout among least-likely voters – those that campaigns typically disregard based on low ‘voter propensity scores’ assigned before the election to predict their likelihood to vote,” the analysis indicated.  Young voters, ages 18-29, topped the list.

The report--Can Nonprofits Increase Voting Among Their Clients, Constituents, and Staff? An Evaluation of the Track the Vote Program—reflects data compiled from 94 nonprofits in seven states that registered or collected voter pledges from 33,741 clients and constituents during services.

In Connecticut, the Connecticut Association of Nonprofits participated in Nonprofit Vote, a nationwide initiative to involve nonprofits in efforts to urge people to register and vote.  The organization’s September 2012 newsletter, in an article by Nonprofit Vote, pointed out that “Many organizations now recognize the value of voter engagement as a key component in their advocacy toolkit and are no longer watching passively from the sidelines on Election Day.”

 “What stood out the most in the data,” the report found, “was the effect the personal outreach efforts of the nonprofits had in shrinking voter turnout disparities evident among all registered voters and in Census surveys generally.”voting nonprofits

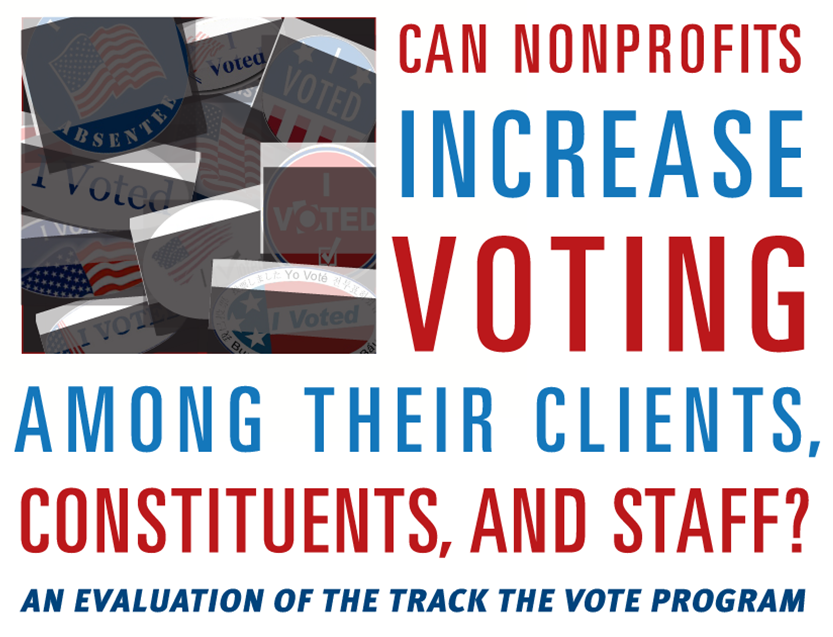
The top reasons that nonprofit organizations cited for conducting voter engagement were to advance their organization’s mission and empower their clients.  Nonprofits used a range of agency-based strategies to engage voters, and the most identifiable success factors were motivated staff and volunteers and strong support from a state or national partner in the form of training, check-ins and materials, the report said.

"Nonprofit service providers are well positioned to integrate new Americans into civic life and engage others who need encouragement to exercise their right to vote. This report provides useful evidence on how service providers can help to increase voter participation of populations new to the political process," said Elizabeth T. Boris, Director of the Center on Nonprofits and Philanthropy at the Urban Institute.

The states participating in the study were Arizona, Louisiana, Massachusetts, Michigan, Minnesota, North Carolina, and Ohio.  The Center for Information & Research on Civic Learning & Engagement (CIRCLE) at tufts University assisted in the analysis.

Noting that past research has found that personal contact with potential voters strongly encourages voting, the report indicated that the data “speaks broadly to the power of personal contact in mobilizing people to vote.  More specifically it affirms the impact of the personal contact coming from someone or an organization known to and trusted by the voter.”

NVRD logoIf you’re planning ahead for voter registration efforts this fall, the National Association of Secretaries of the State (NASS) approved a resolution last month that establishes September 24, 2013 as National Voter Registration Day.  Within the resolution, the Secretaries, who serve as their states’ top elections officials, called for “new and innovative methods” of voter registration.

Founded in 2005, Nonprofit VOTE partners with America’s nonprofits to help the people they serve participate and vote.  The organization is described as the leading source of nonpartisan resources to help nonprofits integrate voter engagement into their ongoing activities and services.

NASS Resolution Establishing September 24th, 2013 as National Voter Registration Day
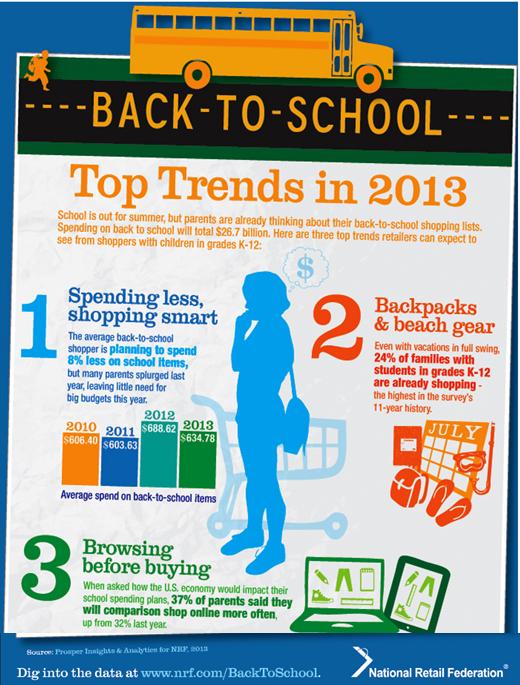
Half of Eligible Teenagers Delay Drivers License, Study Finds

In an unexpected sign of the times, about half of the teenagers in the U.S. who are old enough to obtain a drivers license are waiting to do so, according to a new survey.  The most common reasons cited for delayed licensure were not having a car, being able to get around without driving, and costs associated with driving.

The study, by the AAA Foundation for Traffic Safety, found that less than half (44 percent) of teens obtain a driver’s license within 12 months of the minimum age for licensing and just over half (54 percent) are licensed before their 18th birthday. These findings mark a significant drop from two decades ago when data showed more than two-thirds of teens were licensed by the time they turned 18, accordidelayed licenseng to AAA.

The report found “Large social and economic disparities in licensing rates and in the timing of licensure.” Low-income, African-American and Hispanic teens are the least likely to obtain a driver’s license before age 18.

Only 25 percent of teens living in households with incomes less than $20,000 obtained their license before they turned 18, while 79 percent of teens were licensed by their 18th birthday in households with incomes of $100,000 or more.

 The findings for licensure by age 18 also differed significantly by race and ethnicity, with 67 percent for non-Hispanic white teens, 37 percent for non-Hispanic black teens, and 29 percent for Hispanic teens.

Some had suggested that teens were waiting simply to avoid graduated driver’s licensing (GDL), missing both the limitations and benefits of the laws, which vary across states, aimed at improving new driver training and safety, and causing some concern.  The survey, however, did not find this to be a prominent reason in delayed licensing.  A number of other reasons for delaying licensure were cited, including:

  • 44 %– Did not have a car
  • 39 % – Could get around without driving
  • 36 %– Gas was too expensive
  • 36 % – Driving was too expensive
  • 35 % – Just didn’t get around to it

Many states impose the GDL restrictions only for new drivers younger than 18.  The AAA report indicated that “Given the  large proportion of new drivers who are 18 years old or older, further research is needed to investigate their levels of safety or risk, to evaluate the potential impacts of extending GDL systems to new drivers aged 18 and older, and to explore other ways to address the needs of older novice drivers.”

In Connecticut, anyone 18 years of age or older must hold an adult learner’s permit for 3 months before obtaining a driver's license.  The state Department of Motor Vehicles website outlines the procedures in Connecticut, which have been revised as recently as January 2013 based on new laws approved by the state legislature.

The proportion of teens who were licensed varied strongly by geographic region, the AAA study found: licensing rates were much higher in the Midwest (82%) than in the Northeast (64%), South (68%), or West (71%).

The study did not discern major variations by gender among teens.  Although males were slightly more likely than females to obtain a license within six months of their state’s minimum age (33% vs. 28%), females were actually slightly more likely than males to obtain a license within 1-2 months of their state’s minimum age.

The researchers surveyed a nationally-representative sample of 1,039 respondents ages 18-20. The full research report and results are available on the AAA Foundation for Traffic Safety website.

Mapping of Introduced Legislation Shows Subjects of Most Interest

Wondering in which subject areas the greatest volume of proposed legislation was centered during the 2013 Connecticut General Assembly session?  There’s a map for that.

Data compiled and presented in a brightly colored, multi-layered, interactive display by the website Readily Apparent illustrates the leading legislative areas of focus, based on the number of bills introduced by lawmakers during the five-month session that concluded in June.

Leading the way in 2013 was Government Administration and Elections with 458 proposed bills, followed by Criminal Justice and the Courts with 320, Education with 248, Public Safety & Security with 194 and Public Health with 181.

In each of 23 subject areas, Readily Apparent “drills down” to break each subject into subcategories – visible with the click of a mouse.square map

In Government Administration & Elections, for example, the breakdown, also visually displayed, is 246 bills related to state government operations, 93 dealing with elections, 62 focused on the legislature, 29 on government contracts, 24 on municipalities, and 4 on regulated activities.  Each of those categories is subdivided further.  The “state government operations” category, for example, includes six distinct sub-categories.

In addition to the three levels of breakdowns, the website also provides a listing of all the bills introduced in each category, forming a comprehensive list of bills introduced to be considered by lawmakers during the legislative session.

The site describes the “What’s Getting Lawmakers Attention” tree-map interactive data display as providing a “30,000-foot view” of activity by policy area in the 2013 CGA session.

Readily Apparent co-founder Brendan Hanrahan’s primary interest, according to the website, “is in conveying new insights that can be gained with the use of relational data designs and dynamic graphics.  He has been exploring, designing and developing web-based applications for data management, analysis and visualization since 2004.

Free Summer Meals Program for Children Aims to Provide Nutrition, Sustain Academic Progress

Turns out, there is a free lunch.  In fact, Connecticut’s summer meal program for children 18 and under is providing hundreds of lunches – and breakfasts.  As Governor Malloy points out in a radio commercial now being broadcast around the state, 3 in 4 Connecticut children who could receive free meals aren’t doing so.

Officials say that the absence of good nutrition over the summer – when children are out of school and school lunch programs are unavailable - may contribute to children slipping somewhat in their educational progress.  “Summer learning loss,” they say, may be caused in part by “summer nutrition loss.”  The free Summer Meals program aims to turn that around.

The statistics are startling.  There are 100,000 children in Connecticut who don’t know where their next meal is coming from, according to Lieut. Gov. Nancy Wyman, who helped to kickoff the statewide initiative, and joins the Governor in the radio announcement.   That is why more than 400 locations around the state,  including churches, parks, schools and even some pools, are serving free meals to children throughout the summer afree lunchs part of the summer meals program and the state’s ongoing End Hunger Connecticut initiative.

A new interactive website, www.ctsummerfoods.org, was launched at the beginning of the summer that lists all the locations serving the meals.  The site allows people to simply type in a town or zip code to see a list of locations in that area that offer the meals.

Children and teens, under 18, do not have to be receiving free or reduced price school meals during the school year to eat a free, nutritious, summer meal and/or snack at participating locations.  Connecticut ranks 5th in country, as of 2012, for such programs, with  about 25% of children who are eligible are receiving the breakfasts.  “We need to do better,” said Stefan Pryor, Commissioner of the State Department of Education, when the program began just after the school year ended.

The program website notes that “Only 25.8 of every 100 low-income students that participate in school lunch also participate in summer nutrition. If participation reached 40 percent, an additional 19,558 students would be reached and that would bring an additional $1.35 million federal dollars into the state.”

By heightening visibility of this program, the Connecticut No Kid Hungry campaign and its partners aim to increase participation in the state’s 2013 summer meals program by 9 percent. Flyers and other program material is available on-line to help local organizers get the word out in their communities.

In launching the program, “Blitz Days” were held in Hartford, Groton, Naugatuck, Norwalk and Waterbury to bring attention to the initiative, which is mostly funded by the federal government.  CT News Junkie has reported that program organizers don’t ask too many questions of those coming to receive meals. Income guidelines are not required because the idea is not to discourage anyone from receiving a meal, state officials said.

Last year the state of Connecticut received 20120717-ShareOurStrength_CT-0062-slider$1.55 million to administer the program. The bulk of that or $1.3 million was used to purchase food. Summer meals are paid for by the United States Department of Agriculture (USDA). The Connecticut State Department of Education works with the USDA to reimburse sponsors for the summer meals they provide to children and teens, under 18, at participating summer meals locations.

For details on dates and times that meals and/or snacks are being served at particular locations, individuals can use the Location Finder, text “CTmeals” to 877877, or call, toll-free, 2-1-1.  It is anticipated that the program will continue until the start of the school year in late August.