Most Exciting in Connecticut? New Haven, New London, Hartford Lead the Way

Wondering where the most exciting places are in Connecticut? If New Haven is the first place that comes to mind, you’re right. New Haven was named the “Most Exciting Place in Connecticut,” followed by New London, Hartford, Stamford, and Manchester in an analysis by the real estate website Movoto. 
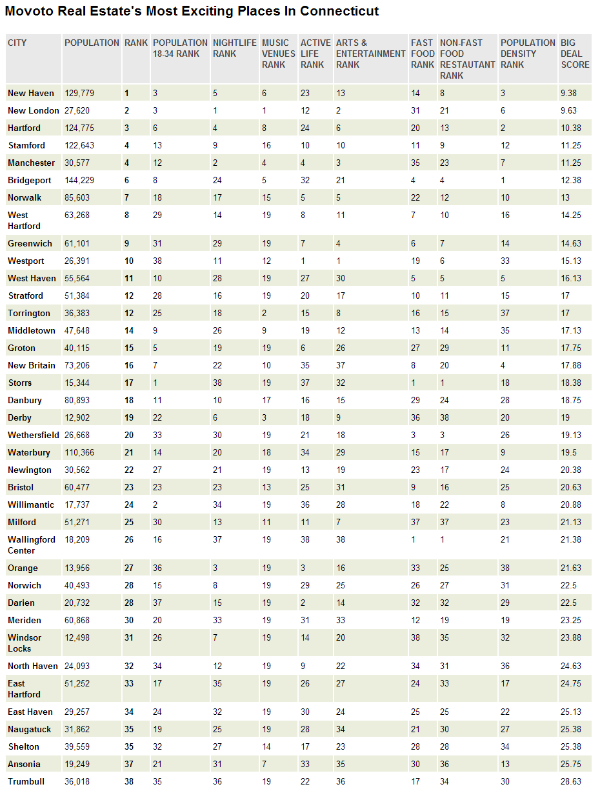
Described as “the most thrilling, the most rousing, and the most downright exciting,” the top 10 list for Connecticut includes five Fairfield County municipalities and many of the state's largest cities: TOP10

1. City of New Haven 2. City of New London 3. City of Hartford 4. City of Stamford (tie) 4. Town of Manchester (tie) 6. City of Bridgeport 7. City of Norwalk 8. Town of West Hartford 9. Town of Greenwich 10. Town of Westport

The website’s analysis pointed out that “New Haven had a ton of nightlife and music venues per capita” and was “much more densely populated than most other places in the state.” New London scored points in the website’s analysis for its “high percentage of young folks (just like New Haven, 36 percent between 18 and 34), and for its high number of nightlife options, music venues, and arts per capita.” New London ranked No. 1 in both nightlife and music venues, and No. 2 for its arts.

The highlights for Hartford noted that the Capitol City is “the second-most densely populated place in Connecticut; a good portion of that population is between the ages of 18 and 34- 31 percent, to be exact. With bars like Pourhouse and the Russian Lady, music venues like Webster Theatre, and so many museums, galleries, and festivals we can’t even name them all, Hartford is certainly way more exciting than just insurance.”

In order to come up with the list of 10, the website started out with a list of all the places in Connecticut with populations of 10,000 or more, according to the U.S. Census (2010), which provided 38 towns and cities. Then, they used the Census and business listings to assess:

  • Nightlife per capita (bars, clubs, comedy, etc.)
  • Live music venues per capita
  • Active life options per capita (parks, outdoor activities, etc.)
  • Arts and Entertainment per capita (movie theaters, festivals, galleries, theaters, etc.)
  • Fast Food restaurants per capita (the fewer the better)
  • Percentage of restaurants that are not fast food (the higher the better)
  • Percentage of young residents ages 18 to 34 (the higher the better)
  • Population density (the higher the better)

The municipalities were then ranked with scores from one to 38, where the lower the score, the more exciting the place.

Two Greater Hartford communities, in addition to the city, made the list – Manchester and West Hartford.

“Manchester also scored highly for its number of arts and entertainment options per capita, like the unique MCC on Main,” a program of Manchester Community College located on Main Street in the heart of the town. West Hartford, the website reported, “seemed to find its excitement, not in the nightlife … but in lots of healthy options,” including sports stores, gyms, galleries, theaters and “tons of restaurants.” Westport “really shined” in the number of yoga studios, sports stores, running clubs, parks, and places to get fit.”

Falling just outside the top 10 were West Haven, Stratford, Torrington, Middletown, Groton, New Britain, Storrs, Danbury, Derby and Wethersfield.

exciting

Connecticut Ranks #14 in Union Membership

Connecticut’s percentage of union members in its workforce – 13.5 percent - places the state at #14 in the nation for the percentage of union members. The top ten states are New York (24.4 percent), Alaska (23.1 percent), Hawaii (22.1 percent), Washington (18.9 percent), Rhode Island (16.9 percent), California (16.4 percent), Michigan (16.3 percent), New Jersey (16 percent), Illinois (15.8 percent), and Nevada (14.6 percent).

At the otimagesher end of the scale, the states with the smallest percentage of union members are Utah, Mississippi, South Carolina, Arkansas and North Carolina, all under 4 percent union members, according to data reported by Bloomberg.com.

Connecticut, ranked #14 just behind Massachusetts, has seen its percentage of union membership decline from 16.4 percent in 2000 to 14 percent at the start of 2012 to 13.5 percent at the start of 2013.

Nationwide, union membership has dropped from 20.1% of the workforce in 1983 to 11.2% last year, according to the website 24/7 Wall Street.Image: Fireman's helmet with union sticker

The union membership rate is defined as the percent of wage and salary workers that are members of a union. The data on union membership were collected as part of the Current Population Survey (CPS), a monthly sample survey of about 60,000 households that obtains employment information among the nation’s civilian non-institutional population aged 16 and over.

The union membership rate is updated annually by the U.S. Bureau of Labor Statistics. The data used was from 2012; the 2013 data is anticipated in September 2014.

CT’s 4th Congressional District Ranks #5 in US for Income Inequality

Connecticut’s 4th Congressional district, centered in Fairfield Country, has been ranked as the district with the 5th highest level income inequity in the nation. A ranking of congressional districts of by their level of income inequality, conducted by Bloomberg, uses the Gini coefficient, a formula that measures the distribution of income across a population. The closer a Gini number is to 1, the greater the level of inequality; the closer to zero, the closer to perfect equality.

Generally, the Bloomberg Businessweek website points out, the U.S. congressional districts with the most inequality share certain traits: “they contain a small, enormously wealthy elite surrounded by impoverished neighbors.” Most of the districts with the greatest disparity are located in or near major urban metropolitan aRich-vs-poor-directionsreas such as New York, Philadelphia, Chicago, Boston, Atlanta, and Washington.

The congressional district where inequality is highest turns out to be New York’s 10th, with a Gini coefficient of .587; followed by Pennsylvania’s 2nd District, at .583; Illinois’ 7th District, at .574, and Florida’s 27th District at .562. Connecticut’s 4th District is next, at .561, followed by New York’s 12th District, Ohio’s 11th District, Georgia’s 8th District and New York’s 16th District. The most equal district is Virginia’s 11th, at .385.

"The big take-away," according to Bloomberg Businessweek: “A strikingly high level of inequality exists throughout the United States.” Also of note, 9 of the top 10 districts with the greatest income inequality are currently represented in Congress by Democrats, including Connecticut’s Jim Himes, Georgia’s John Lewis, Washington D.C.’s Eleanor Holmes Norton, and New York’s Jerrold Nadler, Carolyn Maloney and Eliot Engel.

Breaking down the state’s population into five segments, by income, Connecticut ranked 10th in the share of household income among the lowest income quintile, 5th in the second quintile, 4th in the third quintile, 5th in the fourth quintile at and 4th in the highest-income quintile.

The website takes the state-by-state comparison one step further, providing context by comparing the state data with data compiled by the Central Intelligence Agency, which tracks the Gini coefficient of 139 countries.

“What jumps out,” according to the website report on the data analysis, “is how lousy the United States looks. Our best district in terms of equality (VA-11) is only as good as Portugal, which sits at a pedestrian 71st on the CIA’s list, right in the middle of the pack. That means that the level of equality in every congressional district in America falls below the midpoint of the CIA’s 139-country ranking.”

“Even the best U.S. district has higher inequality than any number of countries you probably don’t associate with economic egalitarianism: Greece, Niger, Ethiopia, Egypt, Pakistan, Kosovo, Mongolia, Ukraine, Bangladesh. The most equal U.S. congressional district can’t compare with the national averages of New Zealand, France, Canada, Netherlands, Australia, Switzerland, Belgium, Germany, and Austria. Most districts in the U.S. (those ranked 39th through 429th) fall in a narrow Gini band between .4 and .499, putting them between Zimbabwe (20th on the CIA list) and the United Kingdom (60th).”

In 2013, a person living alone making less than $11,490 was classified as in poverty. The threshold increased by $4,020 for each additional household member.

State Comparison Ranks Connecticut Students #4 in College Prep Test Results

Where have all the smart kids gone? Apparently, north. A state-by-state comparison map compiled by the website FindTheBest shows that when it comes to American students' standardized test scores, the North is dominating the South. And Connecticut is a top ten state, ranking at number 4.

The students with the best scores were in the states of New Hampshire, Minnesota and Massachusetts. Most of the New England states - except Maine and Rhode Island - reached the top ten.  New York was lower down the list, with a score in the 70's.  The lowest scores came out of Arkansas (60) and Mississippi (59).

To create the map, researchers looked at each state's scores for the SAT, ACT, AP and National Assessment of Educational Progress tests, using data from each state's department of education.  Each state was assigned a score based on the comparison, out of 100.

The top ranked states:

  1. New Hampshire 100states
  2. Massachusetts 98
  3. Minnesota 98
  4. Connecticut 96
  5. New Jersey 95
  6. Wisconsin 95
  7. Vermont 94
  8. North Dakota 92
  9. South Dakota 92
  10. Iowa 92
  11. Ohio 90
  12. Missouri 90
  13. Kansas 90
  14. Utah 89
  15. Pennsylvania 86
  16. Illinois 86


New Owners, Big Changes at Former “Big D”; Classic Rock Formats Differ by Geography

At the start of this week, Westport-based Connoisseur Media became the new owners of Connecticut’s oldest radio station, WDRC, owned for the past half-century by Buckley Broadcasting. The sale also included Buckley Connecticut stations WMMW AM in Meriden, WWCO AM in Waterbury and WSNG AM in Torrington, which have been added to Connoisseur stations in New Haven and Fairfield counties, WPLR, WYBC, the Fox and Star. At WDRC, virtually within minutes, several on-air personalities, the general manager and program director became former employees. The station’s website and Facebook changed, a new logo was launched, and a station with a heritage as one of the nation’s best know music stations as rock-n-roll took root in the 1960’s adopted a tagline that read “Classic Hits of the ‘70’s, ‘80’s and More.” Veteran broadcasters Mike Stevens, ‘Rockin’ Ron Sedaille, Floyd Wright and Grahame Winters were all dropped by WDRC’s new owners this week, along with Vice President/General Manager Eric Fahnoe. con_media2_6000px

The company’s largest cluster of stations is in the Northeast, predominantly in Connecticut, New York, New Jersey and Pennsylvania. But Connoisseur also owns stations in markets including Billings, MT, Rapid City, SD, Witchita, KS, Omaha, NE, and Bloomington, IL.

The station’s website now lists the quartet of Kim Zachary, Mike Lapitino, Allan Lamberti, and Rob Ray as on-air talent. Lapitino has been 99.1 WPLR’s afternoon air personality; Lamberti has handled the evening hours at thwdrc_main_logoe New Haven-based station. Lamberti, who has also been on air at Connoisseur’s Fairfield County classic rock station, 95.9 FOX, was on the afternoon drive shift at WDRC-FM. Chaz & AJ, the veteran morning drive duo, are heard simultaneously on both the New Haven and Fairfield County stations.

CEO Jeffrey D. Warshaw founded Connoisseur Communications Partners, LP, in 1993. Through strategic purchases of multiple single radio stations in medium to small sized radio markets, the company grew to 39 stations (owned or operated) prior to this week’s final sale of the Connecticut stations. Allan

In May, the company also announced plans to purchase WALK-AM/FM on Long Island, where the company already owns four radio stations. Among them are some Classic Rock formatted stations, although a national study released this week suggests that what listens hear in such a format varies across the country.

A new study by the well-respected data-driven website FiveThirtyEight “found that classic rock is more than just music from a certain era, and that it changes depending on where you live. What plays in New York — a disproportionate amount of Billy Joel, for example — won’t necessarily fly in San Antonio, which prefers Mötley Crüe.” The website studied the airplay of classic rock stations in the nation’s top 30 markets for a week, and analyzed what was played.

“Classic rock is heavily influenced by region, and in ways that are unexpected. For example, Los Angeles is playing Pearl Jam, a band most popular in the 1990s, five times more frequently than the rest of the country. Boston is playing the ’70s-era Allman Brothers six times more frequently.” WDRC was not included in their review of classic rock stations in the nation’s top markets.

The website reported that “the trend steadily held” for songs “of the ’70s and through the mid-’80s,” with the 10-year period from 1973 to 1982 accounting for 57 percent of all song plays. When ‘60’s songs were played, they were predominantly from the Beatles, the study summary noted. “Classic rock peaked — by song plays — in 1973.”

The analysis also found that “the top 25 most frequently played artists — the likes of Led Zeppelin, Van Halen and the Rolling Stones — together account for almost half of the spins on classic rock stations in the U.S. Another way of saying that is 5 percent of all the bands played on these stations made up nearly 50 percent of the song plays — which shows that there is at least a classic rock core.”

Staff changes are yet to be finalized, but at present Connoisseur ‘s General Manager for its stations in southern Connecticut, Kristin Okesson, will oversee the Hartford area stations. Okesson currently manages WPLR, WEZN, WFOX, and WYBC.

WDRC is considered the oldest radio station in Connecticut, begun in 1920 in New Haven by Franklin Doolittle Radio Corp., eventually relocating to Hartford (ultimately to 750 Main Street) and then to its current location at 869 Blue Hills Avenue in Bloomfield. WDRC-AM switched from a music to talk format decades ago, with WDRC-FM retaining the “Big D” style popularized in the ‘60’s and tweaked through the decades.

Nearly Two-Thirds of Americans Would Consider Coworking, If Only They Knew What It Was

Good news, bad news. That might be the best way to describe the results of a national survey by CoworkCT into public awareness of, and interest in, coworking. Nearly two-thirds of Americans (63%) said they would consider working in a collaborative work environment once they understood the concept (good news), but 60% said they had never heard of it (bad news). CoworkCT, a network of coworking communities whose members include small businesses, entrepreneurs, freelancers, and contractors who share space, resources, and ideas, conducted the national survey to better understand how familiar Americans are with coworking. Answer:  they're not.

A new website will be launched next week at www.coworkct.org, with more information about coworking in Connecticut.  Additional data, links and information will be added to the current test site, to assist in explaining the coworking concept to what the study suggests will be a receptive public.

According to the survey, the demographic groups most inclined to consider a coworking environment were 18 to 34 year olds (75%) and residents of the Northeast (72%). That is certainly true of ConneCoworkCT-Purple1-513x515cticut, which has seen growth in the concept in recent years, with coworking locations established in communities across the state, including Danbury Hackerspace, reSET (Hartford), the Grove (New Haven), B-Hive (Bridgeport), Stamford Innovation Center and Axis 901 (Manchester).  Each will have a presence on the news website, reflecting their growing community presence.

CoworkCT reports that the average cost of a coworking membership is $200 per month and the average cost of a private desk or office in a coworking facility is $350. The data from the survey showed that on average, people think the monthly cost of an individual coworking membership is $1,300.  Not even close.

Other key findings from the research include:

  • Nearly 40% of respondents said that collaboration with other professionals (not necessarily within their organization) was the most attractive feature of a coworking space, followed by 19% of respondents who chose affordability
  • Forty percent of respondents thought small businesses with fewer than 10 employees were best-suited for coworking, followed by 21% of respondents who said entrepreneurs wctnext-logo-finalould be the best fit
  • More than half of respondents (55%) said they thought it costs more than $500 per person per month for an individual space in a coworking environment

CoworkCT is a network of Connecticut coworking communities where members share space, resources, and ideas. The goal of the network is to educate the public on the benefits of coworking and increase general awareness for the collaborative work style.

CoworkCT is coordinated by CT Next, Connecticut’s innovation ecosystem supporting the success of companies and entrepreneurs by providing guidance, resources and networks to accelerate their growth. The statewide network “connects promising companies to mentors, collaborative work spaces, universities, vendors, suppliers and other like-minded entrepreneurs to help facilitate the growth and scalability of their business.”  CT Next is a program of CT Innovations, the leading source of financing and ongoing support for Connecticut’s innovative, growing companies.

Among the other coworking sites in Connecticut that are expected to be invited to the new CoworkCT website are SoNo Spaces in South Norwalk, Group 88 in Simsbury , and The Soundview, Colodesk and Comradity, all in Stamford.

The national data in the report was based on an ORC International telephone CARVAN® Omnibus survey conducted among a sample of 1,006 adults 18 and older living in the continental U.S. Interviews were completed from April 24 to 27, 2014. coworking

Report Calls for Transition to Livable Communities Across Connecticut

In Connecticut, more than one-third of the population is over the age of 50, and that proportion continues to increase. Connecticut’s Legislative Commission on Aging has issued “Connecticut for Lireport covervable Communities,” a new report to the state legislature which outlines more than 50 recommendations for communities looking to enhance livability. The Commission has also launched a website which includes a list of communities that are responding to the call for more livable communities, and suggests a wide range of actions that communities can take.

Connecticut is undergoing a permanent and historic transformation in its demographics, the report points out. Between 2010 and 2040, Connecticut’s population of people age 65 and older is projected to grow by 57 pelivability chartrcent, with less than 2 percent growth for people age 20 to 64 during the same period.

Livable communities are vibrant, inter-generational places that are easy to get around, according to the report. “They include affordable, appropriate housing options, supportive community features and services, and adequate mobility options. They foster independence, engage residents in civic and social life, and allow people to age in place. Done well, they benefit community residents across the lifespan.”

The 50-page report indicates that residents born in Connecticut today can expect to live to be 80.8 years old - the third highest life expectancy in the nation. A lengthy series of recommendations are highlighted in seven different areas: community engagement, health and well-being, housing, planning and zoning, safety and preparedness, social and support services, and transportation.

The recommendations include promoting opportunities for intergenerational collaboration, promoting in-home programs that improve health outcomes, creating a balanced transportation system that connects residents with health care services, and adopting policies that encourage incorporation of accessible housing features into new construction. The recommendations also include a call for municipal plans of conservation and development that include planning for older adults and individuals with disabilities to remain in their homes and communities, and building compact, mixed-use development “to encourage walking and eyes on the street.”

Creating livability requires “robust partnerships, long-range planning and sustained commitment.” To support those efforts the Legislative Commission on Aging plans to be:

  • Providing educational opportunities on livable communities for community leaders and other partners in Connecticut;
  • Creating partnerships to support the multi-faceted, multi-disciplinary endeavor of creating livable communities;
  • Supporting, inspiring and incentivizing communities to enhance livability; and developing policies to support aging in place

To help communities implement the recommendations over time, the Commission plans to:

  • Recognize localities that have implemented livable communities initiatives, pursuant to Public Act 14-73 (which established the livable communities initiative)
  • Expand partnerships across multiple sectors to advance livability, logo
  • Continue to convene municipal leaders, legislators and other thought leaders for statewide and regional forums on creating livability;
  • Continue to identify funding opportunities for municipal leaders, seeking to implement or sustain livable communities initiatives;
  • Work with partners to conduct asset mapping across all Connecticut communities, with the goal of helping each community understand its facilitators and barriers to developing livable communities;
  • Continue to research models in other states, nationally and internationally;
  • Work with the Connecticut General Assembly to identify and advance policy solutions that incentivize and inspire the creation of livable communities;
  • Provide technical assistance to Connecticut communities seeking to enhance or promote livability; and
  • Create town-specific data profiles to enable towns to enhance livability in a targeted and strategic fashion.

Among the communities listed on the new website as having best practices in place in parts of their towns or cities are Branford, Guilford, Madison, Bridgeport, Danbury, Darien, Enfield, Hartford, Middletown, New Haven, New Canaan, Norwalk, Seymour, and Torrington.  The Commission plans to proceed with "asset mapping across all Connecticut communities" and "continue to identify innovations, ideas, and best practices for implementing livability in the state. "

Serious Health Issues Faced by State's Asian Pacific American Residents, New Study Reveals

Stereotypes about a thriving and problem-free Asian Pacific population in Connecticut are just plain wrong, according to a new statewide Needs Assessment Study which reveals “high rates of physical and mental health problems” and serious concerns about access to proper food and healthcare, often exacerbated by communication breakdowns  and language barriers." The 21-page study, by the Connecticut Asian Pacific American Affairs Commission, is said to be the first of its kind in Connecticut.  The 2010 U.S. Census reported APA’s as one of the fastest growing minority populations, growing from 2.4 percent of Connecticut’s population in 2000 to 4.4 percent by 2010. The Census projects a steady increase of the APA population through 2050.

The Needs Assessment was developed in collaboration with three community-based organizations: the Khmer Health Advocates, Lao Association of Connecticut aapacc_logo5-300x151nd Connecticut Coalition of Mutual Assistance Associations. The project was also supported by the Asian American Studies Institute at UConn, the UConn School of Pharmacy and the UConn School of Social Work. It focused on housing, education, language access, employment, access to public resources, and medical and mental health.

More than 300 Southeast Asian Connecticut residents – all over age 18 - participated in the study, include just over one hundred from each of three ethnic groups: Cambodian, Lao, and Vietnamese. The study found clear distinctions between the populations in Connecticut, and researchers stressed that viewing the Asian Pacific American (APA) population in the state as one block of people does a disservice to them, and does not adequately respond to their needs.

Food Insecurity

Food insecurity was a “prominent problem,” according to the report. “Close to half reported that they often or sometimes couldn’t afford to eat balanced meals and 43 percent indicated that their food supplies ran out The survey also reviewed “several measures of food insecurity” and found “significant association” between the ethnic groups and “finding it too expensive to have a balanced meal often or sometimes,” as well as “going hungry for lack of sufficient money for food.”

The report also indicated that “all of the ethnic groups reported concern that some members of their community were socially isolated. In particular, they reported that those age 50 and older were most at risk for isolation.”

capitolHealthcare Concerns

Regarding healthcare, “nearly half experienced at least some difficulty in getting the healthcare they believed they needed,” the report indicated. In addition, “more than half of all participants reported experiencing a language barrier with their physician, and for those that needed an interpreter, 59 percent indicated that a professional interpreter was never or rarely available for healthcare visits.”

In regards to Southeast Asian Refugees, the report noted "chronic mental and physical health conditions follwoing a history of severe trauma," adding that "it is vital that primary care physicians and others treating these individuals screen for a wide range of physical health conditions as well as PTSD and depression."  At a State Capitol news conference releasing the report, Dr. Megan Berthold, Assistant Professor in the UConn School of Social Work, said that there is an "urgent need" to address these concerns, adding that the lack of communication can be "dangerous" and could "lead to misdiagnosis."

Among those who received prescriptions, nearly one-third said they did not fill it due to the expense, and among all surveyed, 17 percent “did not see a doctor when they felt they need to” during the past year due to the high cost.

Among the ethnic differences, a greater number of Vietnamese are smokers, Cambodians were “significantly more likely to be diagnosed with PTSD and depression,” and the Lao community indicating the least frequency of language barriers with physicians. Overall, however, the report indicated that “these communities continue to be underserved due to the limited to no resources available to focus on the cultural and linguistic needs of their communities.”

Numerous Recommendations

Included in the recommendations, the study report states that “service providers, state agencies and stakeholders are encouraged to partner with APA communities” in multiple ways, and calls for additional research that “can advance the needs of the APA population.” The series of 14 recommendations include greater training anreportd education, promoting preventative care, actively recruiting APA members in various professional fields, creating diversity in the workforce, translating materials into the most common APA languages, and raising awareness among the APA population regarding their rights.

It is hoped that Needs Assessment studies can focus on other APA ethnic groups, such as the Indian and Chinese communities, in future years. The APA population in Connecticut includes approximately 50 ethnic groups, sharing some similarities and having great diversity. As the initial study demonstrated, specific needs may vary – an important fact for policy makers and those working with this fast-growing aspect of the state’s population.

Among those commenting on the report during the news conference were Secretary of the State Denise Merrill, who was instrumental in the establishment of the Commission when she was House Majority Leader in the legislature, Marie Spivey, Chair of the State Commission on Health Equity, Tanya Hughes, Executive Director of the state's Commission on Human Rights and Opportunities, and Dr. William Howe, Chair of the Asian Pacific American Affairs Commission (see photo, at left). Theanvy Kuoch, Executive Directo of Khmer Health Advocates, noted that "working together we can improve outcomes for our community members while engaging them in their own care.  We have evidence that this approach also saves health care dollars."

The Asian Pacific American Affairs Commission was created in 2008 by an act of the Connecticut legislature.  The 21 member bipartisan commission oversees matters concerning hte Asian Pacific American population in Connecticut, and makes recommendations to the General Assembly and the Governor on the health, safety, education ,economic self-sufficiency and efforts to remain free of discrimination within the APA population in the state.

Woodstock is CT's Best Town for Teens, Analysis Shows

Last week, Connecticut by the Numbers reported that Connecticut’s under-18 population has declined during the past decade, and the state now ranks #37 in the nation in the percentage of residents less than 18 years-old. Now, the Hearst newspapers in Connecticut have researched the best towns for teens to live in the state. Topping the lwalkingist were the small towns of Woodstock, Cornwall, and Prospect. The Hearst analysis to determine the state’s best towns for teens, included five sets of numbers: the town’s four-year graduation rates for high schools; the percentage of the population between the ages of 15 and 19; the percentage of teens holding a job; teen pregnancy rates; and arrests numbers for teens charged with drug offenses and driving while intoxicated.

Here are Connecticut’s Top 10 Towns for Teens:

  1. Wood stock 84.3top towns
  2. Cornwall 82.5
  3. Prospect 82.0
  4. Mansfield 80.9
  5. Eastford 80.7
  6. Wolcott 80.6
  7. Brooklyn 80.2
  8. Scotland 80.0
  9. Bolton 79.9
  10. New Hartford 79.9

At the bottom of the list are the towns of Winchester (38.6), East Windsor (38.2) and Derby (19.3), the data indicates.  Not a single Southwestern Connecticut town cracked the top 10 of the list, according to the story published by Hearst Media. Newtown is the Southwestern Connecticut town with the highest score, coming in at No. 14, with a total score of 78.5 out of 100.

“Though idyllic towns dotting the landscape around Fairfield County and surrounding areas are often heralded as havens for raising children, many of the smaller, more affluent spots were ranked near the middle of the list or below: Ridgefield came in at No. 38 with a score of 74.6; New Canaan came in at No. 72 with 69.6 points; Darien was No. 81 with 68.4 points; Westport was No. 106 with 65.2 points; and Greenwich was No. 119 out of 169, with 62.3 points,” Hearts Media reported, in a story published by the Connecticut Post.

Connecticut’s Under-18 Population Ranks #37 in USA, Has Dropped During Past Decade

Where are the nation’s young people? Definitely not in New England, proportionally speaking. Nearly one-third of Utah’s residents - 31.3 percent - are under age 18, the highest percentage in the nation. In Connecticut, the under 18 population is just over one-fifth, at 22.4 percent, ranking the state at #37, and below the national average of 23.7 percent.

Connecticut, however, fares better than its New England neighbors in the percentage of population that is under age 18. The New Engalnd states of Rhode Island (20.8 percent), Maine (20.4 percent) and Vermont (20.1 percent) are ranked #48, #49, and #50 at the bottom of the list, with the smallest percentage of residents under age 18. Massachusetts ranked #44 and New Hampshire at #45.under_18_icon

Among the states with the highest percentage of their population under age 18, after Utah, are Texas at 27.1 percent, Idaho at 27 percent, Alaska at 26 percent and Georgia at 23.5 percent. The lowest percentage is in Washington, D.C. at 17.1 percent.

Connecticut’s percentage of residents under age 18 has dwindled during the past decade, from 24 percent in January 2004 to 23.6 in January 2008, to 22.4 in January 2012. Between May 2010 and May 2012 only Michigan, New Hampshire, Rhode Island and Vermont experienced a larger drop in the percentage of under 18 population.

New York (#42) and Pennsyunder 18lvania (#43) are also in the bottom ten. New Jersey has the highest percent of young people in the region, ranked at #30, with 23.2 percent.

Under 18 years old is defined as the percent of the total population under age 18. Data on age were collected as part of the American Community Survey (ACS) of the U.S. Census, a nationwide survey designed to provide communities with demographic, social, economic and housing data every year. It has an annual sample size of about 3 million addresses across the U.S. The data was reported by Bloomberg.com, using the latest ACS data through 2012, and was compliled in 2013.