UConn Applications Climb; Board of Regents Makes Commitments on Remediation at White House Summit

Who is attending college in Connecticut – and who is not – was the central topic of conversation in Storrs and at the White House Thursday.

At a White House summit on expanding college opportunity, the Connecticut State Colleges and Universities (ConnSCU) system was among more than three dozen colleges, universities and systems issuing promises of specific policy steps to be taken to improve college access and completion rates, with a particular focus on low-income students.   Connecticut Board of Regents President Gregory W. Gray was among those in attendance.

As part of the day-long summit, the White House released a 90-page “Commitments to Action” summary that included new commitments from over 100 colleges and universities and 40 organizations “to build on their existing efforts.”  The steps the institutions will be taking follow calls from President Obama, Education Secretary Arne Duncan and others to improve higher education opportunity in the United States, in response to the nation’s diminishing standing compared with other nations.

As education, business awhite hosuend nonprofit officials were meeting in Washington, the University of Connecticut, the state’s flagship institution, announced that the number of high school students seeking admission to UConn’s Storrs campus next fall has jumped significantly over last year’s figures, comprising a pool of potential freshmen with even higher average SAT scores and more diversity than previous years’ applicants.

More than 29,500 students applied as of Wednesday’s due date, a 10 percent increase over last year’s number, according to UConn officials. The number of minority applicants also increased by 16 percent – described as an important consideratiouconn-new-logon in UConn’s commitment to diversity.   Officials pointed out that the jump in UConn applications runs counter to national and regional trends in which declines in the number of high school graduates have caused many universities to see their applications and enrollments level off or decrease.
Enrollment Moving in Opposite Directions

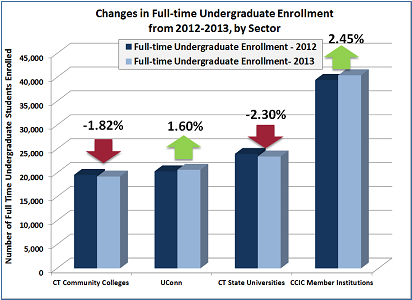
The Board of Regents system – which includes more than 90,000 students attending the state’s 17 public colleges and universities (except UConn, which is outside the system) – has seen the largest drop in students among the state’s public and private higher education sectors. At Connecticut's four state universities (Central, Eastern, Southern, Western), enrollment was down 2.2 percent to 34,062 this year compared to 2012, reflecting the continued losses in the number of part-time graduate students. Enrolllogo-connscument at the community colleges fell 2.1 percent to 56,977, reflecting losses in both full and part time students.

Full-time undergraduate enrollment among member institutions of the private Connecticut Conference of Independent Colleges (CCIC) rose by nearly 2.5 percent this past fall. In fact, nine of the 16 CCIC member institutions had an increase in enrollment and five of these institutions hit new enrollment records: Goodwin College, Quinnipiac University, Sacred Heart University, University of New Haven, and the University of Saint Joseph. In contrast, only five of twenty three public institutions showed an increase in enrollment.CCIC
According to Thursday’s newly released White House document, “Connecticut commits to planning an evaluation of pilot data to assess and improve upon efforts to implement remediation redesign throughout post-secondary institutions in the state.  Efforts will support improvements to remediation curriculum and practices on campuses.”  One of the panel discussion Thursday in Washington D.C. focused on the remediation issue, in which students graduating high school but not quite ready for college have traditionally taken non-credit bearing courses to prepare for college.

Focus on Remediation

The Connecticut legislature in 2012 passed a new law that requires public colleges to embed remedial education in credit-bearing courses, with extra tutoring and assistance for students who need remedial help. The bill had concerned some faculty at the institutions, who felt that abolishing all remedial classes would be unworkable, considering the learning deficiencies of some incoming students. Beginning with the Fall 2014 semester, the new law allows institutions to offer a student no more than one semester of non-embedded remedial support.

Connecticut wiCommitments to Actionll be hosting two upcoming events focusing on the remediation issue, the White House report indicated:
  • A“Multiple Measures Summit,” which will offer information and applicability of various methods of placement assessment for consideration of state community colleges and universities.
  • A “Remediation Conference,” which “will serve as an opportunity for state-wide collaboration outlining best practices of the piloting of intensive, embedded and transitional remedial education initiatives.  Data results will be shared along with ideas for scalability.”

The “Commitments to Action” document also notes that “The Board of Regents is currently conducting 139 pilots consisting of both math and English, intensive and embedded programming across the 17 ConnSCU institutions… Data will be analyzed by institution and system faculty/administration to highlight challenges for adaptation and strengths for duplication.”   It has been estimated that by 2020, 70 percent of Connecticut’s jobs will require post-secondary education.

Among UConn’s larger applicant pool, several stand-out programs – including engineering, business, digital media, and allied health sciences – are among the disciplines that saw significant increases in interest from the potential new UConn students who applied for admission.  With substantial financial support from the Governor and state legislature, UConn is investing in new faculty, updating its academic plan, and planning for the Next Generation Connecticut initiative to revolutionize its STEM (science, technology, engineering acollege enrollmentnd math) curricula.
UConn will begin notifying this year’s applicants with offers of admissions starting March 1, with the targeted new class of Storrs freshmen estimated to be around 3,550 students. The number of applicants has more than doubled since 2001, when the University received about 13,600 applications.

UConn’s Next Generation Connecticut initiative, a $1.5 billion 10-year state-funded investment, is expected to attract $270 million in research dollars, $527 million in new business activity, and fund the hiring of 259 new faculty members and the enrollment of an additional 6,580 undergraduate students, as well as the construction of new labs and facilities, expansion of digital media and risk management degree programs and development of student housing at UConn’s Stamford campus.

President Obama has set a goal of having the United States achieve the highest proportion of college graduates in the world by 2020.  The U.S., which was once ranked #1 in the world, has fallen from the top 10, and current projections indicate that decent will continue without corrective actions, such as those outlined by participants in the White House-led effort.

High Tech Firms Driving the National Economy; Connecticut Slowed as Other Regions Grew

If you’ve wondered why Connecticut has been devoting significantly increased economic development attention on high tech start-up businesses, encouraging and nurturing their development and offering financial incentives at every turn, a new national report on business start-ups in the sector may provide ample rationale.

High-tech startups are a key driver of job creation throughout the United States, according to research by technology policy coalition Engine and the EKauffman reportwing Marion Kauffman Foundation. The report, “Tech Starts: High-Technology Business Formation and Job Creation in the United States,” finds that high-tech startups are springing up at a higher rate than all private-sector businesses – and in more places around the nation.   A total of 384 metropolitan areas were analyzed, including four in Connecticut, using comprehensive data through 2010, the most recent available.

Relative to their share of firms in the economy, high tech is 23 percent more likely, and the ICT sector (Information and Communications Technology), as a segment of high tech, is 48 percent more likely, than the private sector as a whole to witness a new business formation.

usa Though they start lean, new high-tech companies grow rapidly in the early years, adding thousands of jobs along the way, according to the study findings. In fact, high-tech startup job creation is so robust that it more than makes up for the job destruction from early-stage businesses failures – a key distinction from the private sector as a whole where job losses from early-stage failures turns this group into net job destroyers, the report indicated.

However, as the density of high tech firms has grown in metropolitan areas across the country, it has not happened in Connecticut, as data reveals a reduction in the density of high tech firms in the state’s major metropolitan areas during the past two decades.  (The U.S. average is 1.0.)

New Haven-Milford’s start-up density went from 1.1 in 1990, when it was one of nearly 70 metropolitan areas above the national average, to .5 in 2010, while the ICT sector start-up density dropped from above average at 1.2 in 1990 to .5 twenty years later.    The Norwich-New London metropolitan area reflects a drop from 1.1 to .8 in high tech start-up density and 1.1 to .9 in the ICT sector comparing 1990 and 2010.

The data indicate that the Hartford-West Hartford-East Hartford area reflected decreases from .9 high tech start-up densities in 1990 to .6 in 2010, and .8 ICT start-up density in 1990 to .7 two decades later. The Bridgeport-Stamford-Norwalk metropolitan region showed a drop from 1.4 to .9 in high tech start-up density over the 20 year period, moving from above to below the national average, and a parallel drop of 1.6 to 1.1 in ICT start-up density.

The website Engine, which collaboratedstart up density in the report, observed that “Each of the high density metro areas has one of three characteristics, and some have a combination of them all: 1) They are well-known tech hubs with highly skilled workforces, 2) They have a strong defense or aerospace presence, and 3) They are university cities.”

The report noted that “”high-tech startups are being founded across the country fueling local and national economic growth…and are a pervasive force in communities throughout the country.”  The Top 10 Metro Areas for High-Tech Startup Density (1990 and 2010 data):

  1. Boulder, Colo.  (High-tech 4.0 to 6.3; ICT 4.7 to 6.1)
  2. Fort Collins-Loveland, Colo. (High-tech 1.0 to 3.2; ICT 1.1 to 2.6)
  3. San Jose-Sunnyvale-Santa Clara, Calif.  (High-tech 3.0 to 2.6: ICT 4.4 to 2.9)
  4. Cambridge-Newton-Framingham, Mass. (High-tech 2.0 to 2.4; ICT 2.0 to 2.3)
  5. Seattle, Wash.
  6. Denver, Colo.
  7. San Francisco, Calif.
  8. Washington-Arlington-Alexandria, DC-Va.-Md.
  9. Colorado Springs, Colo.
  10. Cheyenne, Wyo.

"This report confirms the dynamism of the technology sector and its disproportionate contributions to the U.S. economy. It also underscores the need for policies that enable and support that dynamism," said Dane Stangler, director of Research and Policy at the Kauffman Foundation.

The report, released earlier this year, used data from the Business Dynamics Statistics (BDS) series, which is compiled by the U.S. Census Bureau and tracks the annual number of new businesses (startups and new locations) from 1976 to 2011.  Ten of the 14 high-tech industries can be classified as information and communications technology (ICT), while the remaining four are in the disparate fields of pharmaceuticals, aerospace, engineering services and scientific research and development.

In explaining the report, Engine noted that “While high-tech firms start small, they scale rapidly in the early years. So much so that young high-tech firms--those aged one to five years--contribute positively to net job creation overall. The opposite is true across the private sector as a whole, where the substantial job losses stemming from early-stage business failures - about half of all firms fail in their first five years - make young firms as a whole net job destroyers. Even when we remove the job destruction from all early-stage firm failures, surviving young high-tech businesses create jobs at a rate twice that of surviving companies in the private sector as a whole.”

CT Boasts 2 of Nation’s Top 10 “Biggest Paycheck” Metro Regions

The Hartford-West Hartford-East Hartford metro area is #7 on the Forbes list of cities where people earn the biggest paychecks. And the Bridgeport-Stamford-Norwalk has earned an even higher slot in the top ten, at #4.

To identify the best-paying cities for jobs, Forbes turned to PayScale.com. Their experts looked at compensation data for professionals in the 100 largest Metropolitan Statistical Areas (based on 2010 population estimates by the Census), and identified the median pay for workers who hold at least a bachelor’s degree, across three experience levels: starting (5 or less years of experience), mid-career (10 or more years of experience) and overall (all years of experience).

The top three citieshartford, w e, according to Payscale economist Katie Bardaro, “are dominated by high wage industries like tech (both IT and Biotech), finance or oil.”  (Metro San Jose, San Francisco and Houston.) Unlike the top three, number 4 is dominated by the finance industry.

“There are a number of Fortune 500 corporate headquarters in this metropolitan area,” she says of the Bridgeport-Stamford-Norwalk metro area. “In fact, it is one of the largest financial districts in the Northeast.”

The median overall pay for mapworkers there is $71,800 annually, while average starting pay is $55,500 and mid-career is $96,900 a year, on average, the magazine reported.  Coming in at #7, the Hartford-West Hartford-East Hartford metro area has overall median pay of $69,200; starting median pay of $53,000; and mid-career median pay of $92,000.

Connecticut and California are the only states to have more than one metropolitan area in the top 10 – California regions finished at #1, #2, and #payscaleforbes10.

The overall median income for all college educated professionals across the U.S. is $61,900 a year, according to PayScale. The mean starting salary is $49,200, while the average mid-career pay is $84,800.

At the other end of the spectrum is the Youngstown-Warren-Boardman, Ohio-Penn., area - the worst-paying city in the U.S.  Here are the top 10, as identified by PayScale and Forbes:

1 San Jose-Sunnyvale-Santa Clara, Calif.

Overall median pay: $99,600 Starting median pay: $73,300 Mid-career median pay: $133,000

 2 San Francisco-Oakland-Fremont, Calif.

Overall median pay: $79,000

Starting median pay: $60,400

Mid-career median pay: $114,000

 3 Houston-Sugar Land-Baytown, Texas

Overall median pay: $71,900

Starting median pay: $56,400

Mid-career median pay: $99,000

4 Bridgeport-Stamford-Norwalk, Conn.

Overall median pay: $71,800

Starting median pay: $55,500

Mid-career median pay: $96,900

No. 5 Seattle-Tacoma-Bellevue, Wash.

Overall median pay: $71,200

Starting median pay: $53,900

 Mid-career median pay: $99,000

6 Washington-Arlington-Alexandria, D.C.-Va.-Md.-W.V.

Overall median pay: $70,200

Starting median pay: $54,800

Mid-career median pay: $104,000

7 Hartford-West Hartford-East Hartford, Conn.

Overall median pay: $69,200

Starting median pay: $53,000

Mid-career median pay: $92,000

8 Boston-Cambridge-Quincy, Mass.-N.H.

Overall median pay: $68,900

Starting median pay: $53,300

Mid-career median pay: $99,600

9 New York-Northern New Jersey-Long Island, N.Y.-N.J.

Overall median pay: $68,800

Starting median pay: $52,900

Mid-career median pay: $101,000

10 San Diego-Carlsbad-San Marcos, Calif.

Overall median pay: $67,900

Starting median pay: $51,700

Mid-career median pay: $96,500

Revitalizing CT Downtowns Earns Recognition, Success

For the Connecticut Main Street Center, a greater role in the advancement of downtowns across Connecticut is bringing both recognition and a facelift.  The organization, recently selected by the Connecticut Chapter of the American Planning Association (CCAPA) to receive the 2013 Education & Outreach Award for its "Come Home to Downtown" initiative, is launching a new branding initiative to match its more visible role supporting the state’s municipal main street initiatives.

Their new, updated  logo reflects the changing face of tCT Main Street Centerhe state’s downtowns, one that commands attention and respect for being forward-thinking while preserving the integrity and values of the past.  At CMSC, “we'll continue to promote the Four Point Approach to downtown management while also championing innovations in transit and sustainable design, promoting our local businesses and attractions, and advocating for mixed-use development that integrates housing with a diversity of uses, cultures and incomes.”

Through the Come Home to Downtown program, which just concluded its pilot year, CMSC and its team of expert consultants worked with community leaders, local stakeholders, and downtown management groups to educate them on the value and potential of mixed-use development. The organization also sought input and feedback from the public at community meetings held in each of the towns on the plans for redeveloping the model buildings and the demand for downtown housing.Come-Home-logo-150x150

CMSC chose three communities – Middletown, Torrington and Waterbury – as well as three property owners and their buildings as the focus of the program’s in augural year.  It is a pilot program aimed at facilitating viable, interesting housing opportunities while revitalizing downtown neighborhoods by providing customized technical assistance to communities and owners of small, under-utilized downtown properties.

CMSC worked with municipal officials and the building owners to develop viable redevelopment options including: determining what financing would likely be needed for redevelopment; performing an assessment of zoning and regulatory requirements; reviewing the downtown management function; and measuring the downtown's walkability. APA CT

Specific recommendations for improving the buildings, including a recommended floor plan designed to attract new residents and bring market rate housing downtown, was also provided to each property owner. Once rehabilitated, these buildings are expected to create 60 new units of rental housing in downtown Middletown, Torrington and Waterbury, as well as make approximately 25,000 square feet of commercial and retail space available. The total development cost to renovate all three buildings is estimated to be $11.4 million.

The 2013 Education & Outreach Award was presented to CMSC at CCAPA's Annual Award Luncheon last month. CCAPA is the Connecticut Chapter of the American Planning Association, the national organization of professional planners and citizens involved in planning communities. CCAPA is dedicated to advancing the practice of good planning in Connecticut. Every year, CCAPA solicits nominations for notable planning projects in a variety of categories from public service and citizen planners to physical development and plan implementation.

Connecticut Ranks #42 in Population Gain Between 2010 and 2013; New England Lags Nation

Connecticut’s population grew six-tenths of one percent between 2010 and 2013 according to estimates by the U.S. Census Bureau, ranking the state 42nd among the nation’s 50 states in population growth.  The state population, which was 3, 574,097 at the 2010 U.S. Census was estimated at 3,596,080 as of the official July 2013 estimate, announced at year’s end.

The 2013 estimates also show the nation's population grew by 2.4 percent in the three years since the 2010 Census, with the South and the West leading the expansion. The total for the 50 states, the District of Columbia and Puerto Rico rose from 308,745,538 in 2010 to an estimated 316,128,839 in July 2population graphic013.  Only Rhode Island lost population (1,056 people) during the period, and the Southern and Western states accounted for more than 80 percent of the growth nationwide.

The bottom twelve states in population growth – all under one percent - include five from New England:  Rhode Island, Maine, Vermont, New Hampshire and Connecticut.  The remainder are in the Mid-West.  Massachusetts population grew by 2.2 percent, New Jersey by 1.2 percent, and New York by 1.4 percent.

The South, the nation's largest population center, also had the highest percentage-point growth at 3.3 percent: CT populationfrom 114,555,744 in 2010 to an estimated 118,383,453 in 2013. The West was close behind, with a 3.2 percentage-point growth during the period, from 71,945,553 in the 2010 Census to an estimated 74,254,423 in July 2013.
The Midwest region had the smallest growth, at 0.9 percent: 66,927,001 people in 2010 to 67,547,890 in 2013, according to published reports. The population growth for the Northeast was 1.1 percent between 2010 and 2013, growing from 55,317,240 in 2010 to 55,943,073, according to the census estimates.

The bottom twelve, including Connecticut, saw increases of less than one percent, including Rhode Island’s drop in population, and Maine standing essentially even, adding less than 1,000 people.

  • Rhode Island -0.1people
  • Maine   0.0
  • Michigan 0.1
  • Vermont 0.1
  • West Virginia 0.1
  • Ohio 0.3
  • Illinois   0.4
  • New Hampshire 0.5
  • Connecticut 0.6
  • Pennsylvania 0.6
  • Mississippi 0.8
  • Missouri 0.9

The new figures from the Census Bureau shows Massachusetts is continuing to add to its population. The latest estimate as of July 1 puts the state's population at nearly 6.7 million, up by more than 47,000 from July, 2012.  Massachusetts' ranking is the 14th most populous state in the country.

New York remains the third most populous state in the nation -- behind California and Texas -- but the state's lead over fourth-place Florida continues to erode, according to 2013 population estimates. New York saw an increase of 1.4 percent from 19,378,102 people in the 2010 Census to 19,651,127 in the 2013 estimate, according to the bureau.

Florida's population in the 2010 Census was 18,801,310, about 576,000 fewer than New York's 2010 Census population. However, Florida's population rose an estimated 4 percent between 2010 and 2013, to 19,552,860 -- about 98,000 fewer than New York's 2013 population estimate.  Some have projected that Florida will overtake New York in population next year.

North Dakota, with its expanding oil and gas industry, led the growth chart between 2010 and 2013, at a 7.6 percent clip, including a 3.1 percent population increase in just the past year.

For the 12 months ending July 1, 2013, population growth nationwide was 0.71%, or just under 2.3 million people. That's the slowest since 1937, USA Today reported.  An aging Baby Boomer population and slower immigration combined for what the newspaper described as “nearly stagnant U.S. population growth,” the slowest pace since the Great Depression.

Maine and West Virginia were the only two states to lose population between 2012 and 2013.  The Census Bureau estimates that Connecticut picked up 4,315 residents in that 12-month period.

Small Business Friendliness in CT Improved to D+ in 2013, Data Shows

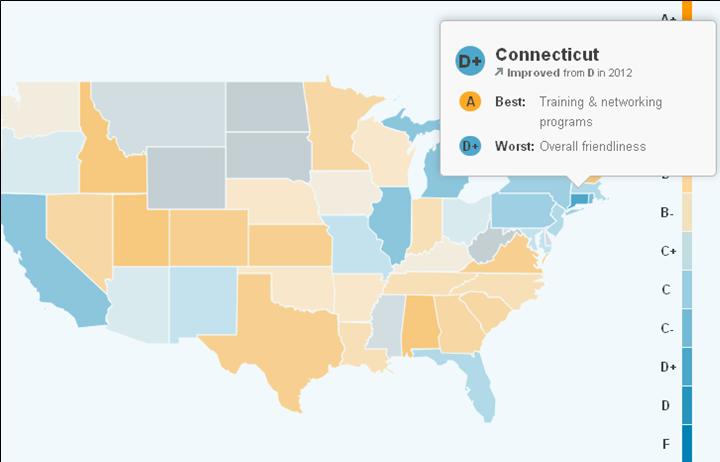
Connecticut’s small business climate is improving – slowly.  That’s according to the 2013 Small Business Friendliness Survey by Thumbtack.com, in partnership with the Ewing Marion Kauffman Foundation, which ranked the state #35 for overall small business friendliness.

The 2013 study draws upon data from over 7,000 small business owners nationwide and shows that Connecticut improved its overall grade slightly, rising from a 'D' in 2012 to a 'D+' in state mapthis year's study.

Although the state struggled overall, the study authors reported, it received high marks in several categories. Some of the key findings for Connecticut include:

Connecticut earned an 'A' for the state's small business training and networking programs, which ranked among the top-5 nationally. Business owners were critical of Connecticut's regulatory systems, giving the state a 'C' in this category, although this was an improvement from the 'D+' grade received last year.

Among its neighbors, Connecticut ranked just behind New York (which had trailed Connecticut in last year's study) and Massachusetts, but ahead of Rhode Island for overall small business-friendliness.

The state’s overall grades, and comparison with last year, in the 11 categories compared in the survey:

D+         Overall friendliness (D last year)

D+         Ease of starting a business  (C last year)

B            Ease of hiring (C last year)

C             Regulations  (D+ last year)

B-            Health & Safety  (C+ last year)CT welcomes you

C-            Employment, labor & hiring  (D+ last year)

C-            Tax code (D last year)

C             Licensing  (D+ last year)

D+          Environmental (D+ last year)

C-            Zoning (C+ last year)

A             Training & networking program

The study aims to learn what small businesses believe constitutes a healthy political and regulatory climate by having them rate how it is to do business in their specific location along various metrics.

Over 99% of U.S. employer firms qualify as small businesses, and they employ half of all private sector employees. Over the past two decades, almost two-thirds of net new private sector jobs have come from small businesses, and that number has accelerated in recent years.

The thumbtack survey also compared the age and size of the businesses with those of the general business population. The Small Business Adkauffman-details-logoministration reports that 69% of small businesses are at least two years old, and 51% are at least five years old.  The survey sample is very close to these numbers, with 76% over two years old and 57% at least five years old.
According to US Census data, 91.6% of small businesses have between one and four employees. Another 3.8% have 5-9 employees, and 4.6% have 10 or more employees. The survey respondents followed a very similar distribution: 89.3% have between one and four employees, 6.7% have 5-9 employees, and 4% have 10 or more employees.

Some of the key findings at the national level include:

  • Professional licensing requirements were 30 percent more important than taxes in determining a state's overall business-friendliness, confirming the findings from last year's study. Furthermore, this year's research revealed that 40 percent of U.S. small businesses are subject to licensing regulations by multiple jurisdictions or levels of government.
  • Utah was the top rated state, and Austin, TX was the top rated city. At the other end of the spectrum, Rhode Island and Newark, NJ were the lowest rated state and city.
  • The ease of obtaining health insurance was an important factor for many businesses. One-third of small business owners rated obtaining and keeping health insurance as "Very Difficult," versus only 6 percent who rated it "Very Easy."
  • Small businesses were relatively unconcerned with tax rates – more than half of small business owners felt they pay about the right share of taxes.

The top 10 states were Utah, Alabama, New Hampshire, Idaho, Texas, Virginia, Kansas, Colorado, South Carolina, Georgia, Minnesota, Nevada and North Carolina. Professional/nonprofessional services make up a large share of Thumbtack’s clients, so fewer manufacturers and retailers were surveyed, which may have impacted the survey results.

"It is critical to the economic health of every city and state to create an entrepreneur-friendly environment," said Dane Stangler, director of Research and Policy at the Kauffman Foundation. "Policymakers put themselves in the best position to encourage sustainable growth and long-term prosperity by listening to the voices of small business owners themselves."

College Coaches Are Highest Paid Public Employees in 40 of 50 States, Including CT

When UConn announced the hiring of Bob Diaco as new head football coach earlier this month few flinched at the compensation – a reported five-year $8 million contract.  Diaco, who served on the Notre Dame coaching staff as the defensive coordinator for the past four years and the assistant head coach for the past two, was the 2012 winner of the Frank Broyles Award, given to the top assistant college football coach in the country and was the first Irish assistant to receive the prestigious award. He was a semifinalist for the award in 2011.

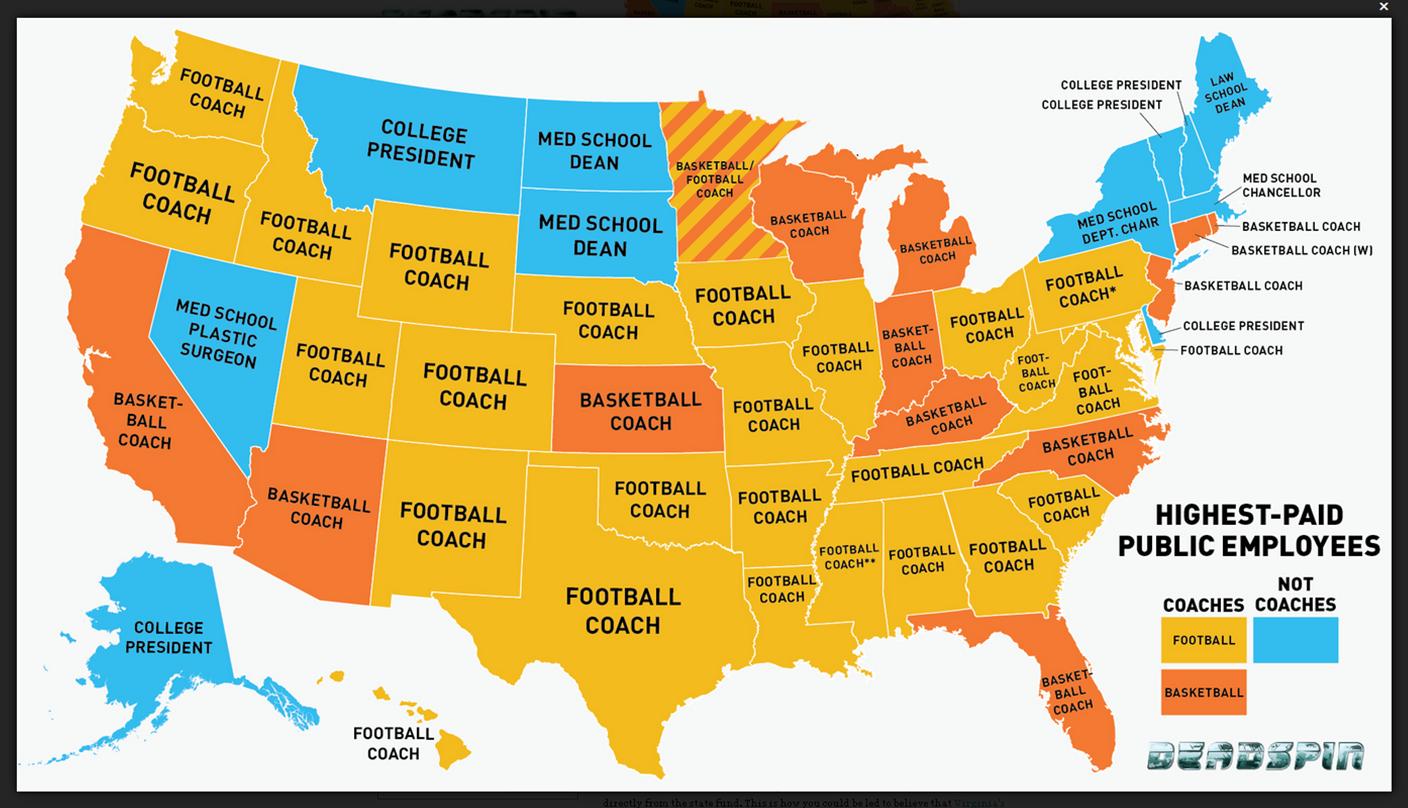
Earlier this year, the Yankee Institute for Public Policycoaches salaries compiled a list of the highest paid state employees, and three UConn coaches led the list:

  • 1. Calhoun, James A., Men's Basketball Head Coach, UConn $2,865,769
  • 2. Auriemma, Geno, Women's Basketball Head Coach, UConn $1,829,052
  • 3. Pasqualoni, Paul L., Football Head Coach, UConn $1,613,920  (dismissed as coach earlier this fall)

As it turns out, that is not unusual.  According to data compiled by the website Deadspin, the ranks of the highest-paid active public employees in states across the country include 27 football coaches, 13 basketball coaches, one hockey coach, and  10 state employees with responsibilities outside of athletics.  That’s 80 percent of the states with a public employee salary roster led by a coach.

Perhaps surprisingly, the states of New York, Massachusetts, Vermont, New Hampshire and Maine are among those where a college president, law school dean medical school dean or department chair top the state employee salary list.  In Rhode Island, it is the men’s basketball coach, and in Connecticut, with the retirement of Jim Calhoun, the leader is now women’s basketball coach Geno Auriemma.

Last December, UConn and head men's basketball coach Kevin Ollie, a 1995 UConn graduate,  announced a new agreement to run from January 1, 2013 through April 15, 2018.  Under the coaching contract, Ollie receives a base salary of $400,000 per calendar year and for 2013 he will receive $800,000 for institutional speaking engagements and media related appearances for a total of $1,200,000, according to the University's announcement. The payment for institutional speaking engagements will increase by $50,000 each year. Ollie's total compensation for each year of the agreement will be: 2013-$1,200,000; 2014-$1,250,000; 2015-$1,300,000; 2016-$1,325,000; 2017-$1,340,000; 2018-$502,500 (annualized from Jan. 1-April 15).

The website reports that “looking at data from 2011-2012, athletic departments at 99 major schools lost an average of $5 million once you take out revenue generated from "student fees" and "university subsidies.”

Rounding out the top 10 list in Connecticut, as of 2012:

  • 3. Onyiuke, Hilary Chief, Division of Neurosurgery UConn Health Center $1,030,732
  • 4. Nulsen, John Director, Center for Advanced Reproductive Services, UConn Health Center $917,373
  • 5. Makkar, Hanspaul Chief, Division of Pediatric Dermatology, UConn Health Center $916,600
  • 6. Whalen, James Vice Chair, Dermatology UConn Health Center $884,602
  • 7. Laurencin, Cato CEO, Connecticut Institute for Clinical and Translational Science, UConn Health Center, $701,576
  • 8. Herbst, Susan ,President, UConn $612,500
  • 9. McFadden, David, Chief, Department of Surgery, UConn Health Center $576,923
  • 10. Manuel, Warde Athletic Director UConn $551,305


Bridgeport-Stamford-Norwalk Above National Average in Sustaining Startups, Study Finds

A new report assessing trends in start-up companies in 40 major metropolitan areas in the U.S. over the past two decades has found that the Bridgeport-Stamford-Norwalk corridor has performed well compared with similar regions in weathering, and rebounding from, the national economic downturn’s impact on the level of start-ups.

The report by the Kauffman Foundation, “The Most Entrepreneurial Metropolitan Area?,” was recently presented to the U.S. Conference of Mayors on Entrepreneurship, the first such confestart uprence of municipal leaders devoted solely to exploring entrepreneurship.
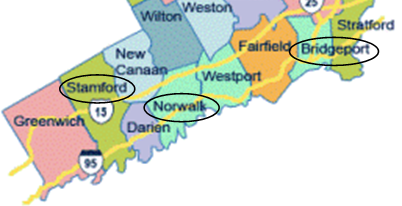
In reviewing Metropolitan Statistical Areas (MSA) with a population of between 500,000 and one million people, the report found that the Bridgeport-Stamford-Norwalk MSA placed “toward the top of the group, consistently above the year-to-year changes.”  In addition, the data indicate that Bridgeport-Stamford-Norwalk “did not fall as far during the (economic) downturn, so it appears to have fared slightly better.”

The paper compared the trends in the 40 metropolitan areas with high numbers of start-up businesses to the significant national downwkauffman-details-logoard trend in overall new firm formation starting after 2006.  Nationally, the trend reversed and started to recover in 2011. No metropolitan area escaped this downward trend, but there are differences among regions in the timing of the downturn and subsequent recovery.

In counting the number of times that the annual percentage change in start-up density for each of the MSA’s, within the same size class, five of the MSA’s – including Bridgeport-Stamford-Norwalk – were “above average 12 times thorough the period” reviewed. The others to attain that “level of consistency” were Tulsa, OK; Omaha-Council Bluffs, NE-IA; Little Rock-North Little Rock-Conway, AR; and Knoxville, TN.

map

The report also found that the largest MSAs – those with populations greater than 1 million – fared slightly better through the recession and have experienced slightly stronger recoveries, though none has returned to pre-downturn levels.

The report compared MSAs with relatively larger populations and high startup densities from among the nation’s 366 MSAs.  The MSAs were divided into four groups for purposes of comparison, those with greater than 1 million population, those with 500,001 to 1 million, those between 250,000 and 500,000, and those smaller than 250,000.

The federal government’s Office of Management and Budget (OMB) provides official definitions for MSAs in the United States:  densely populated areas with close economic ties.

LEGO KidsFest in Connecticut This Weekend, State Experiences Company’s Growth, Strength

There’s no mistaking the popularity of LEGO.  The colorful bricks are ever-present in playrooms, bedrooms, and under couch cushions everywhere.  The passion for the colorful bricks will be on display this weekend (Dec. 6-8, 2013)  in Connecticut when the LEGO Kidsfest returns to the Connecticut Convention Center in Hartford for a weekend of creativity and construction, concluding the year’s six-city tour, and the first time it’s been back in Connecticut in two years.  (Tickets for Saturday are already sold out, with limited availabilities for Friday and Sunday sessions. )KidsFest

Beyond this weekend’s event, the Connecticut connections to LEGO may be surprising.

The LEGO KidsFest is a nationally-traveling giant LEGO expo held over three days and filled with interactive, creative and educational activities for the whole family. Connecticut is central to the LEGO universe.  LEGO Systems, Inc. is the North American division of The LEGO Group, a privately-held, family-owned company based in Billund, Denmark, one of the world’s leading manufacturers of creatively educational play materials for children.  The LEGO Kidsfest, however, is produced by LIFE Marketing and Events, located in West Hartford.

LEGO floorAt each tour stop, the LEGO KidsFest partners with national and local organizations and businesses whose products, services and promotional efforts are kid-friendly and beneficial to attendees. Next year, the tour will again run in seven cities: North Carolina: February 28–March 2;  Michigan: April 25–27;  Alberta, Canada: May 16–18;  Georgia: June 27–29;  Texas: August 29–31;  Virginia: October 3–5; and Indiana: November 7–9.  In 2011, the KidsFest was held in five cities, and has steadily grown in popularity.  Sellouts have been regular occurrences throughout 2013.

In the new book “Brick by Brick:  How Lego Rewrote the Rules of Innovation and Conquered the Global Toy Industry,” published by Crown Business division of Random House, author David C. Robertson points out that Lego “is driven by two desires.  The first is to inspire imaginative play and creative expression in as many kids and kids-at-heart as possible, in as many ways as possible.”  The second is to out-innovate every company it comes up against.”

The book, which explores Lego’s resurgence from near oblivion over the past two decBrickbyBrickades, outlines the company’s trials, tribulations (including near-bankruptcy in 2003), innovations and success, observing that “The LEGO Group’s leaders believe that to discover the next big growth opportunity, the company must adhere to a fundamental truth about innovation:  the more experiments you launch, the more likely it is that one will strike gold.”   KIdsFest is but one example.
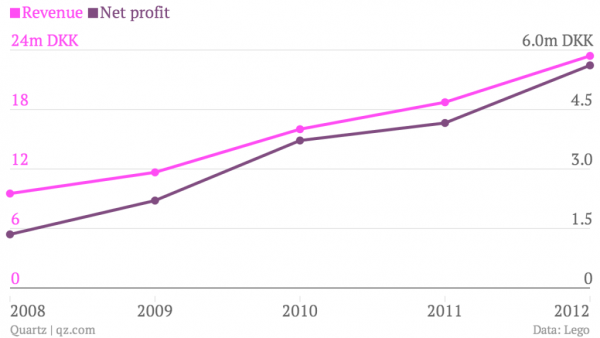
The company is also expanding is footprint in Connecticut, having announced earlier this year that it was leasing an additional 80,198 square feet in the Enfield Business Park.  The company eventually plans to add more than 200 employees.

“We have about 600 employees in Enfield currently, and the space will provide desks for an additional 250 — not all of whom will be hired immediately,” Michael McNally, Lego’s brand manager said in April. The company in 2011 started to reconfigure its former manufacturing space into administrative offices. The building houses workers in finance, human resources, information technology, consumer services, direct-to-consumer retail, as well as Lego Master Builders.

revenue-net-profit_chartbuilderLast month, it was reported that LEGO, already the second-biggest toy maker in the world, after Mattel, is continuing its expansion. In 2014, it will go from having one global headquarters, in Denmark, to five. The company is expanding its offices in London, Singapore, Shanghai and Enfield, Connecticut to form a network of global hubs.

The globe depicted on the cover of Robertson’s book, made of LEGO bricks, of course, is a fitting representation of the company’s growth – with Connecticut playing a noteworthy role.

Rising Star No More, Visitors Now Urged to DASH

Hartford’s downtown circulating bus – developed as an easily accessible means of moving tourists and convention goers around the city – was re-launched this fall with a new name, distinctive new coat of paint and renewed enthusiasm.

Previously operating as the Star Shuttle since September 2005, nearly 728,700 passengers have used the specially designated bus service, which connects the Connecticut Convention Center, the Riverfront, the CT Science Center, the Arts and Entertainment District, various restaurants, and downtown hotels.

Now, it has received an all-orange makeover, along with the new name – DASH.

The change follows the change in Hartford's tourism campaign branding from "New England's Rising Star" to "Hartford Has It" and continues as  a collaboratiodashn among CT TRANSIT, CT DOT, the City of Hartford, the Capitol Region Development Authority, the Hartford Business Improvement District, the Hartford Metro Alliance, and the Connecticut Convention & Sports Bureau.

A year ago, the Hartford Business Improvement District tapped the collective creativity of capitol region residents to help re-name the free downtown circulator.  Local resident David Ceder suggested “dash”. Ceder explained "I am excidashart_webted the time has come to showcase the rebranding and new shuttle name! I chose "dash" not only because of the acronym (Downtown Area SHuttle) but also because it's an action word --"dash," to me, is exciting, inviting, and invokes you to hop on and discover Downtown."

The bright orange DASH bus has been accompanied by updated signs downtown and an interactive map to help passengers know where to go to get on the free shuttle. Regular DASH service operates every weekday from 7:00 a.m. to 7:00 p.m., departing every 15 minutes from the Connecticut Convention Center.

During major downtown events, enhancements may include later evening service on weekdays, as well as service on Saturdays and Sundays. The specific services planned for each major event are posted on the CT TRANSIT website. The dash Shuttle does not operate on weekends when there is no downtown event scheduled.  The free shuttle also offers convenient connections to both the Bradley Flyer bus and to regular local CT TRANSIT bus service.

An out-of-town visitor to a convention earlier this year – before the name change -  praised the service. "My daughter and I ...have been using the Shuttle extensively to navigate the conference sites. I cannot say enough good things about ALL of the bus drivers. Thanks for making our trip so much fun."

Should you be  wondering, two buses have received the DASH makeover, adash mapnd the vehicles alternate in providing the service.  The DASH shuttle is a service of the CT Department of Transportation and operated by CT TRANSIT. Information on the route and extended service hours can be found at www.cttransit.com.