
Connecticut’s Taxpayer Burden Among Nation’s Highest, Report Finds
/The states with low tax burdens are experiencing net immigration, and states with high tax burdens are experiencing high net outmigration, according to an analysis by Governing magazine of data from the Tax Foundation. Connecticut, which the publication lists as having among the nation’s highest taxpayer burdens, is seeing more residents leaving than arriving, the data indicates. The 15 states with high “Tax Burdens and Taxpayer Burdens” are, ranked from highest to lowest, Connecticut, New Jersey, New York, California, Illinois, Massachusetts, Maryland, Hawaii, Rhode Island, Delaware, Vermont, Kentucky, Michigan, Pennsylvania and West Virginia.
Here’s how Governing described the Tax Foundation’s latest annual study: “Across the 50 states, the share of revenue coming from local and state taxes varies significantly, as does the mix of property, sales and income taxes. When measuring the burden imposed on a given state’s residents by all state and local taxes, one cannot merely look to collections figures for the governments located within state borders. There is a significant amount of tax shifting across state lines, and this shifting is not uniform. Further, this shifting should not be ignored when attempting to understand the burden faced by taxpayers within a state.”
That is especially true in Connecticut, where significant numbers of residents work in New York, Massachusetts and Rhode Island. Addressing these issues, the Tax Foundation estimates the total state and local tax burdens arising from all sources as a share of state income. The Tax Foundation calls this statistic the "State-Local Tax Burden." In the Tax Foundation's most recent study, covering fiscal 2011, the "State-Local Tax Burden" ranged from a low of 6.9 percent (Wyoming) to a high of 12.6 percent (New York).
According to the report, “New York residents experienced the highest burden at 12.6 percent of income. Next were New Jersey and Connecticut, where residents paid 12.3 and 11.9 percent, respectively. Rounding out the top ten in highest state-local burdens are California, Wisconsin, Minnesota, Maryland, Rhode Island, Vermont, and Pennsylvania. Connecticut taxpayers’ burden has risen 0.8 percentage points from 11.1 percent in 1977 to 11.9 percent in 2011, putting the state in third place.
New York, New Jersey, and Connecticut have occupied the top three spots on the list since 2005. The report notes that “this may be partially attributed to high levels of expenditures which must be sustained by high levels of revenue. Further, in the case of Connecticut and New Jersey, relatively high tax payments to out-of-state governments add to already high in-state payments. This is likely related to the fact that these are high income states that pay high levels of capital gains. High levels of capital gains will result in residents paying an increased share of other states’ business taxes.”
The report also indicates that “Maine and Vermont have the largest shares of vacation homes in the country, and they collect a sizeable fraction of their property tax revenue on those properties, mostly from residents of Connecticut, Massachusetts, and other New England states.”
The organization Truth in Accounting calculates "Taxpayer Burden" -- the per-taxpayer share of the money needed (or available) to pay bills. In fiscal 2011 (the same year as the latest Tax Foundation results), the "Taxpayer Burden" ranged from a low of minus-$34,100 (a surplus, in Alaska) to a high of $50,900 (in Connecticut).
 Added Bill Bergman, the director of research for Truth in Accounting, a Chicago-based nonprofit working to “promote truthful, timely and transparent government financial reporting”: “States that rank high on both Tax Burden and Taxpayer Burden face another challenge. The third whammy is that citizens in these states are leaving for other states, taking their taxable spending, property and income with them. It seems reasonable to suspect that their choice to leave may be directly or indirectly related to state fiscal conditions.”
Nationally, state and local tax burdens dropped in 2011 as compared with 2010, largely attributable to incomes rising that year for the first time since 2008, Governing reported. The study methodology noted that “when Connecticut residents work in New York City and pay income tax to both the state and the city, the Census Bureau will count those amounts as New York tax collections, but we count them as part of the tax burden of Connecticut’s residents.”
Since 1937, the Tax Foundation’s “research, insightful analysis, and engaged experts have informed smarter tax policy at the federal, state, and local levels” the organization’s website explains.
 The first Knights game took place on April 11, 2014. (photo at left) The stadium features a two-level club with skyline views as well as a VIP, climate-controlled club with full service bar. In addition to corporate suites, there are 987 club seats at the new Charlotte stadium. Of those, 170 on the upper level sell for $41.50 per game, or nearly $3,000 per season. The remaining 817 club seats, at $21 per game, sell for about $1,500 annually. All of the club seats were sold out 10 months prior to the season opener, according to the Knights


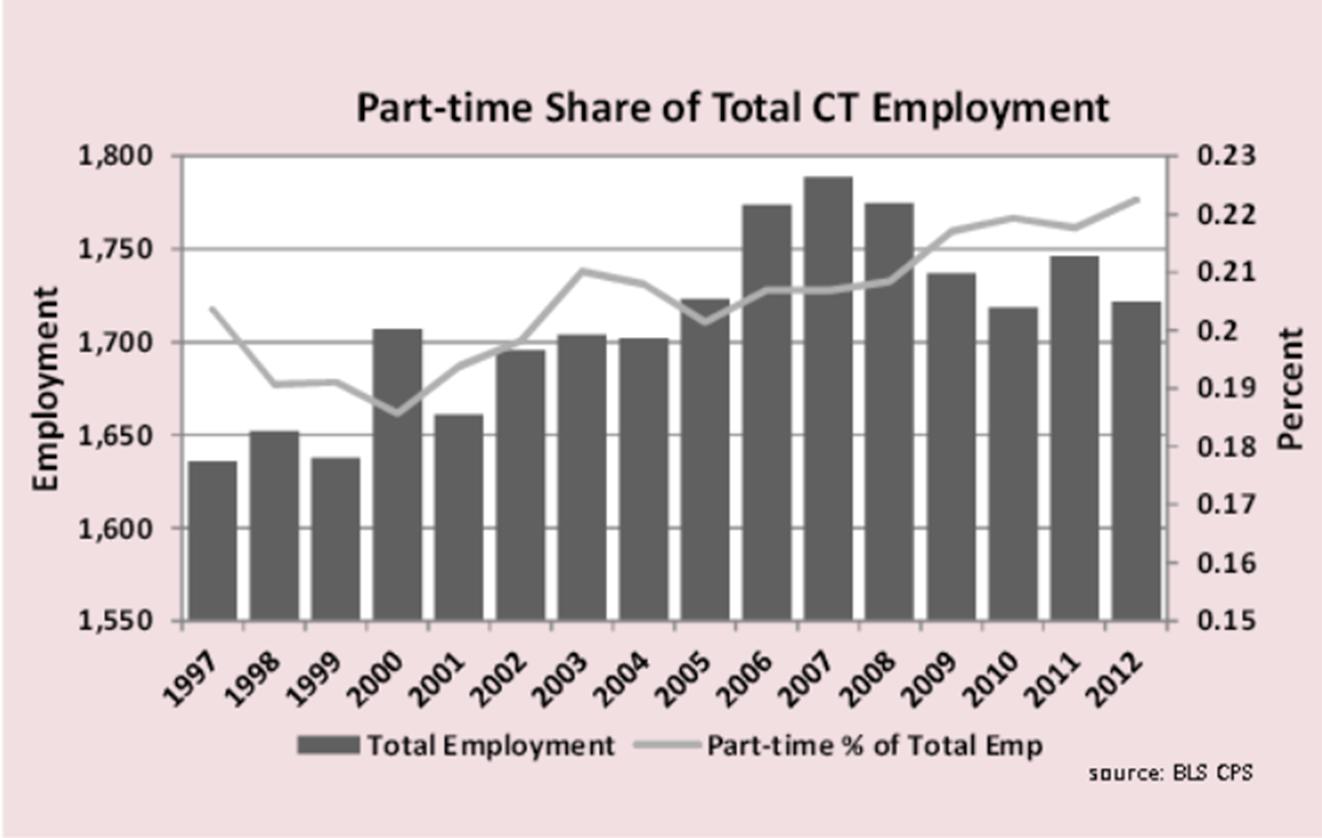
 a and the basis for the analysis. The breakdown of hours worked shows that Connecticut has less under 35 hours per week employment than other New England states but more than the Northeast region overall.
Part-time employment was 23.3% of all New England employment in 2012, higher than any other census division in the country. The other eight census divisions averaged 19.3% with the West- South Central division lowest at 16.4%.
a and the basis for the analysis. The breakdown of hours worked shows that Connecticut has less under 35 hours per week employment than other New England states but more than the Northeast region overall.
Part-time employment was 23.3% of all New England employment in 2012, higher than any other census division in the country. The other eight census divisions averaged 19.3% with the West- South Central division lowest at 16.4%.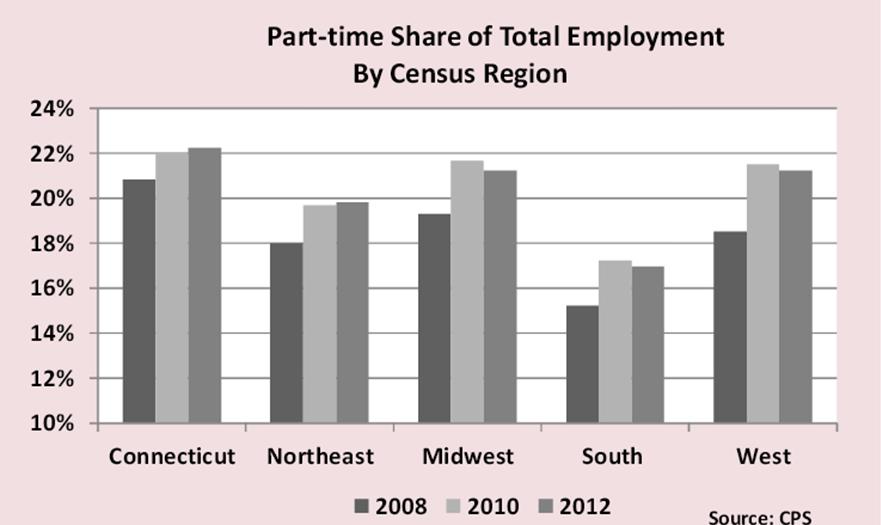
 rnment with the mission to create strong libraries and museums that connect people with information and ideas, is celebrating its 20th year of saluting institutions that make a difference for individuals, families and communities.
 0 animals, including such species as beluga whales and the endangered African Penguin.

 s of Excellence
 based on their level of income inequality and identified the 50 with the greatest inequality. T
 an estimated
  as new spending from tax revenues. The other study says that tobacco taxes offer a how-to road map for policy makers.
 ished this month, researchers ran a simulation of the impact of 20-percent soda tax in Illinois and California—selected for regional differences—and found slight employment increases would occur, but the net effect would be close to nothing. They found that people choose to spend their money on other things, not to forego spending entirely, and that employment gains in other sectors of the economy far outweigh the job losses for soda makers, National Journal reported.


 In addition to Davidson, expert panelists participating include Carissa Ganelli, Founder & CEO, LightningBuy; Drue Hontz, Founder & President, KAZARK, Inc.; John Nobile, Founder & President, Tangen Biosciences; and Nadav Ullman, Founder & CEO, Dashride.
 nt of strategy and operations for Global Market Development in Qualcomm Technologies, Inc. In this role, he handles reporting and operations as well as executing on strategic global business initiatives. In addition, Davidson is senior vice president of investor relations where he serves as the primary liaison with the investment community and Qualcomm shareholders. Davidson has more than 25 years of experience in technical sales, marketing and general management roles in the telecommunications industry.
 naging Partner & Principal, New England Consulting Group.