School Suspensions Down, But Students of Color, Low Income Receive Disproportionate Share

There’s good news and bad news in a new analysis of suspensions, expulsions, and arrests of students in Connecticut schools.  The report, by Connecticut Voices for Children, found that overall significantly fewer students have been excluded from the classroom in recent years, but that suspension, expulsion and arrest rates were much higher for minority students, special education students, and students from poorer districts.arrested 
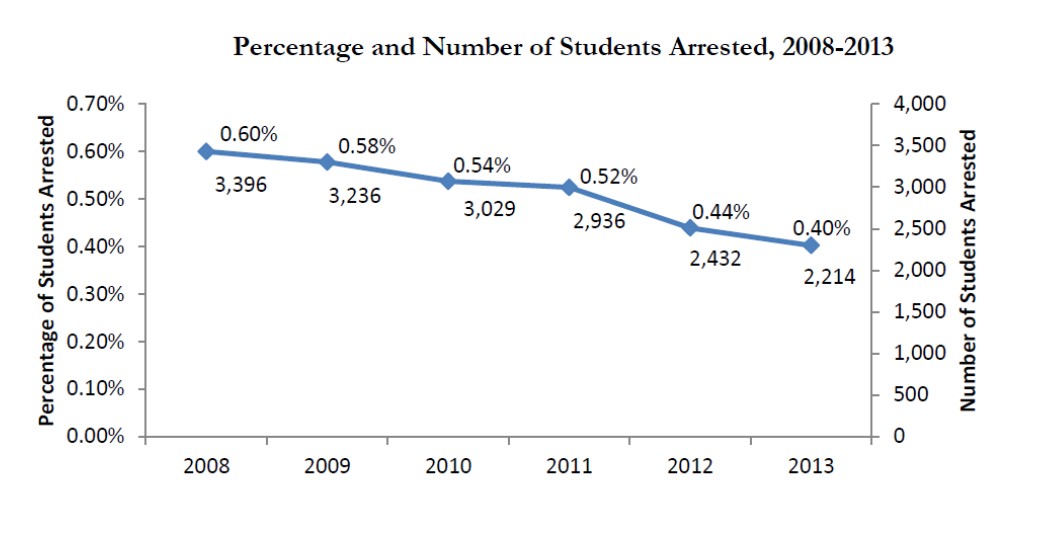
The report also found that “many of these discipline measures were used for behaviors that were probably not criminal and could likely have been handled within the school.”  Stressing that “children learn best when they are in school,” the report indicated that “arrests, expulsions, and suspensions are often costly, ineffective, and unnecessary.”

Connecticut Voices for Children is a research and advocacy organization that works to improve opportunities for the state’s children, youth and families. The report, “Keeping Kids in Class: School Discipline in Connecticut, 2008-2013,” uses data provided by local school districts, found that in 2013, 7.4 percent of all students received at least one expulsion or suspension, down from 8.5 percent as recently as 2011.

First, the good news:

  • The number of students arrested, expelled, and suspended in Connecticut has decreased significantly in recent years. In the 2013 school year, Connecticut schools arrested 35 percent fewer students, expelled 31 percent fewer students, and gave out of school suspensions to 47 percent fewer students than in 2008.

The not-so-good news:

  • Despite the overall reduction in these “exclusionary” school discipline practices, many students are still removed from the classroom for non-criminal behaviors that could, in the view of Connecticut Voices, be managed in the classroom. “School policy violations” – such as skipping class, insubordination, or using profanity – were involved in 9 percent of student arrests, 6 percent of expulsions, 50 percent of out-of-school suspensions, and 79 percent of in-school suspensions in 2013.report

From 2008-2013 the percentage of students suspended out-of-school fell from 4.9% to 2.7%. During the same time period, the percentage of students suspended in-school increased from 4.9% to 5.2%.

Of particular concern was the data related to students of color and those with limited financial resources or disability:

  • In 2013, black students were 4.7 times more likely to be arrested, 4.9 times more likely to be expelled, and 6.5 times more likely to be suspended out-of-school than white students.
  • Hispanic students were 3.1 times more likely to be arrested, 2.6 times more likely to be expelled, and 4.4 times more likely to be suspended out-of-school than white students.
  • Special education students were arrested at 3 times the rate of general education students, and they were 1.8 times more likely to be expelled, and 2.6 times more likely to receive out-of-school suspensions.
  • Students in the poorest urban areas were arrested nearly 23 times more often, expelled over 17 times more often, and suspended out-of-school 24 times more often than students in the wealthiest suburban areas.suspensions

Based on the data, the report makes a series of recommendations for the state Department of Education and policymakers to consider, including:

  • Require districts with police stationed in schools to create a memorandum of agreement between the schools and police that sets ground rules concerning arrests. Promote police and educator training, such as that provided by the state’s Juvenile Justice Advisory Committee, which offers instruction to officers and educators in understanding and responding productively to adolescent behavior.
  • Implement preventive strategies and alternative discipline measures to reduce racial and other disparities and ensure those excluded from school are provided equal opportunities.
  • Establish and support community collaborations across the state. National studies show that engaging all stakeholders in the discipline process positively impacts student behavior and achievement.

The top 10 reasons for expulsion in 2013:  1) drug/alcohol/tobacco, 2) weapons, 3) fighting/battery, 4) personally threatening behavior, 5) school policy violations, 6) theft/theft related behaviors, 7) verbal confrontation/conduct unbecoming 8) violent crimes against persons, 9) sexually related behavior, and 10) property damage.

The report concludes that “the disproportionate rate by which students of color and students from poorer districts are excluded from school may in fact contribute to widening the achievement gap; students from less privileged backgrounds will continue to perform worse than their more advantaged peers if they are excluded from the classroom in the first place.”

The report also recommends expanding access to behavioral and mental health services and utilize Juvenile Review Boards (JRBs), locally-run groups that offer a diversionary alternative to the court system for youth who have committed minor delinquent acts or misdemeanors.  In addition, it calls for improving data collection by clearly defining “student arrests” (not currently defined by the state) and collecting and publishing data on all student arrests (currently not required for all incidents resulting in arrests).

“This report tells us that many schools in Connecticut have reformed their disciplinary practices and reduced student arrests, expulsions and out-of-school suspensions,” said Ellen Shemitz, Executive Director of Connecticut Voices for Children. “Yet these reforms have not benefited all children equally. How can we hope to reduce the yawning achievement gap when school disciplinary practices push minority children out of school at disproportionate rates?”

West Hartford, North Haven Hearing Opposition to Native American Nicknames for School Athletics

West Hartford is the latest community to consider whether the time has come to change the name of its high school sports teams, in order to drop longstanding names that may be insensitive to Native American culture.  The town, which has two high schools – one nicknamed the Warriors, the other ncalled the Chieftans – will hold a public forum to discuss the mascots on Thursday, Feb. 12. Last month in North Haven, controversy erupted regarding the Indians name for its high school teams, with competing petitions urging a name change and retention of the name surfacing online.  The change.org petition urging a change has 728 signatures to date, with the goal of “formally get the attention of the North Haven Board of Education, allow for some serious discussion on this issue.”  The petition advocating continuing tradition and retention of “Indians” has amassed 2,067 signatures on-line.hall, conard

The issue has come up sporadically around the state for more than a decade, and has intensified in West Hartford, North Haven and across the state as part of a wider national conversation about whether Native American symbols and mascots are inherently racist and therefore inappropriate.

West Hartford’s Hall High School has dropped the use of an American Indian head as its logo, though the warrior remains the school mascot, the Hartford Courant has reported. Conard's mascot is the chieftain, and although sports teams have gradually phased out use of the American Indian head logo, the image still exists elsewhere, such as the masthead of the student newspaper, "The PowWow." The student-led pep club at Hall is also named "The Reservation," and Conard's pep club is "The Tribe."  The website we-ha.com has reported that Conard students, teachers, coaches, and alumni have elicited the opinion of the Mohegan tribal leadership regarding the West Hartford high school’s mascot and name, and the name was discussed by students last December as part of a Human Rights Day program.AUoZA5as

Derby High Schools’ teams continue to be known as the “Red Raiders,” using an arrowhead logo, and Killingly High School's teams are known as the Redmen.  In Torrington, the schools’ website refer tDHSbanner7o their teams as “Raiders” – not “Red Raiders.”   Promoting their 2014 Thanksgiving Day football rivalry, the Torrington website said “Come out to see the Raiders take on the Watertown Indians in the 49th renewal of this holiday classic. The Raiders have held off the Indian attack the past two seasons…”

Norwich Technical High School, continues to use the nickname Warriors for its baseball, track, tennis, volleyball and most other school teams.  In some instances, Norwich Tech has combined teams with other local high schools, resulting in students playing on the Crusaders (football) or Saints (wrestling).indians

Just six months ago, the New Haven Register reported that “at least 23 high school teams in the state have names associated with Native Americans that could be considered offensive.

Northwest Catholic High School in West Hartford told WFSB-TV last spring that the school’s teams no longer officially use the name “Indians,” but as of this week, the schools website continued to feature its parent booster club as the “Tomahawk Club.” At Glastonbury High School, the athletics teams are called the “Tomahawks.”

The Guilford Public Schools Student-Athlete and Parent Handbook for 2013-2014 includes the following explanation at the front of the book:  “Guilford High School is proud of its heritage and its friendly relations with the Native Americans that inhabited the land we now call Guilford. To demonstrate this pride, Guilford High School began to use Indian names and symbols for its yearbooks and athletic teams during the l940's. We believe it is our obligation as an educational institution to inform our public about the history of our community and the role the Native American played. The use of the Indian symbol is meant to serve as a reminder of our past and should be held in the highest regard at all times.”raiders

The unofficial list of high school team nicknames that are receiving attention regarding their athletic team nicknames or mascots, in addition to those described above:

Canton High School (Warriors), Enfield High School (Raiders), Farmington High School (Indians), Guilford High School (Indians),  H.C. Wilcox Technical (Meriden) High School (Indians),Killingly High School (Redmen), ManG tomahawk Drawstring bagchester High School (Indians), Montville High School (Indians), and Newington High School (Indians).  Also, the Nonnewaug (Woodbury) High School (Chiefs), North Haven Senior High School (Indians),  RHAM Junior Senior High School (Sachems), Valley Regional (Deep River) High School (Warriors), Wamogo (Litchfield) Regional High School (Warriors), Watertown High School (Indians), Wilcox Technical (Meriden) High School (Indians), Wilton High School (Warriors), Windsor High School (Warriors), Windsor Locks High School (Raiders).


Northern New England States Anticipate Higher Lyme Disease Levels for 2014

Officials in Northern New England are anticipating record or near-record levels of Lyme Disease in their states during 2014 when the final numbers are tallied. Maine Center for Disease Control and Prevention Director Sheila Pinette recently told the Associated Press that when the 2014 stats are in, the state is likely to exceed the record high of 1,384 cases of the illness in 2013.  Vermont officials say their state is on track for its second- or third-highest total on record in 2014, following the 2013 high of 671, and New Hampshire officials say the numbers there are in line with recent years, which included a record-high in 2013.  Official data will be released in the coming months.LYME

Connecticut’s 2014 stats are due in March, and officials did not comment on what they are anticipating.  In 2013, Connecticut had 2,108 confirmed cases, according to the Department of Public Health, and a total of 2,918 confirmed or probable cases of Lyme disease were reported.   The largest number were in Fairfield County, New London County and New Haven County.

It is unclear whether better reporting methods or environmental factors – or both – are behind the apparent growing numbers in New England. Symptoms can include fatigue, fever, skin rashes, and a headache. Left untreated, it can lead to arthritis, facial palsy, and problems with the nervous system.  tick

Last summer, the Centers for Disease Control and Prevention reported that an estimated 300,000 Americans get the tick-borne disease every year, PBS reported. The number of cases has been increasing.

Most instances of Lyme Disease are concentrated in the Northeast, with 95 percent of them in 14 states, including Connecticut, along with Delaware, Maine, Maryland, Massachusetts, Minnesota, New Hampshire, New Jersey, New York, Pennsylvania, Rhode Island, Vermont, Virginia and Wisconsin.

In 2013, it was the 5th most common Nationally Notifiable disease, according to the CDC. Last year, the Pennsylvania legislature established a task force that will operate within the Pennsylvania Department of Health to help the department develop better surveillance, educate the public about Lyme disease, and advise health care professionals.

The 2,918 cases in Connecticut in 2013 reflected an increase from 2,660 in 2012, but a drop from 3,041 cases in 2011 and 3,068 in 2010.

lyme

Plans Unfold for National Museum Store Conference in Hartford in April

If you’ve ever made a purchase at a museum store and wondered about how the merchandise was selected or the store operates, there will be no shortage of experts from the industry in Hartford this spring.  The 60th Annual Museum Store Association Retail Conference & Expo will be held April 17-20, 2015 at the Connecticut Convention Center. The event is the only conference and expo specifically created for retailers at museums, historic sites, botanic gardens, aquariums, zoos, libraries and more. The 2015 MSA Retail Conference & Expo is designed to help nonprofit retail professionals by providing four days of education sessions featuring industry experts and opportunities to connect with vendors who offer products matched with the museum store industry.museum

It will be the first time the national conference will be in Hartford.  In recent years the host cities were Houston, Los Angeles, New Orleans and Chicago.  The national meeting in Hartford will include a “retail boot camp” and a tour of the Mark Twain House and Harriet Beecher Stowe House.

The MSA website points out that “learning sessions are presented by the leading thinkers in nonprofit retailing who share the knowledge you need to run your store, meet the needs of management, make the most out of challenges, be a leader and through retailing contribute to your institution’s brand and extend the experience of your visitors.”Balancing-Act-600x175-indd.jpg

Manager of the Museum Shop at the Wadsworth Atheneum Museum of Art, immediate past MSA Board President Stacey Stachow, said when Hartford was selected to host the conference, “Connecticut has so much to offer with its rich cultural history, so many museums and things to do that relate to our members.”   In addition to the Wadsworth Atheneum, other MSA member institutions in the area include the Connecticut Historical Society Museum & Library, Harriet Beecher Stowe House, New Britain Museum of American Art and Friends of Dinosaur State Park and Arboretum.

The opening keynote speaker will be Roderick Buchanan, director of buying and retail at the British Museum Company.  The closing keynote speaker will be Dick Durrance, an award-winning National Geographic photographer and U.S. Army combat photographer during the Vietnam War. MSA-Logo_sm

Among the industry issues that will be discussed is fair trade, which will be the focus of a panel discussion.  The conference website points out that “as consumers are increasingly interested in the origin of the goods they purchase, the fair trade movement is gaining momentum and is affecting buying in the museum store world. Expert panelists will offer insights into critical aspects of the fair trade industry, including who benefits from fair trade, why retailers should buy fair trade, and questions that should be asked about business practices in order to ensure that products are indeed fair trade.”

Other sessions include presentations on pop-up shops, museum store launches, visual merchandizing, ecommerce, the influence of various cultures, and the importance of museum stores in the overall experience of museum visitors.

The four-day event is expected to bring in 900 participants downtown utilizing an estimated 1,130 room nights, according to organizers. There will be 21 educational sessions, and more than 200 vendors on hand.  Approximately 800 institutions are part of MSA with more than 1200 individual members representing those institutions.

Stores in cultural institutions are different from typical retail operations in several ways, the organization points out. “These retail operations play a vital role in supporting the institution’s educational mission. They offer products that provide visitors with mementos and educational materials directly related to their cultural experience.’  Purchases made at museum stores provide important financial support for the institution, officials emphasize.

FCC “Enforcement Hold” of WTIC-AM License Renewal Continues in New Year

The license renewal application of WTIC-AM, filed more than a year ago, remains on “enforcement hold” at the Federal Communications Commission, as the agency’s Enforcement Bureau continues to consider “an alleged violation of FCC rules,” according to an FCC official. Until the enforcement hold is lifted, the agency’s Media Bureau cannot proceed with a decision on whether or not to renew the station’s broadcast license.  The Enforcement Bureau must first determine whether or not a violation of FCC rules has occurred.  If the allegation is substantiated, the agency has a range of options, such as warning that the violation not be repeated or imposing a monetary fine on the station, officials said. FCC

WTIC-AM, which is licensed to Hartford but operates from studios in Farmington, can continue broadcasting under the broadcast license that expired nine months ago, on April 1, 2014, until the FCC acts on its renewal application.  The renewal application was filed by the station more than a year ago, on November 27, 2013. Stations must file an application for license renewal) four months prior to the expiration date of the station's license.

Precisely what the allegation under review involves is not made known to the public, officials reiterated this week.  That information is only made available to the licensee or their attorney, according to an FCC official. The agency can, and often does, communicate with the station as part of their review process.  WTICWTIC_1080_AM_Radio_logo has declined to comment on the ongoing review process at the FCC.

Officials say it is not unusual for a license renewal to be on enforcement hold for an extended period of time.  Stations in such a status routinely continue to operate without any interruption until a decision on license renewal is made.

When the license renewal application does reach the agency’s Media Bureau, they will consider “how the allegation of violation was resolved,” as well as a range of other factors in deciding whether or not to renew the station’s license.

The other, more routine, factors include whether any other objections have been raised about the station, whether the station has been adequately serving the public in their area of license, their history of compliance with FCC regulations, and their overall performance.  License renewals for radio stations are issued by the FCC for a period of eight years.

Connecticut by the Numbers first reported the FCC’s enforcement hold last September.  Subsequently, Hartford Attorney Ken Krayeske filed an informal objection on October 1, 2014 to WTIC’s broadcast license renewal, alleging that the station “demonstrated serious malfeasance” and “helped conceal violations of federal law,” related to Rowland’s use of his radio program to promote the Congressional campaign of Lisa Wilson-Foley. Krayeske had filed a previous complaint in 2012 that did not result in FCC action against the station.

Connecticut Ranks 33rd in College Funding, Tuition, Burden; Grade: D

The Student Impact Project, an initiative of the youth advocacy group Young Invincibles, tracked trends in higher education finance in states across the country, and graded each state based on tuition levels, state funding per student, state aid to students, the financial burden to families and higher education spending as a portion of the total state budget.  Connecticut's report card grade:  D. In state-by-state reports published this week and reported by US News & World Report, the group found that on average, tuition at four-year public colleges and universities increased 37 percent between 2007 and 2013, which is three times the rate of inflation.  The data indicated that 47 states spend less per student today than they did before the Great Recession.map

Connecticut ranks 33rd among the nation’s 50 states in support for higher education.  Overall, just four states – Wyoming, New York, Alaska and Oklahoma – received a total grade equivalent to an A, while 10 got a B, 13 got a C, 12 got a D and 11 received an F, US News reported.

Overall, the state’s average in the five categories was 63 percent, which placed it ahead of only 16 states, including New Hampshire, which placed last, and Vermont, Colorado, Michigan and Oregon.  Connecticut received an F in the “aid for students” category, D in “state appropriation average” and “tuition” categories, C- in “Higher Ed as a Priority,” and the state's highest grade, C+, in “Burden on Families Average.”

New Hampshire, which at a 17 percent overall grade scored lowest in the country, spends the least amount of money per student than any other state ($1,708), and has cut the budget almost in half since the recession, according to the report. New Hampshire also provides no state aid to students, and spends 2 percent of its overall budget on higher education.  In Connecticut, the report indicated, that figure is 11 percent.

A report issuedCT report card 
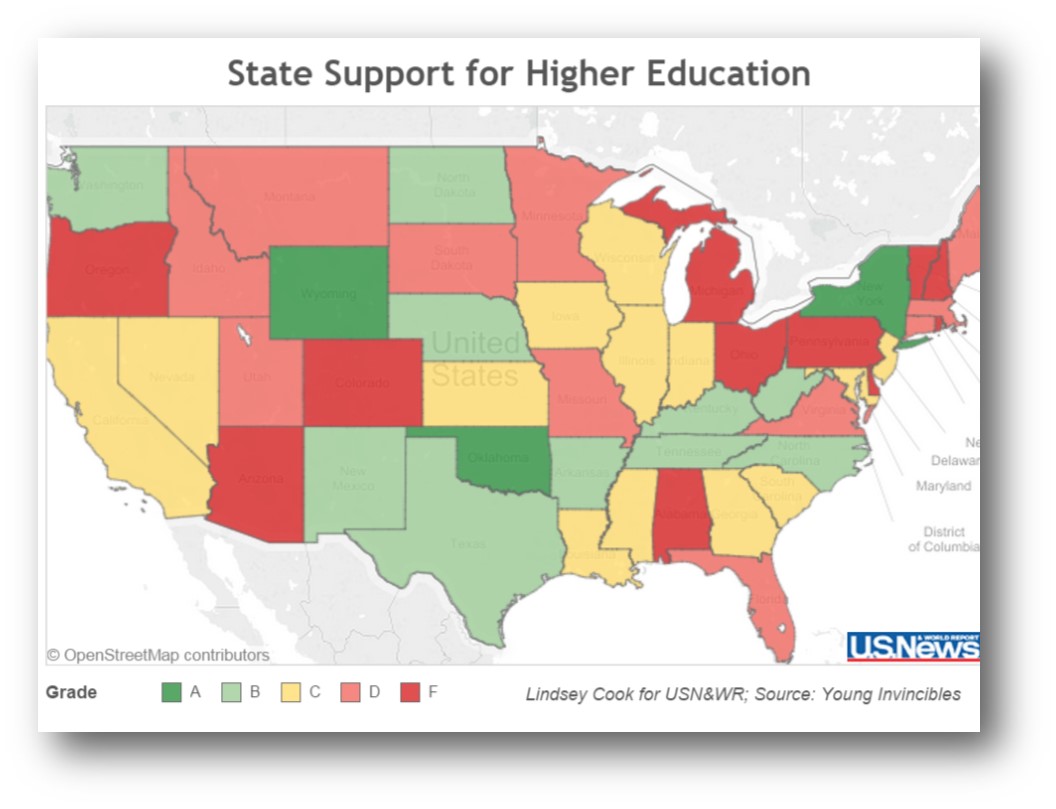
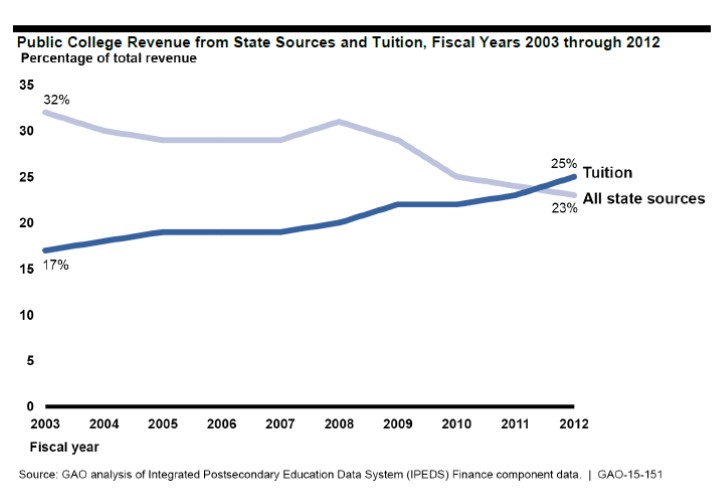
last month by the General Accounting Office in Washington, D.C. for the U.S. Senate found “persistent state budget constraints have limited funding for public colleges” across the country. The result, according to the GAO report: “Students and their families are now bearing the cost of college as a larger portion of their total family budgets.”

A report by Connecticut’s Office of Higher Education in March 2014 found that for the 2013-14 academic year, “UConn’s increase of 5.8 percent for in-state commuting students compares to a national average of 3.7 percent for state flagship institutions. CSCU’s increase of 5.4 percent for in-state commuting students attending its State Universities compares to a national average of 4.1 percent for similar types of institutions; the Community Colleges’ increase of 5.5 percent for in-state commuting students compares to a national average of 4.5 percent for like institutions.”

The Connecticut report also noted that “from 2009 to 2014, tuition and fees for in-state undergraduates have increased 24.7 percent at the Connecticut State Universities, 26.9 percent at the Community Colleges, and 28.7 percent at UConn.”  Last fall, Connecticut’s largest public college system (CSCU) said it will need an 11 percent increase in its base-level state funding for the next fiscal year if they are to keep  an anticipated tuition-and-fee hike to 2 percent.  If additional state funding is not provided, steeper tuition hikes are possible.GAO report

From fiscal years 2003 through 2012, the GAO report outlined, state funding for all public colleges decreased, while tuition rose. Specifically, state funding decreased by 12 percent overall while median tuition rose 55 percent across all public colleges. Tuition revenue for public colleges increased from 17 percent to 25 percent, surpassing state funding by fiscal year 2012 (see chart below).

In their report, “State Funding Trends and Policies on Affordability,” GAO identified several potential approaches that the federal government could use to expand incentives to states to improve affordability, such as creating new grants, providing more consumer information on affordability, or changing federal student aid programs. “Each of these approaches may have advantages and challenges, including cost implications for the federal government and consequences for students,” the report noted.

The report also indicates that GAO tuition state support“state grant aid directly affects students in that it can reduce their out-of-pocket expenses for college… state grant aid, both merit- and need-based, has positive effects on enrollment.”  The results of one program, in Washington State, cited by GAO “suggests that receiving the aid increased a student’s probability of enrolling in college by nearly 14 to 19 percentage points.”

Footnote to the story: to underscore the data, US News is running a video news story broadcast on FOX Connecticut, reporting on possible tuition increases at the Connecticut State Colleges & Universities.  The story, which is not referenced by date, was aired two years ago.

FOX


As Latino Population Increases, Schools See More English Language Learners

A snapshot of America in 2044, based on U.S. Census Bureau data and current trends, will show this:  a nation with a youthful, growing minority population juxtaposed against an aging, slow-growing and soon to be declining white population. New population projections show whites will become a minority by 2044, according to published reports. The new projections from U.S. Census Bureau figures shows two trends for America's population -- a long-term decline for the nation's white population, making up just 49.7 percent of the population by 2044, and a growth of new minorities -- Asians, Latinos and multiracial persons. The populations among the rapidly-growing Latinos, Asians and multiracial populations are all expected to double in size over the next 30 years. Specifically, the rise of Latinos is projected to make up 25.1 percent of the U.S. population in 2044, doubling African-Americans, according to the data projections reported in the Latino Post.  By 2027, more than half of America's 20-somethings will be racial minorities, and in the 2028 presidential election, 40 percent of all eligible voters will be racial minorities._Hispanic_students

In Connecticut, the demographic shift is underway.  The Hispanic percentage of the statewide population in 2013 stood at 14.7 percent, steadily climbing during the past decade.  The Hispanic percentage of statewide population under age 18 in 2013: 22 percent.

When the website ctlatinonews.com selected five “Young Latinos to Watch” this month, two of the five were newly elected legislators.  Aundré Bumgardner was a surprise winner on Election Day.  The Republican, whose family is from Panama and Puerto Rico, will be the youngest State Representative in Connecticut’s legislature.  The 20 year-old won his party’s nomination to run for the state House from the 41st District, which covers Groton and New London.  Rep.-elect Christopher Rosario may be new to the state’s legislature, but he is not new to advocacy, politics  and working on behalf of the Latino community. He will represent his hometown of Bridgeport in the state legislature from the 128th District.   He has been Bridgeport’s youngest department head as Director of Anti-Blight under the Office of Neighborhood Revitalization.

Recent news reports highlight one of the issues that the legislature will be grappling with.  An analysis by CT Mirror found that during the 2013-14 school year, Hartford Public Schools had the most English Language Learner (ELL) students, with 3,550, but Windham had the highest percentage of ELL students at 23.8 percent.  The largest peeducation_student_newsrcentage increases in ELL students, between 2001 and last year, came in Windham (11.8% increase), Danbury (up 9.4%), Norwich (up 9.1%), and New London and West Haven (both up 7.4%).

The increasing number of ELL students in Connecticut is reflected in the current top 20 communities, according to the CT Mirror data, compiled from the State Department of Education:

  1. Hartford 3,550
  2. New Haven 2,709
  3. Bridgeport 2,685
  4. Danbury 2,204
  5. Waterbury 2,114
  6. Stamford 1,870
  7. New Britain 1,659
  8. Norwalk 1,277
  9. Meriden 1,011
  10. Windham 774
  11. West Haven 678
  12. East Hartford 606
  13. New London 588
  14. West Hartford 490
  15. Greenwich 486
  16. Norwich 465
  17. Manchester 351
  18. Torrington 334
  19. Bristol 317
  20. Wallingford 275

The top twelve municipalities with ELL students, by percentage of their student population:demographics_icon

  1. Windham 23.8%
  2. Danbury 20.4%
  3. New London 19.2%
  4. Hartford 16.7%
  5. New Britain 16.5%
  6. Bridgeport 12.9%
  7. New Haven 12.7%
  8. Meriden 12.5%
  9. Norwich 12.4%
  10. Stamford 11.8%
  11. Norwalk 11.5%
  12. West Haven 11.4%
  13. Waterbury 11.4%

The legislature's Latino and Puerto Rican Affairs Commission (LPRAC) is hosting this public policy forum on English Language Learners (ELL) and bilingual education in Connecticut on Tuesday, January 13, at the State Capitol in Hartford.  It will feature classroom teachers, business, professors, and legislators discussing the status of ELL/bilingual education and how to improve outcomes for Connecticut’s non-English speaking children.

New Interactive Tool Brings Focus to Cuts in State Funding of Children's Programs

If a picture is worth a thousand words, the impact of a series of interactive data visualization graphs must be, well, off the charts.  For Connecticut Voices for Children, the new online, interactive visualization tool has been designed to help the public and policymakers see how funding for children's programming in Connecticut has fallen through the years.  Coming on the brink of a new legislative session and an ever-tightening state budget, the hope is that more widespread understanding of  past trends will forestall further cuts. logo.inddThe new interactive tool, on the Connecticut Voices for Children website, enables visitors to track spending across nearly 100 children’s programs over 25 years.  Over the last two decades, spending on children’s programs has declined from 40% to 30% of the state budget, according to the advocacy organization.  Had the state not changed its budgeting priorities, it would have invested about $1.5 billion more each year in children’s programs—enough, for instance, to be the first state to implement a universal early care and education system, Voices points out.Picture1

The new interactive tool, created by Connecticut Voices for Children, enables users to create their own graphs of state budget trends and then embed the charts in social media, blog posts, news articles, and reports. Users, for instance, can compare the dip in state support for K-12 education to the even steeper drop in support for higher education.

Detailed budget visualizations for Fiscal Years 1990 through 2015 are available for the following areas:

  • The overall Children's Budget (at right)
  • Early Care and Education
  • K-12 Education investments
  • Children's Health and Human Services
  • Debt and Fringe Benefits

In producing this resource, Connecticut Voices for Children seeks to draw attention to what they describe as "Connecticut’s long-term disinvestment in young people – a trend that is particularly troubling in a state with an aging and shrinking workforce that will result in an increasing demand for well educated, career ready young adults."

Regarding K-12 education, for example, the website points out "K-12 Education has declined substantially as a share of the General Fund since the early 1990s, from about one fifth to one seventh in the most recent budget. This decline is seen most clearly in Educational Equalization Grants, the state's main contribution to local school districts. State support for K-12 education in Connecticut is among the lowest of any state in the union. In Connecticut, we leave the large majority of education expenses up to towns, which have no major revenue source except the property tax, thus contributing to the state's high and inequitable property taxes."

The information used in creating the graphs is official appropriations data from the Connecticut legislature's non-partisan Office of Fiscal Analysis.

Connecticut Voices for Children's mission is to promote the well-being of all of Connecticut's children and families by identifying and advocating for strategic public investments and wise public policies. Connecticut Voices advances its mission through high quality research and analysis, policy development, strategic communications, and establishment of a sustainable and powerful voice for children.


Planning Underway for 2015 White House Conference on Aging; Connecticut Has 7th Oldest Population

Next year will be the 50th anniversary of Medicare, Medicaid, and the Older Americans Act, as well as the 80th anniversary of Social Security. It will also be the year when the White House will convene the 2015 White House Conference on Aging. The Conference will be of particular interest in Connecticut, currently the 7th oldest state in the nation based on median age.  The state is undergoing “a permanent and historic transformation in its demographics,” according to the state’s Legislative Commission on Aging (LCA).

The first White House Conference on Aging was held in 1961, with subsequent conferences in 1971, 1981, 1995, and 2005. These conferences have been widely viewed as catalysts for development of aging policy over the past 50 years.

The White House is “fully committed,” to conducting a 2015 conference, and is moving forward developing plans.  Officials intend to seek broad public engagemelogo-WHCOA2015nt and work closely with stakeholders in developing the conference, viewed as “an opportunity to look ahead to the issues that will help shape the landscape for older Americans for the next decade.”

Given the advances in technology and social media in the past decade, the 2015 Conference is expected to use web tools and social media “to encourage as many older Americans as possible to participate,” according to White House officials.

Among the key issues likely to be included are: retirement security; healthy aging; long-term services and supports to help older adults remain in their communities; and preventing financial exploitation, abuse, and neglect of older adults.

According to the Connecticut for Livable Communities report, issued earlier this year by the LCA, the state’s 65 and older population is projected to grow by 57% between 2010 and 2040. During the same period, Connecticut’s 20- to 64-year-old population is projected to grow less than 2%.

“In 2010, there were 4.35 working-age people for each person age 65 and older in Connecticut,” according to the CLCA. “In 2030, there will be only 2.75.”  More than one-third of the Connecticut population is over the age of 50, according to the report, and that proportion continues to rise. Residents born in Connecticut today, the report indicates, can expect to live to be 80.8 years old—the third highest life expectancy in the nation.

Nationally in 2013, there were 44.7 million Americans aged 65 and over and 6 million aged 85 and over.  Over the next 50 years, the number of people aged 65 and older is expected to more than double to 92 million and the number of people aged 85 and older is expected to triple to 18 million.

Among the key areas expected to be highlighted during the Conference, according to the White House website:282f3319af64c02e9f_h7m6bq4iz

  • Retirement security - Financial security in retirement provides essential peace of mind for older Americans, but requires attention during our working lives to ensure that we are well prepared for retirement.
  • Healthy aging will be all the more important as baby boomers age. As medical advances progress, the opportunities for older Americans to maintain their health and vitality should progress as well and community supports, including housing, are important tools to promote this vitality.
  • Long-term services and supports - Older Americans overwhelmingly prefer to remain independent in the community as they age. They need supports to do so, including a caregiving network and well-supported workforce.
  • Elder justice - Seniors, particularly the oldest older Americans, can be vulnerable to financial exploitation, abuse, and neglect. The Elder Justice Act was enacted as part of the Affordable Care Act, aimed at protecting seniors from scam artists and others seeking to take advantage of them.

In 2013, there were 75.9 million baby boomers (people born between 1946 and 1964) accounting for almost one-quarter of the population. Baby boomers began turning 65 years old in 2011.  Between 1980 and 2013, the centenarian population more than doubled from 32,194 in 1980 to 67,347 in 2013.

Between 1990 and 2013, the labor force participation rate of people age 65 and over increased from 12% to 19%.  Among the population age 65 and over, there are 128 women for every 100 men. At age 85 and over this ratio increases to 196 women for every 100 men.

Earlier this year, Cecilia Muñoz, Assistant to the President and Director of the Domestic Policy Council, announced that Nora Super will be leading this effort as the Executive Director of the 2015 White House Conference on Aging.

Additional information can be obtained by contacting: White House Conference on Aging, 200 Independence Avenue SW, Suite 637D, Hubert H. Humphrey Building, Washington, DC  20201, (202) 619-3636, info@whaging.gov. Individuals can also sign up for updates as plans develop, at https://public.govdelivery.com/accounts/USWHCA/subscriber/new?topic_id=USWHCA_1

Summer Olympics May Come to CT if Boston Bid for 2024 Succeeds

Boston is one of four cities being considered to be the United States entry in the international competition to host the 2024 Olympic Games.  If Boston's bid were to become a reality, at least one Olympics observer is suggesting that Connecticut may have an Olympic supporting role to play. Boston, San Francisco, Washington D.C. and Los Angeles have been selected to develop bids to be considered by the U.S. Olympic Committee, which would decide which  city - if any - to support and present to the International Olympic Committee (IOC), which will decide in 2017 on the host city for the 2024 Olympics.2024

Rosanna Garcia, associate professor of marketing in the D’Amore-McKim School of Business at Northeastern University in Boston, who has attended the past eight Summer Olympics, sees the city turning to Connecticut and Rhode Island to host some events.

“With more than 300 events that typically occur at the Olympics, many cities around Massachusetts, and even Rhode Island and Connecticut, will need to partner with the International Olympic Committee to host these events,” Garcia points out.

garcia1501
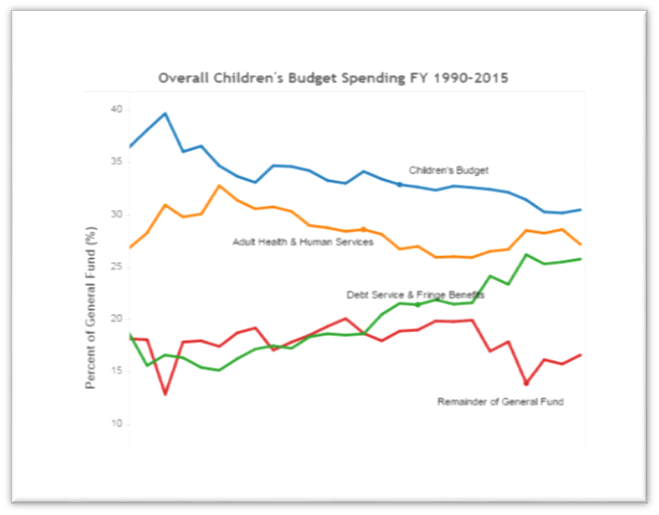
“Many preliminary competition events would need to take place outside of the main Olympic Park areas so events may occur as far away as Connecticut. This also is an opportunity for more people to get involved with the Olympic Spirit,” Garcia adds.Olympic_rings_without_rims.svg

The Boston Globe has reported that the U.S. Olympic Committee is expected to decide early next year whether to enter a U.S. city in the international competition to host the 2024 Olympics.  That would be just after the IOC acts on recent recommendations to reform its selection process, which would take effect with the 2024 Summer Games host selection.  The IOC meets next month to consider the series of recommendations.

Members of the U.S. Olympic Committee were in Boston last week, meeting with representatives of the Boston bid and area colleges which would participate, potentially providing sports venues, dorms, and other support services.  Last month, a promotional video advocating a Boston bid was released, and a website was launched. With an eye toward innovation and efficiency, the video highlights Boston’s bid “to create a sustainable model for hosting the Olympic and Paralympic Games that can become the blueprint for future host cities.”

The Connecticut Convention & Sports Bureau, the state’s official meetings and sports event sales and marketing organization, "supports Boston’s bid for the 2024 Olympics," said Interim President H. Scott Phelps.  "Regardless of whether or not Boston wins the Olympics, the City’s bid has helped to elevate the Boston and other New England brands to sports event planners from all over the world."  Officials noted that if the Olympic Games decide to come to Boston, "it could be great for tourism in nearby Connecticut as well, as spectators and competitors would be encouraged to come visit our State’s attractions," adding that "there might be opportunities for our state to host pre-Olympic competitions and ... athletes."

bsd_usoc_SiteGraphic_BidAnnouncement_800x375_al2

The Globe noted that if the International Olympic Committee, meeting in Switzerland in December, decides that its preference is for compact venues, as is expected, Boston is seen as a strong candidate and could gain an advantage over Los Angeles, San Francisco, and Washington, whose plans offer less intimate settings, according to the Globe.  Supporters of the San Francisco bid have noted that the chairman of the U.S. Olympic Committee, Larry Probst, lives in nearby Burlingame, CA.  The San Francisco effort is being led by Larry Baer, the chief executive officer of baseball's World Series champion Giants, according to published reports.la2024logo

It is the first time that Boston has prepared a bid to host the Games, and it is being led by an organization called the Boston 2024 Partnership, a nonprofit organization formed to prepare the bid materials. The group is governed by a 36-member executive committee, and has launched a series of subcommittees aimed at master planning, fundraising, outreach, and engagement. Organizers note that no tax dollars have been spent on Boston 2024, and tax dollars will not be used to build venues or pay for the operation of the Games. Public investment will be confined to roadway, transportation and infrastructure improvements, most of which are already planned and are needed with or without the Olympics.

fenway
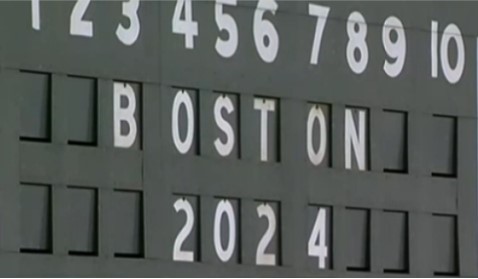
An Olympic games in Boston would utilize existing sports venues of both professional teams and area colleges, which could reduce potential costs.  Infrastructure improvements, such as in transportation, are already on the drawing board, and could accelerate with a Boston bid.U.S.-Olympic-Committee-logo

The U.S. last hosted a Summer Olympiad in Atlanta in 1996; a Winter Olympics in 2002.  St. Louis hosted in 1904 and Los Angeles held the Games in both 1932 and 1984. In recent years, the unsuccessful U.S. bids to the IOC was to host the Summer Games were New York (2012) and Chicago (2016).  The 2016 Games will be held in Rio de Janeiro and the 2020 Summer Olympics are scheduled to be held in Tokyo, Japan.  Other potential contenders, according to published reports, include Paris, Rome,Doha, Istanbul and either Hamburg or Berlin in Germany.

“Holding the Games in the Boston area would serve as a catalyst for growth in the region,” said John Fish, CEO of Suffolk Construction and driving force in the initiative. “We are also excited for the chance to deliver something that is both powerful and meaningful for the worldwide Olympic and Paralympic movements that will also connect more youth to sport.”

Picture4