University of Hartford, Wesleyan on Top 25 List: Most Literary Colleges in America

The University of Hartford and Wesleyan University in Middletown have been named as among The 25 Most Literary Colleges in America, by the website Flavorwire. The list focuses on “which universities are the most literary friendly — which ones have the best teachers, the most famous alumni, and have the best environments for their more bookish students.”  Hartford and Wesleyan are the only Connecticut higher education institutions to make the list.

In describing the University of Hartford, the website noted that “While its neighbors in New York and Massachusetts might carry more name recognition, this school was originally founded by a group of the city’s upper class citizens during the Gilded Age, including Olivia Langdon Clemens (Mark Twain’s wife) and Harriet Beecher Stowe.”

Wesleyan University and the University of Hartford - both listed among the top ten on Flavorwire’s “Most Literary Colleges” list – are surrounded on the list by  bookschools including  Princeton, Harvard, Columbia, the University of Chicago, and many other prestigious institutions.

The website goes on to say that the University of Hartford “has a strong English department,” and it notes that the University “has given the Edward Lewis Wallant Award out to authors like Nicole Krauss and Dara Horn.” The Wallant Award, presented each year by the University’s Greenberg Center for Judaic Studies, is one of the oldest and most prestigious Jewish literary awards in the top-25United States.

In describing Wesleyan, the website noted that it is “One of the Little Ivies that is really big on books, V. S. Naipaul and T. S. Eliot both taught at this school that overlooks the Connecticut River, and with a list of writers like Daniel Handler (Lemony Snicket), Ayelet Waldman, Steve Almond, and many others, Wesleyan is without a doubt a writer’s college. “

New York-based cultural blog Flavorwire covers art, music, books, film, and design, seeking to connect viewers of the website with inspiring culture. It is part of Flavorpill Media, a community of writers, editors, developers, designers and sales and marketing creatives.

The top 25 most literary colleges in America,  from Flavorwire:

  1. Princeton University
  2. University of Iowa
  3. Brooklyn College
  4. Pomona College
  5. University of Hartford
  6. Wesleyan University
  7.  Sarah Lawrence College
  8. Oberlin College
  9. Williams College
  10. Vanderbilt University
  11.  Smith College
  12.  University of Mississippi
  13.  New York University
  14.  Colorado College
  15. University of Chicago
  16. Hamilton College
  17. Harvard
  18.  University of Illinois at Champaign-Urbana
  19. Sewanee:  The University of the South
  20.  Emerson College
  21. University of Texas at Austin
  22. Columbia University
  23.  Vassar College
  24.  Bennington College
  25. The New School


Cost of Raising A Child Is Highest in Northeast U.S., Including CT

The cost of raising a child:  priceless.  Well, no, there is a price-tag.  The U.S. Department of Agriculture (USDA) released its annual report, Expenditures on Children by Families, which shows that a middle-income family with a child born in 2012 can expect to spend about $241,080 ($301,970 adjusted for projected inflation*) for food, shelter, and other necessities associated with child-rearing expenses over the next 17 years.

There was an overall 2.6 percent increase from 2011.  Expenses for child care, education, health care, and clothing saw the largest percentage increases related to child rearing from 2011. However, there were smaller increases in housing, food, transportation, and miscellaneous expenses during the same period. The 2.6 percent increase from 2011 to 2012 is also lower than the average annual increase of 4.4 percent since 1960.

The report notes geographic variations in the cost of raising a child, with expenses the highest for families living in the urban Northeast  - the 9-state northeast region, which includes Connecticut, Maine, Massachusetts, New Hampshire, New Jersey, New York, Pennsylvania, Rhode Island, and Vermont -followed by the urban West and urban Midwest. Families living in the urban South and rural areas have the lowest child-rearing expenses.report child expense

The report, issued annually, is based on data from the Federal government's Consumer Expenditure Survey, the most comprehensive source of information available on household expenditures. There is also  an interactive web version of the report where individuals can easily enter the number and ages of their children to obtain an estimate of costs through age 17.

Housing accounted for the largest share of total child-rearing expenses. For the middle and highest income groups (for households with the expense), child care and education was the second largest expenditure on a child, accounting for 18 and 23 percent of child-rearing expenses, respectively. For the lowest income group, child care and education accounted for 14 percent of total child-rearing expenses (again, for households with the expense). For lower income families, child care may be provided by relatives or friends at no cost due to affordability issues, the report pointed out.

Expenses per child decrease as a family has more children. Families with three or more children spend 22 percent less per child than families with two chchild expensesildren. As families have more children, the children can share bedrooms, clothing and toys can be handed down to younger children, food can be purchased in larger and more economical quantities, and private schools or child care centers may offer sibling discounts.

Among the largest potential costs in child-rearing is the cost of a college education, which was not included in this study, which only included direct parent expenses through age 17. The College Board estimated that in 2012-2013, annual average (enrollment-weighted) tuition and fees were $8,655 at 4-year public colleges (in-State tuition) and $29,056 at 4-year private (non-profit) colleges; annual room and board was $9,205 at 4-year public colleges and $10,462 at 4-year private colleges. For 2-year colleges in 2012-2013, annual average tuition and fees were $3,131 at public colleges. These college costs may be offset by financial aid.

The report concluded, as only a government report could, by stating: “The direct and indirect costs of raising children are considerable, absorbing a major share of the household budget. On the other hand, these costs may be outweighed by the benefits of children.”

The full report is available on the web at www.cnpp.usda.gov. A video highlighting the report is at http://www.youtube.com/watch?v=Di14Y3kTbHE

Mathematics and Transportation of Cities Draws New Research Analysis

UConn researchers have collaborated to develop a new index that will measure the sustainability of complex urban transportation systems.  The index will allow policymakers, scientists and the public to understand not just how congested cities’ transportation systems are, but the economic, social, and environmental impacts of the system as a whole.

A team of researchers in UConn’s departments of geography and civil and environmental engineering developed The Transportation Index for Sustainable Places, or TISP.  The new approach is part of the July themed issue of the journal Research in Transportation Business & Management, edited by  Carol Atkinson-Palombo, assistant professor of geography, Norman Garrick, associate professor of civil and environmental engineering, and Wesley Marshall, a former graduate student of Garrick’s who is now a faculty member at the University of Colorado, Denver. TISP

“Policy in developed countries and in the U.S. in particular has tended to focus on relieving congestion and has largely ignored social and environmental impacts associated with expanding freeways,” says Carol Atkinson-Palombo. “This index takes a more holistic approach, which gives a comprehensive sense of the effects of the system.”

The TISP takes into account environmental factors like land use efficiency, minimizing natural resource consumption, and reducing greenhouse gas emissions. Social factors are also measured, such as meeting access needs, incorporating public health and safety and maintaining a community in areas served by transportation. These factors combine with economic measures, such as affordability, self-sufficiency, and efficiency, to create a comprehensive metric, UConn Today reported.

Garrick says that many people only think about transportation in terms of traffic. These so-called congestion indices, he says, are misleading because they are not necessarily about making the city better, but simply moving cars more efficiently.

“In many cities, only 40 percenNewHavenRoute34aftert of the people commuting are in cars,” he points out. “The majority of the people aren’t affected by the congestion index, yet this is the only measure of the impact of the transportation system that is ever discussed in the media.”

Mathematics of Cities

In another initiative aimed at taking a closer look at the function of cities, the view that cities are dissimilar and disordered systems has begun to change.  Patterns have emerged within the supposed chaos, and researchers in economics, physics, complexity theory and statistical mechanics have concluded that cities, mathematically speaking, might actually be basically the same. Though strikingly different in culture and layout, cities like London and Beijing, for example, share many properties with regard to infrastructure, social interactions and productivity.

The new conclusions – decades in the making - are part of a growing field dedicated to the science of cities, Science News, the magazine of the Society for Science & The Public, reports in its most recent edition.   Roughly 75 percent of people in the developed world now live in urban environments. While much of the research is in its early days, eventually it may serve as a powerful, widely used tool for urban planners and policymakers, the publication reports.

Physicist and complex systems scientist Luís Bettencourt of the Santa Fe Institute in New Mexico has developed a theory which captures the interplay between a city’s population, its area, the properties of its infrastructure and its social connectivity. His theory suggests that city planning should not involve grand, top-down projects, but perhaps well-considered smaller ones.

The mathematical work is rooted in and reinforces the view “that cities grow from the bottom up,” says Michael Batty, who trained as an architect, planner and geographer and went on to found the Centre for Advanced Spatial Analysis at University College London. “The diversity of life [in cities] offers greater opportunities for mixing ideas.”

The emerging mathematical theory of cities stands on four basic assumptions:

  1. Cities mix varied people together, allowing them to reach each other.
  2. Cities are networks that grow gradually and incrementally, connecting people.
  3. Human effort isn’t limitless and stays the same regardless of urban size.
  4.   Measures of the socioeconomic output of a city — things like the number of patents awarded or crime rate — are proportional to the number of social interactions.

 “In a nutshell, the city is the best way of creating a vast, open-ended social network that minimizes the cost of moving things in and around an environment,” Bettencourt says. “When people brush up against each other, that’s when the magic of the city happens — the social reactor begins to work.”

Cities Reshape Transportation Mix

At UConn, when the research team used the TISP index to look at transportation in the U.S., they found some not-so-surprising results: areas with higher rates of driving rather than public transportation have greater carbon emissions, and having more cars and highways increases traffic fatality risk.  But despite the prevailing perception, says Garceau, the researchers found that decityveloping varied transportation systems that include a combination of roads and public transportation are more cost-effective than simply building highways.

Many cities have already begun to adjust their transportation planning. Some have begun dismantling freeways that run through their downtowns to reconstruct a truly urban atmosphere. New Haven is in the midst of doing precisely that in Connecticut, eliminating the Route 34 connector and replacing it with an urban boulevard that will reconnect city neighborhoods cut off for decades.

Others cities are moving forward with light rail and bus rapid transit systems (such as CTfastrak between Hartford and New Britain, now under construction) and encouraging walking and bicycle use by building compact, mixed-use communities that focus on pedestrians rather than cars.  Garrick points to Cambridge, Mass., Portland, Ore., and New York City as U.S. cities that have taken strides toward sustainable transportation. On a smaller scale, he cites Storrs, the home of UConn’s main campus, for developing a walkable town center from scratch, and planning for greater bus access as the newly-minted downtown area unfolds.
Three CT School Districts Approach School Year Preparing for More Instruction Time

Last December, Connecticut was one of five states selected to participate in a pilot project by the TIME Collaborative to extend instruction time during the school year by 300 hours, in an initiative aimed at improving academic preparedness and boosting student achievement.  Seven Connecticut schools, in East Hartford, Meriden and New London, were selected along with schools in Colorado, Massachusetts, New York and Tennessee.

The timetable for the efforts included planning and workshops during the remainder of the 2012-2013 school year, with the new, improved, lengthened academic calendar to take hold when students returned in the fall of 2013.  The new school year – and implementation - is fast approaching.-working-at-desk-r

The TIME Collaborative is a partnership between the Ford Foundation and the National Center on Time & Learning (NCTL) to develop high-quality and sustainable expanded learning time schools. Through the Collaborative, Ford and NCTL are investing in and supporting a select group of states that agree to harness state resources and federal funds using new flexibilities afforded by the federal waiver process to add 300 hours of additional learning time for all students in participating schools.

Ford is providing funds to build state, district and school capacity to support the initiative and is underwriting NCTL’s planning and implementation support to district and schools. Schools in the three Connecticut districts planning to implement the increased instruction time  include:

EAST HARTFORD Thomas S. O’Connell Elementary School

MERIDEN Casimir Pulaski Elementary School John Barry Elementary School

NEW LONDON Jennings Elementary School Winthrop Magnet Elementary School Nathan Hale Elementary School Bennie Dover Jackson Middle School

In the TIME Collaborative program, “high quality expanded learning time schools redesign the traditional school day/year to empower each student with the knowledge, skills, and experiences needed for success in college and career.”  The guidelines include seven areas of focus:

  • Focused school-wide goals
  • Rigorous Academics
  • Differentiated Supports
  • Frequent Data Cycles
  • Targeted Teacher development
  • Engaging enrichment
  • Improved School Culture

Selected districts and schools will have the opportunity to re-engineer their school schedule , and expand opportunities for learning, enrichment and collaboration to improve student achievement, engagement, and teacher effectiveness.  They are also eligible to receive annual capacity building grants and deep technical assistance on effective implementation from NCTL at no cost, as well as joining a network of pioneering educators from across the country.-Time-Leaning-logo

The three-year pilot program will affect almost 20,000 students in 40 schools in the five selected states, with long-term hopes of expanding the program to include additional schools — especially those that serve low-income communities.

Plans called for the schools to implement a collaborative process that would involve the school districts, union leadership, teachers, community partners and parents.  The planning process would allow teams to develop an expanded-time schedule that provides a rigorous, well-rounded curriculum for all students; offers individualized help for students who are struggling; uses data and technology to inform and improve instruction; improves collaboration among teachers; provides enrichment opportunities in the arts, music and other areas critical to development; and promotes a culture of high achievement.

 A mix of federal, state and district funds will cover the costs of expanded learning time, with the Ford Foundation and the National Center on Time & Learning also contributing financial resources.  Just over 1,000 U.S. schools already operate on expanded schedules, an increase of 53 percent over 2009, according to a report from the National Center on Time & Learning.

“For districts that are falling behind, we want to give them the ability to implement the reforms that we know achieve results for students.  The additional funding we’re announcing today will allow for the intensive turnaround models that will help us close the nation’s largest achievement gap,” Governor Malloy said when the program was announced last December.

7 school areas

Achievement Gap Persists Despite Progress Reflected in High School Graduation Rates

The academic achievement gap is alive and well and living in Connecticut.

While the high school graduation rate in the state has edged upward for the third consecutive year in 2012, 15.2 percent - 43,883 students – in the cohort of the class of 2012 failed to complete high school in four years.  This is down from 17.2 the previous year, according to the State Department of Education’s newly released data.  The state’s graduation rate is 84.8 percent – the percentage of students who graduate high school within four years.

Of the 15.2 percent of students who failed to graduate in four years, just over one-third - 5.4 percent - was still enrolled when their fellow students received their diplomas.  Overall, the disparity in graduate rates among whites, blacks and Hispanics was pronounced:

  • The graduation rate of Hispanic students (68.6 percent) is 22.7 percent lower than that of White students (91.3 percent); the corresponding gap between Black/African American students (73 percent) and their White counterparts is 18.3 percent.
  • The graduation rate for low-income students (those eligible for free lunch) is 66.6 percent, whch is 26.5 percent lower than that of students not eligible for any lunch subsidies (93.1 percent).
  • The graduation rate for English Language Learners (62.7 percent) is 23.2 percent lower than that of their non-ELL peers (85.9 percent).

The graduation rate for Hispanics increased 4.4 percent last year over 2011, and it increased 1.8 percent for Black students, reflecting the state’s progress in narrowing the longstanding gap.

However, “just 54.2 percent of Hispanic males and only 57.6 percent of Black males who are eligible for free lunch graduated high school within four years,” the department reported, pointing out the demographic with the greatest disparities.

The report also noted that the high school graduation rate remains higher for males than females in Connecticut , 88.3 percent compared with 81.5 percent.  Anclass seatsd the graduation rate improved more for females (2.3 percent) than males (1.9 percent) from 2011 to 2012.

Across the state’s 188 high schools, the graduation rate was above 90 percent in 100 high schools, 40 high schools had a graduation rate of between 80 and 90 percent, and 38 high schools had a graduation rate of less than 80 percent.

Graduation rates are calculated according to the Adjusted Cohort Graduation Rate method, which was developed by the National Governors Association and is considered to be the most precise method. These rates represent the percentage of students who graduated with a regular high school diploma in four years or less. It is based on individual student level data, excludes 9th grade repeaters, late graduates, and accounts for transfers in and out of the graduating class over the four-year period.

By way of comparison, in North Carolina, 80.4 percent of students graduated high school within four years, somewhat below Connecticut’s overall 84.8 percent.  However, among students of color, North Carolina’s numbers outpace Connecticut.  In North Carolina, 73 percent of Hispanic students now graduate in four years, compared with 68.6 percent in Connecticut.  Among black students, the percentage graduating in four years is 74.7 percent in North Carolina, compared to 73 percent in Connecticut.

Need a Job? Study Says Volunteering First Can Help

If you are unemployed, it pays to volunteer.  That is the finding of a new analysis by the Center for Economic and Policy Research, tracking individuals out of work who chose to volunteer, and the impact it had on their search for employment.

The report, “Does It Pay to Volunteer: The Relationship Between Volunteer Work and Paid Work,”  estimates non-working individuals’ probability of being employed a year later if they volunteered during the 12-month period. Pooling three years of data from the Current Population Survey (CPS) Volunteer Supplement covering the period ending in September of 2011, the analysis found a positive volunteer effect on the probability of employment for persons who were not employed and volunteered for more than 20 hours per year.

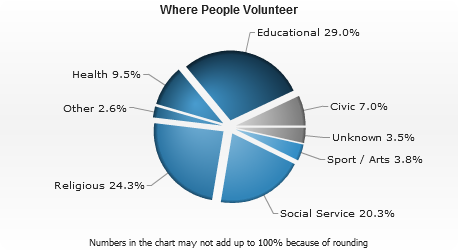
For example, the employment rate for non-working persons who volunteered between 20 and 49 hours per year was 57 percent higher than the rate of non-voluntewhere people volunteerers. And controlling for personal characteristics such as age, gender and ethnicity, there was a substantial increase (6.8 percentage points) in the probability of employment for persons who volunteered between 20 and 99 hours per year.

In Connecticut, among the many ways to volunteer - most with local community-based organizations - the United Way has developed a web site, www.volunteerConnecticut.org , to match interested individuals with volunteer opportunities.  The Connecticut Association of Nonprofits, at www.ctnonprofits.org, also has a website devoted to volunteering.

The latest statewide data for Connecticut, complied by the Corporation for National & Community Service using 2011 data, indicates that volunteerism is considerable across the state:

  • 28.5% of residents volunteer, ranking them 22nd among the 50 states & Washington, DC.
  • 29.3 volunteer hours per resident.
  • 72.8% do favors for their neighbors.
  • 793,710 volunteers.
  • 81.7 million hours of service.
  • $1.8 billion of service contributed.

In the survey, many volunteers did not volunteer in the professional field in which they were seeking employment. This suggests that even without accumulating the relevant human capital for the fields in which they were seeking employment, volunteering may have signaled to prospective employers that the applicant possessed desirable qualities such as motivation, creativity and reliability.

Thus, volunteering could be particularly useful for job applicants with little prior experience such as recent college graduates or persons attempting to re-enter the labor market after a period of joblessness. The data did not indicate that volunteering has a significant impact on wage growth of the typicheaderal person.

For purposes of the survey, a volunteer was defined as person who performed unpaid volunteer activities over the previous 12 months through or for an association, society or group of people who share a common interest.  Volunteering in an informal manner, such as helping an elderly neighbor is not included in the survey. Unpaid work, including internships for for-profit employers, is also not considered volunteer work, while some other types of unpaid internships may be included, if the person considered it volunteering rather than work.

Connecticut's 40 Fastest Growing Technology Companies Earn Statewide Recognition

Some of the names may be familiar – Priceline, Alexion, TicketNetwork, HigherOne - but most will likely not be, despite steady track-records of rapid growth in their respective technology industries.  The Connecticut Technology Council (CTC) and Marcum LLP have announced the 2013 Marcum Tech Top 40 list of the 40 fastest growing technology companies in Connecticut.

Companies earn their place on the list on the basis of revenue growth over the last four years. They must have at least $3 million in revenue, with several of the public companies this year approaching or exceeding $1 billion in revenue.  Companies were grouped into six technology areas:  Software, IT Services, Life Sciences, Advanced Manufacturing, New Media/Internet/Telecom, and Energy/ Environmental Technologies.

The 2013 list features primarily privately held companies, but 14 public companies also made the list, including: Priceline.com, Rogers Corporation, Gartner Inc. and Alexion Pharmaceuticals.

Geographically, Fairfield County is home to 14 companies this year, followed by Hartford County with 10 companies and New Haven County with eight companies.

The winners in each of the six categories will be announced on September 26, and one company will be named overall winner for demonstrating the greatest percentage growth in revenue across all the technology verticals. The six category winners from 2012 – RSL Fiberstate tech Systems, FuelCell Energy, eVariant, Datto, and Alexion – as well as overall winner iSend, all earned a spot on this year’s Top 40.

Matthew Nemerson, CTC’s President & CEO said, “Connecticut is proud of its remarkable heritage of innovation and invention. The 2013 list of Tech Top 40 companies reinforces the vital role the tech sector plays in job creation. These 40 firms are also successful models in their technology verticals and deserve the attention this event brings them.”

The Connecticut Technology Council is a statewide association of technology oriented companies and institutions, providing leadership in areas of policy advocacy, community building and assistance for growing companies. Speaking for over 2,000 companies that employ some 200,000 residents, the Connecticut Technology Council seeks to provide a strong and urgent voice in support of the creation of a culture of innovation.

“Every year, the program serves as a reminder never to underestimate the promise of a great idea, the role of passion, the importance of management talent, and the significance of having the right team. Marcum is extremely proud to partner with the Connecticut Technology Council in presenting this year’s outstanding class of top technology companies. We enthusiastically congratulate all the winners,” said Anthony P. Scillia, Partner-in-Charge, Marcum New England.

CTC and Marcum LLP will honor the Top 40 companies September 26, 2013 at the Oakdale Theater in Wallingford. This year’s event sponsors include: title sponsor Marcum LLP, AT&T Connecticut, Comcast Business Class, Connecticut Innovations, MY HR Supplier, the law firm of Pullman & Comley, OneBeacon Insurance Group, Robert Half Technology, TriNet HR Corporation, UK Trade & Investment, Webster Bank, Xand, and Wellstone Insurance.  To register for the September 26 event, visit http://www.ct.org/Tech_Top_40.asp.

2013 Marcum Tech Top 40 Companies by Industry Category Advanced Manufacturing Amphenol Corp., Wallingford APS Technology, Inc., Wallingford ATMI Inc., Danbury Dymax Corporation, Torrington EDAC Technologies Corp., Farmington Foster Corporation, Putnam Harman International Industries, Stamford Rogers Corporation, Rogers RSL Fiber Systems, LLC, East Hartford

Energy/Environment/Green Technology FuelCell Energy, Inc., Danbury Proton OnSite, Wallingford

IT Services Amnet Systems LLC, Stamford Cervalis LLC, Shelton Cierant Corporation, Danbury Datto Inc., Norwalk Gartner Inc., Stamford Information Services Group Inc., Stamford VLink Inc., Hartford

Life Sciences Alexion Pharmaceuticals, Inc., Cheshire Bio-Med Devices, Inc., Guilford Metrum Research Group, LLC, Tariffville New Media/Internet/Telecom EasySeat, LLC, Plainville iSend, LLC, Middlebury JobTarget, LLC, New London M2 Media Group, Stamford Mediabistro Inc., Norwalk Priceline.com, Inc., Norwalk TicketNetwork, South Windsor

Software Clarity Software Solutions, Inc., Guilford Core Informatics, LLC, Branford ePath Learning, Inc., New London eVariant, Inc., Farmington Evolution1, Inc., Avon Higher One, Inc., New Haven PASSUR Aerospace, Inc., Stamford Shoptech Corporation, Glastonbury Square 9 Softworks, Inc., New Haven SS&C Technologies Holdings Inc, Windsor Tangoe, Inc., Orange Triple Point Technology, Westport

Early Childhood Education Supported Nationwide, Poll Finds; CT Improving Coordination of Programs

The First Five Years Fund (FFYF), a national advocate for preschool education, has released the results of a national survey of voters which finds that support across the political spectrum for a plan to help states and local communities provide better early childhood education programs to parents of children from birth to age five.

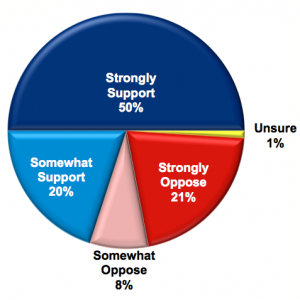
Conducted by the research team of Public Opinion Strategies and Hart Research, the national telephone survey found that 70 percent of Americans favored providing all low- and moderate-income 4-year-olds with voluntary access to high-quality preschool programs as well as making available more early education and child care programs for infants and toddlers and home visiting and parent education programs for families.FFYE logo

In Connecticut, Gov. Dannel P. Malloy signed an executive order in June that established an Office of Early Childhood (OEC)  in the state, bringing together various programs that had been under the jurisdiction of a number of state agencies.

The Office is “comprised of related programs that were previously housed in five separate state agencies — the Department of Education’s School Readiness program, the Department of Social Services’ Care for Kids, Children’s Trust Fund, and other childcare programs, the Department of Public Health’s childcare licensing program, the Department of Developmental Services’ Birth to Three program, and the Board of Regents’ Charts a Course program — the OEC will improve continuity and the reach of early childhood programs.”

The General Assembly failed to pass a bill creating the new office on the final night of the legislative session in early June, but the state budget allocated $127 million in the first year and $232 million in the second year to the office.  Instead of leaving those dollars hanging in legislative limbo, CT News Junkie reported, the executive order seeks to offer a temporary solution, on an issue that Gov. Malloy has long advocated.

Myra Jones-Taylor was appointed by the Governor as the agency's executive director. She is a member of the New Haven Board of Education and served most recently as director of the state Office of Early Childhood Planning. The Office of Early Childhood is responsible for providing “a comprehensive, collaborative system for delivering improved programs and services to children age zero to five and their parents.”

Nationally, support for the preschool proposal increased to 77 percent when respondents were told explicitly that the proposal would not add to the deficit, FFYF said, including 72 percent support from Republicans, 71 percent from Independents and 88 percent from Democrats. A majority of voters (51 percent) strongly support such a proposal.

Other findings from the FFYF_poll-2-300x300survey include:

  •  Ensuring children get a strong start in life was seen as an important national priority by 86 percent of respondents—second only to increasing jobs and economic growth—and 13 points higher than reducing the tax burden on families.
  • Voters say the country is not doing enough on this issue, with 70 percent saying it is an area we need to “do more.” This includes large majorities of voters who have children (77 percent) and those who do not have children in their household (66 percent). Virtually no one (2 percent) thinks we’re doing too much already.

“Americans rightly perceive a need for all children to gain the knowledge and skills necessary to start kindergarten - and life - on the right foot,” said David Nee, Executive Director of the Hamden-based  William Caspar Graustein Memorial Fund.  “Our own experience shows that early is good, and earlier is better.  Infants and toddlers and their families need our support. We can do more, now, to achieve this goal."

In addition to support from large majorities of voters across the political spectrum, key demographic groups are in support of the proposal, including Hispanics (83 percent), African Americans (82 percent), suburban women (68 percent) and young voters under the age of 35 (79 percent).

The survey found that three in five voters (63 percent) want Congress to act on legislation now rather than wait until later (32 percent). And even when presented with “an impassioned argument” from both supporters and critics of making such an investment in quality, voluntary early childhood learning and child care, Americans continue to express their overwhelming support of the proposal.

The survey was conducted from July 8-11 by the bipartisan research team of Public Opinion Strategies and Hart Research on behalf of FFYF. The demographically representative sample of 800 voters was distributed proportionally throughout the country and reached registered voters on landlines and cell phones. The survey has a margin of error of plus or minus 3.46 percentage point.

CT Among Best in Nation with Lowest Toxic Air Pollution; KY, OH, PA Among Worst

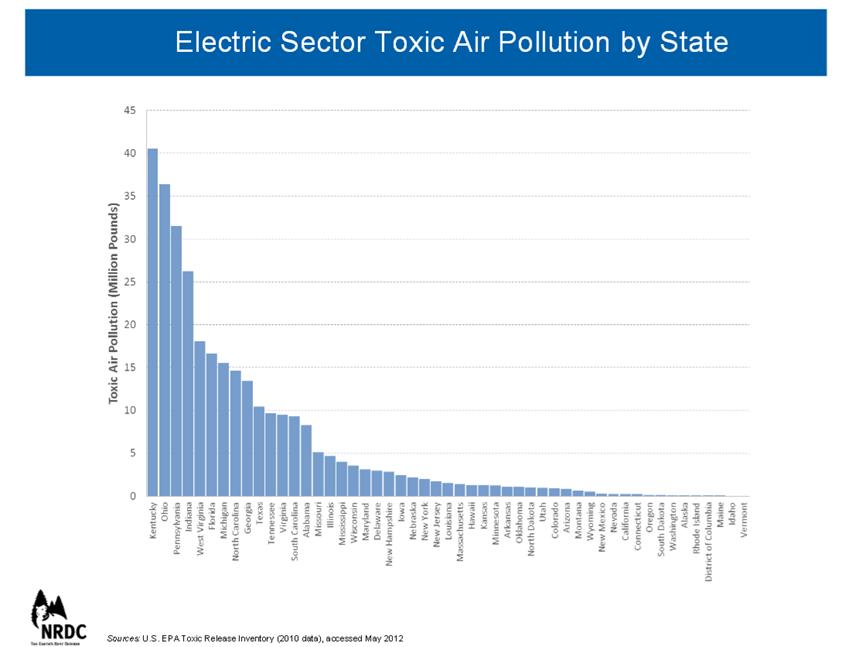
Residents of Kentucky, Ohio and Pennsylvania are exposed to more toxic air pollution from coal-fired power plants than in any other state, according to an analysis by the Natural Resources Defense Council (NRDC), leading the organization’s “toxic 20.”

At the same time, the report foundtoxic air pollution by state a 19 percent decrease in all air toxics emitted from power plants in 2010, the most recent data available, compared to 2009 levels. Connecticut ranks 42nd in toxic air pollution and 43rd in mercury air pollution according to the newly released data, among the lowest levels in the nation.

The drop in toxic levels nationwide is attributed to two factors: the increasing use by power companies of natural gas, which has become cheaper and is cleaner burning than coal; and the installation of state-of-the-art pollution controls by many plants--in anticipation of new health protections issued by the Environmental Protection Agency (EPA).

Finalized in 2011, EPA’s Mercury and Airby sector Toxics standards will cut mercury air pollution by 79 percent from 2010 levels, beginning in 2015. Connecticut is one of only 13 states to have electric sector mercury regulations that are at least as stringent as the EPA’s proposed utility air toxics rule, according to the report.

In the second edition of “Toxic Power: How Power Plants Contaminate Our Air and States,” NRDC also found that coal- and oil-fired power plants still contribute nearly half (44 percent) of all the toxic air pollution reported to the Environmental Protection Agency’s Toxics Release Inventory (TRI). The report also ranks the states by the amount of their toxic air pollution levels.

Among Connecticut’s neighboring states, New Hampshire at #21, New York at #24 and Massachusetts at #27 narrowly missed being included in the “toxic 20”.  Rhode Island was #47, Maine was #49 and Vermont was #50.

Newly installed EPA Administrator Gina McCarthy, a former Connecticut Commissioner of Environmental Protection, has spent the past four years with responsibility over EPA’s air pollution regulations as the assistant administrator of the EPA's Office of Air and Radiation.report

With pollution reductions resulting from the upcoming standard, it is estimated that as many as 11,000 premature deaths and 130,000 asthma attacks, 5,700 hospital visits, 4,700 heart attacks, and 2,800 cases of chronic bronchitis will be avoided in 2016. The public health improvements are also estimated to save $37 billion to $90 billion in health costs, and prevent up to 540,000 missed work or “sick” days each year.

Franz Matzner, NRDC associate director of Government Affairs, said:  “For too long, Americans have had no choice but to breathe toxic air pollution. Thanks to the EPA, the air is getting cleaner.”  Despite the overall reductions in total emissions, 18 of the Toxic 20 from 2009 remain in the 2010 list, although several states have made significant improvements highlighted in the report.  The states on the "Toxic 20" list (from worst to best) are:

  1. Kentucky
  2. Ohio
  3. Pennsylvania
  4. Indiana
  5. West Virginia
  6. Florida
  7. Michigan
  8. North Carolina
  9. Georgia
  10. Texas
  11. Tennessee
  12. Virginia
  13. South Carolina
  14. Alabama
  15. Missouri
  16. Illinois
  17. Mississippi
  18. Wisconsin
  19. Maryland
  20. Delaware toxic air


Nonprofits Boost Voter Turnout When They Reach Out to Clients, Study Finds

Voter turnout increases when nonprofit organizations are doing the asking.  That is the finding of a new study by Nonprofit Vote, which tracked the impact of nonprofit voter engagement efforts in seven states.  In addition, the demographic characteristics of the new voters is differs from the general voting population in ways that respond in traditional voting disparities.
“The clients and constituents engaged by nonprofits were markedly more diverse, lower income and younger than all registered voters in the seven states, made up of populations with a history of lower voter turnout in past elections,” the study indicated in its analysis of 2012 voting.  Among the key findings:

Voter turnout among those contacted by nonprofits was 74%, six points above the 68% turnout rate for all registered voters. In fact, nonprofit voters outperformed their counterparts across all demographics.

Voter turnout among voters contacted by nonprofits compared to all registered voters was 18 points higher for Latino voters, 15 points higher for voters under the age of 30, and 1turnout5 points higher for voters with household incomes under $25,000.

“The action by nonprofits had its biggest impact on turnout among least-likely voters – those that campaigns typically disregard based on low ‘voter propensity scores’ assigned before the election to predict their likelihood to vote,” the analysis indicated.  Young voters, ages 18-29, topped the list.

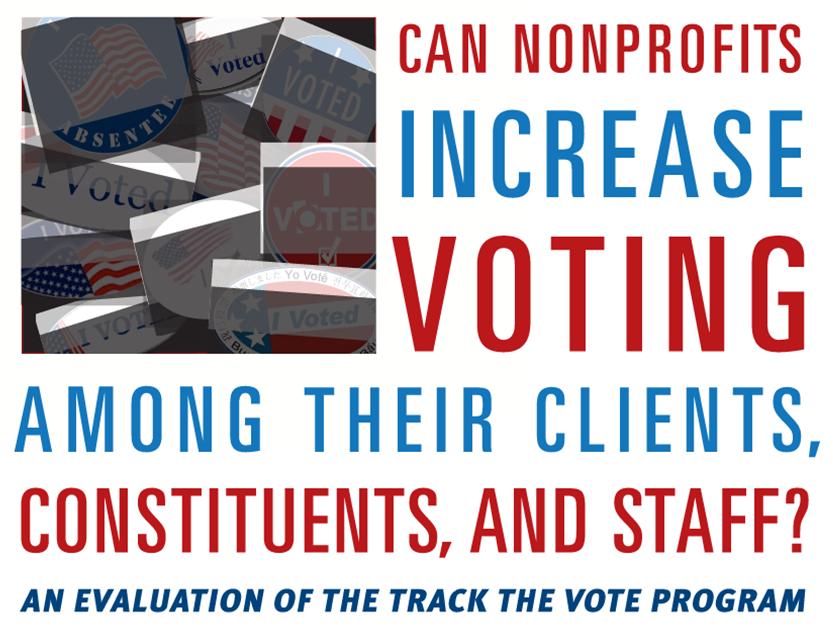
The report--Can Nonprofits Increase Voting Among Their Clients, Constituents, and Staff? An Evaluation of the Track the Vote Program—reflects data compiled from 94 nonprofits in seven states that registered or collected voter pledges from 33,741 clients and constituents during services.

In Connecticut, the Connecticut Association of Nonprofits participated in Nonprofit Vote, a nationwide initiative to involve nonprofits in efforts to urge people to register and vote.  The organization’s September 2012 newsletter, in an article by Nonprofit Vote, pointed out that “Many organizations now recognize the value of voter engagement as a key component in their advocacy toolkit and are no longer watching passively from the sidelines on Election Day.”

 “What stood out the most in the data,” the report found, “was the effect the personal outreach efforts of the nonprofits had in shrinking voter turnout disparities evident among all registered voters and in Census surveys generally.”voting nonprofits

The top reasons that nonprofit organizations cited for conducting voter engagement were to advance their organization’s mission and empower their clients.  Nonprofits used a range of agency-based strategies to engage voters, and the most identifiable success factors were motivated staff and volunteers and strong support from a state or national partner in the form of training, check-ins and materials, the report said.

"Nonprofit service providers are well positioned to integrate new Americans into civic life and engage others who need encouragement to exercise their right to vote. This report provides useful evidence on how service providers can help to increase voter participation of populations new to the political process," said Elizabeth T. Boris, Director of the Center on Nonprofits and Philanthropy at the Urban Institute.

The states participating in the study were Arizona, Louisiana, Massachusetts, Michigan, Minnesota, North Carolina, and Ohio.  The Center for Information & Research on Civic Learning & Engagement (CIRCLE) at tufts University assisted in the analysis.

Noting that past research has found that personal contact with potential voters strongly encourages voting, the report indicated that the data “speaks broadly to the power of personal contact in mobilizing people to vote.  More specifically it affirms the impact of the personal contact coming from someone or an organization known to and trusted by the voter.”

NVRD logoIf you’re planning ahead for voter registration efforts this fall, the National Association of Secretaries of the State (NASS) approved a resolution last month that establishes September 24, 2013 as National Voter Registration Day.  Within the resolution, the Secretaries, who serve as their states’ top elections officials, called for “new and innovative methods” of voter registration.

Founded in 2005, Nonprofit VOTE partners with America’s nonprofits to help the people they serve participate and vote.  The organization is described as the leading source of nonpartisan resources to help nonprofits integrate voter engagement into their ongoing activities and services.

NASS Resolution Establishing September 24th, 2013 as National Voter Registration Day